

Key Insights
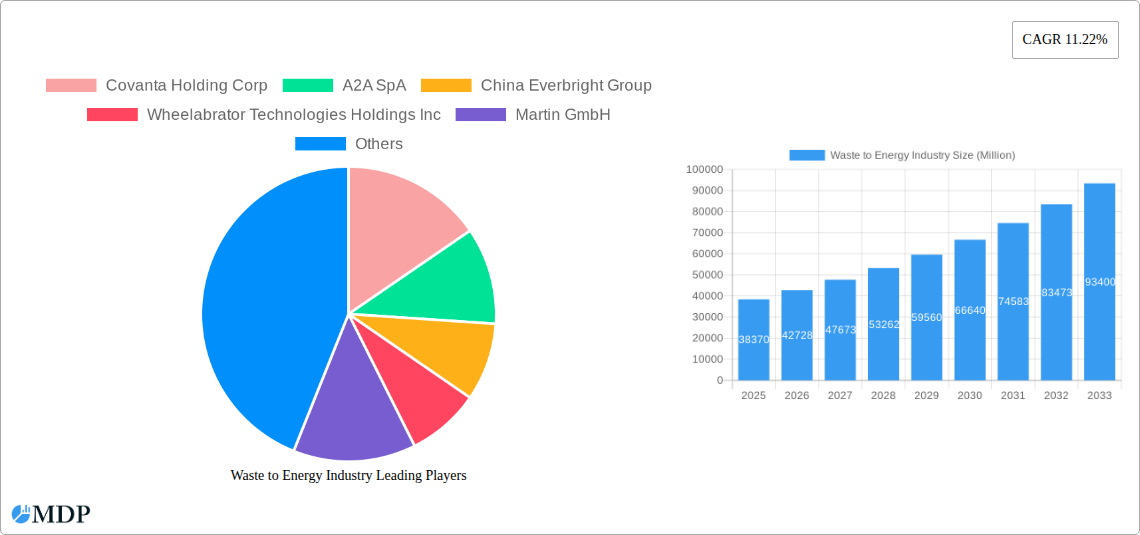
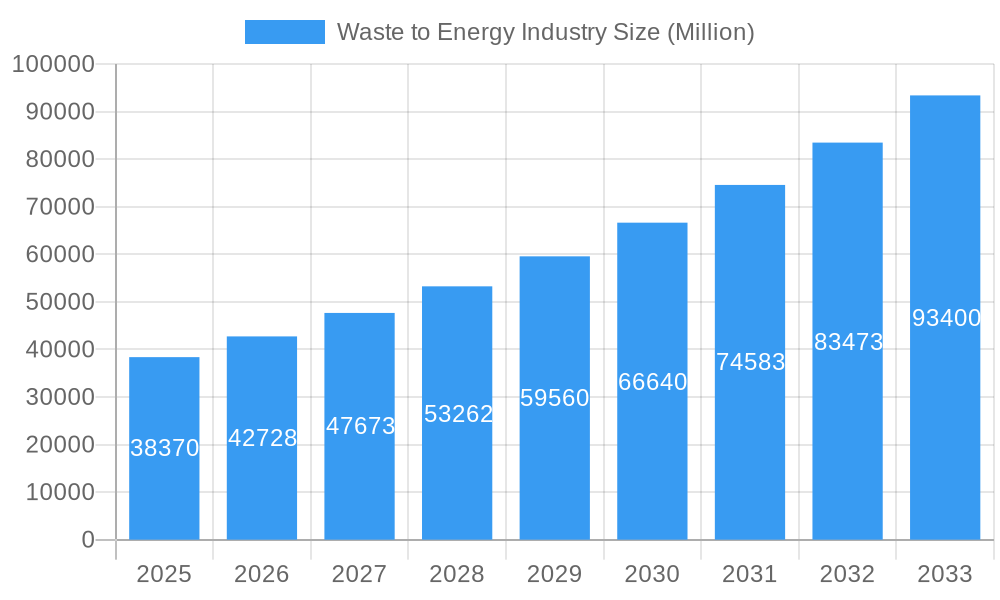
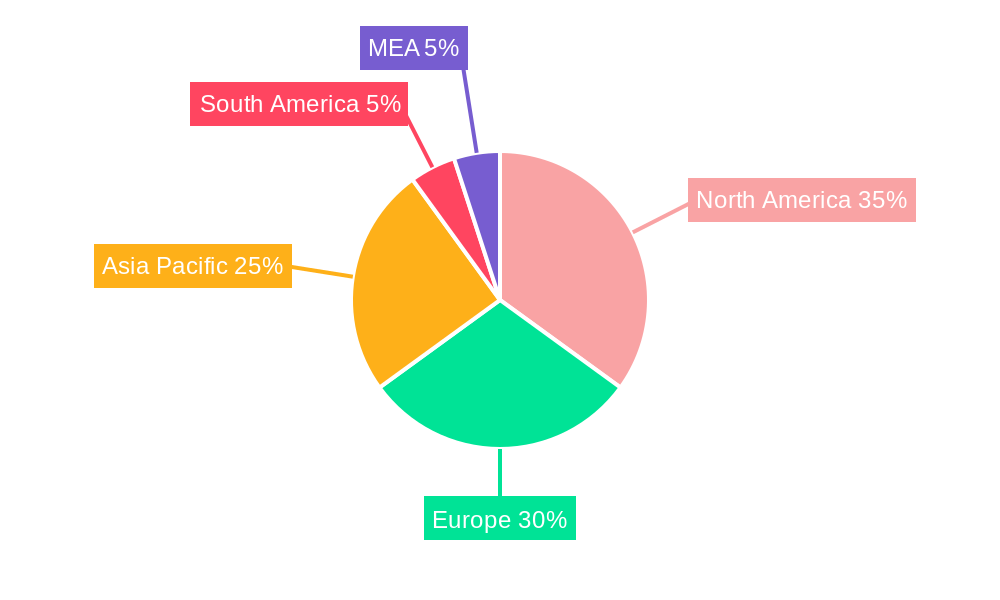
The global waste-to-energy (WtE) market, valued at $38.37 billion in 2025, is projected to experience robust growth, driven by escalating environmental concerns, stringent waste management regulations, and the increasing need for sustainable energy solutions. A compound annual growth rate (CAGR) of 11.22% from 2025 to 2033 indicates a significant expansion, with the market expected to surpass $100 billion by 2033. Key drivers include government initiatives promoting renewable energy sources, rising landfill costs, and advancements in WtE technologies, particularly in thermal and biological conversion methods. Technological advancements are leading to higher energy efficiency and reduced emissions, making WtE increasingly attractive. The market segmentation reveals a strong presence of physical, thermal, and biological technologies, each catering to different waste streams and energy demands. North America and Europe currently hold significant market shares, fueled by established infrastructure and supportive policies. However, the Asia-Pacific region is poised for substantial growth, driven by rapid urbanization and industrialization, leading to increased waste generation and the need for efficient waste management solutions. Challenges include high initial capital investment for WtE plants, public perception concerns regarding emissions and potential environmental impacts, and the need for consistent waste supply to ensure plant profitability.
Waste to Energy Industry Market Size (In Billion)
The geographical distribution of the WtE market reflects the varying levels of technological adoption and waste management strategies across different regions. North America, with its established regulatory framework and mature infrastructure, benefits from a significant market share. Europe, with its strong focus on sustainability and circular economy principles, also contributes substantially. The Asia-Pacific region, however, is experiencing the fastest growth, fueled by rising populations, increasing industrial output, and governmental support for renewable energy initiatives. This growth will be predominantly driven by countries like China, India, and Japan, which are rapidly implementing WtE projects to address their escalating waste management challenges. South America and the Middle East & Africa regions also present significant, albeit smaller, opportunities, as these regions seek to improve their waste management infrastructure and diversify their energy portfolios. The leading companies in this sector—including Covanta Holding Corp, A2A SpA, and Waste Management Inc—are actively investing in technological advancements and geographical expansion to capitalize on the growing market potential.
Waste to Energy Industry Company Market Share
Waste-to-Energy Market Report: 2019-2033 Forecast
This comprehensive report provides a detailed analysis of the global waste-to-energy market, offering invaluable insights for stakeholders, investors, and industry professionals. With a study period spanning 2019-2033, a base year of 2025, and a forecast period of 2025-2033, this report delivers actionable intelligence on market dynamics, technological advancements, and key players shaping the future of waste-to-energy solutions. The market is projected to reach xx Million USD by 2033, exhibiting a significant CAGR.
Waste to Energy Industry Market Dynamics & Concentration
The global waste-to-energy market is characterized by a moderately concentrated landscape with several major players controlling significant market share. Innovation is driven by stringent environmental regulations, growing urbanization, and the need for sustainable energy solutions. Key regulatory frameworks, including carbon emission targets and waste management policies, significantly influence market growth. Product substitutes, such as landfills and anaerobic digestion, exert competitive pressure, while emerging technologies continually challenge the status quo. End-user trends toward sustainable practices and circular economy models are fueling demand. Furthermore, the market witnesses consistent M&A activity, with over xx deals recorded between 2019 and 2024, leading to consolidation and increased market concentration.
- Market Concentration: Top 10 players hold approximately xx% of the market share in 2025.
- Innovation Drivers: Stringent environmental regulations, growing energy demand, and advancements in waste processing technologies.
- Regulatory Frameworks: Differing regulations across regions influence market dynamics and investment decisions.
- M&A Activity: Over xx merger and acquisition deals occurred between 2019 and 2024, consolidating market players.
Waste to Energy Industry Industry Trends & Analysis
The waste-to-energy market is experiencing robust growth, driven by several factors. Increasing waste generation, coupled with limited landfill capacity, compels governments and businesses to adopt sustainable waste management solutions. Technological advancements, particularly in thermal and biological technologies, are improving efficiency and reducing environmental impact. Consumer preferences are shifting towards eco-friendly options, increasing the demand for recycled materials and renewable energy sources. Competitive dynamics are characterized by technological innovation, cost optimization, and strategic partnerships. The market is expected to maintain a healthy CAGR of xx% during the forecast period, with significant market penetration in developing economies. Technological disruptions, such as advancements in AI-powered waste sorting and plasma gasification, are reshaping industry landscapes.
Leading Markets & Segments in Waste to Energy Industry
The European Union currently dominates the waste-to-energy market, fueled by stringent environmental regulations and significant investments in renewable energy infrastructure. Germany, France, and the UK are key contributors due to robust waste management policies, established waste-to-energy infrastructure, and favorable economic conditions. Within technologies, thermal conversion currently holds the largest market share, owing to its established technology and relative maturity. However, biological treatment is witnessing rapid growth due to its environmental benefits and cost-effectiveness in specific applications.
- Key Drivers in Europe: Strong environmental regulations, robust renewable energy policies, mature waste management infrastructure, and high waste generation rates.
- Key Drivers in Thermal Conversion: High energy recovery rates, established technology, and suitability for diverse waste streams.
- Key Drivers in Biological Conversion: Growing environmental concerns, lower capital investment requirements, and suitability for organic waste streams.
Waste to Energy Industry Product Developments
Recent product innovations focus on improving efficiency, reducing emissions, and expanding the range of waste materials suitable for processing. Advanced gasification technologies, combined heat and power (CHP) systems, and improved waste sorting techniques enhance overall efficiency. New applications include the integration of waste-to-energy plants into smart city initiatives, enabling decentralized energy generation and waste management. These developments offer competitive advantages through reduced operating costs, improved energy yields, and enhanced environmental performance.
Key Drivers of Waste to Energy Industry Growth
The waste-to-energy industry’s growth is propelled by a confluence of factors. Stringent environmental regulations, such as the EU's Landfill Directive, are driving the shift away from landfilling towards more sustainable alternatives. Growing urbanization and rising energy demand necessitate the exploration of diverse renewable energy sources, making waste-to-energy a compelling solution. Furthermore, technological advancements, leading to increased efficiency and reduced environmental impact, are crucial drivers of market expansion.
Challenges in the Waste to Energy Industry Market
The waste-to-energy industry faces several challenges, including high capital costs for plant construction, stringent regulatory approvals and permitting processes, and fluctuating waste composition and quality, impacting operational efficiency. Supply chain disruptions can affect the availability of critical components, while competition from other waste management technologies and renewable energy sources presents a constant challenge. The impact of these challenges is quantified by xx Million USD in delayed projects and operational inefficiencies per year in 2024.
Emerging Opportunities in Waste to Energy Industry
Long-term growth is fueled by several promising opportunities. Advancements in AI-powered waste sorting technologies will improve efficiency and reduce reliance on manual sorting, reducing costs and boosting yields. Strategic partnerships between waste management companies and energy providers will streamline the integration of waste-to-energy into wider energy grids. Expansion into developing markets with rapidly growing waste generation and limited waste management infrastructure presents substantial untapped potential.
Leading Players in the Waste to Energy Industry Sector
- Covanta Holding Corp
- A2A SpA
- China Everbright Group
- Wheelabrator Technologies Holdings Inc
- Martin GmbH
- Hitachi Zosen Corp
- Suez Group
- China Jinjiang Environment Holding Co Ltd
- Veolia Environnement SA
- Waste Management Inc
- Babcock & Wilcox Enterprises Inc
- Xcel Energy Inc
- MVV Energie AG
- Mitsubishi Heavy Industries Ltd
Key Milestones in Waste to Energy Industry Industry
- January 2023: Lostock Sustainable Energy Plant awarded Babcock & Wilcox a USD 65 million contract for a waste-to-energy plant near Manchester, UK, boosting the UK's renewable energy capacity.
- April 2023: Egypt signed a USD 120 million contract for its first solid waste-to-electricity facility in Abou Rawash, Giza, showcasing the growing interest in waste-to-energy solutions in developing nations and aligning with Egypt Vision 2030.
Strategic Outlook for Waste to Energy Industry Market
The waste-to-energy market presents a compelling investment opportunity, driven by the need for sustainable waste management and renewable energy solutions. Future growth will be fueled by technological advancements, increasing environmental regulations, and the expansion of waste-to-energy infrastructure globally. Strategic partnerships and collaborations between industry players will facilitate innovation and accelerate market growth, leading to significant economic and environmental benefits.
Waste to Energy Industry Segmentation
-
1. Technology
- 1.1. Physical
- 1.2. Thermal
- 1.3. Biological
Waste to Energy Industry Segmentation By Geography
-
1. North America
- 1.1. United States
- 1.2. Canada
- 1.3. Rest of North America
-
2. Asia Pacific
- 2.1. China
- 2.2. India
- 2.3. Japan
- 2.4. Malaysia
- 2.5. Thailand
- 2.6. Indonesia
- 2.7. Vietnam
- 2.8. Rest of Asia Pacific
-
3. Europe
- 3.1. Spain
- 3.2. Nordic
- 3.3. United Kingdom
- 3.4. Russia
- 3.5. Turkey
- 3.6. Germany
- 3.7. Italy
- 3.8. Rest of Europe
-
4. Middle East and Africa
- 4.1. United Arab Emirates
- 4.2. Saudi Arabia
- 4.3. South Africa
- 4.4. Nigeria
- 4.5. Qatar
- 4.6. Egypt
- 4.7. Rest of Middle East and Africa
-
5. South America
- 5.1. Brazil
- 5.2. Argentina
- 5.3. Colombia
- 5.4. Rest of South America
Waste to Energy Industry Regional Market Share
Geographic Coverage of Waste to Energy Industry
Waste to Energy Industry REPORT HIGHLIGHTS
| Aspects | Details |
|---|---|
| Study Period | 2020-2034 |
| Base Year | 2025 |
| Estimated Year | 2026 |
| Forecast Period | 2026-2034 |
| Historical Period | 2020-2025 |
| Growth Rate | CAGR of 11.22% from 2020-2034 |
| Segmentation |
|
Table of Contents
- 1. Introduction
- 1.1. Research Scope
- 1.2. Market Segmentation
- 1.3. Research Objective
- 1.4. Definitions and Assumptions
- 2. Executive Summary
- 2.1. Market Snapshot
- 3. Market Dynamics
- 3.1. Market Drivers
- 3.2. Market Restrains
- 3.3. Market Trends
- 3.4. Market Opportunities
- 4. Market Factor Analysis
- 4.1. Porters Five Forces
- 4.1.1. Bargaining Power of Suppliers
- 4.1.2. Bargaining Power of Buyers
- 4.1.3. Threat of New Entrants
- 4.1.4. Threat of Substitutes
- 4.1.5. Competitive Rivalry
- 4.2. PESTEL analysis
- 4.3. BCG Analysis
- 4.3.1. Stars (High Growth, High Market Share)
- 4.3.2. Cash Cows (Low Growth, High Market Share)
- 4.3.3. Question Mark (High Growth, Low Market Share)
- 4.3.4. Dogs (Low Growth, Low Market Share)
- 4.4. Ansoff Matrix Analysis
- 4.5. Supply Chain Analysis
- 4.6. Regulatory Landscape
- 4.7. Current Market Potential and Opportunity Assessment (TAM–SAM–SOM Framework)
- 4.8. MDP Analyst Note
- 4.1. Porters Five Forces
- 5. Market Analysis, Insights and Forecast 2021-2033
- 5.1. Market Analysis, Insights and Forecast - by Technology
- 5.1.1. Physical
- 5.1.2. Thermal
- 5.1.3. Biological
- 5.2. Market Analysis, Insights and Forecast - by Region
- 5.2.1. North America
- 5.2.2. Asia Pacific
- 5.2.3. Europe
- 5.2.4. Middle East and Africa
- 5.2.5. South America
- 5.1. Market Analysis, Insights and Forecast - by Technology
- 6. Global Waste to Energy Industry Analysis, Insights and Forecast, 2021-2033
- 6.1. Market Analysis, Insights and Forecast - by Technology
- 6.1.1. Physical
- 6.1.2. Thermal
- 6.1.3. Biological
- 6.1. Market Analysis, Insights and Forecast - by Technology
- 7. North America Waste to Energy Industry Analysis, Insights and Forecast, 2020-2032
- 7.1. Market Analysis, Insights and Forecast - by Technology
- 7.1.1. Physical
- 7.1.2. Thermal
- 7.1.3. Biological
- 7.1. Market Analysis, Insights and Forecast - by Technology
- 8. Asia Pacific Waste to Energy Industry Analysis, Insights and Forecast, 2020-2032
- 8.1. Market Analysis, Insights and Forecast - by Technology
- 8.1.1. Physical
- 8.1.2. Thermal
- 8.1.3. Biological
- 8.1. Market Analysis, Insights and Forecast - by Technology
- 9. Europe Waste to Energy Industry Analysis, Insights and Forecast, 2020-2032
- 9.1. Market Analysis, Insights and Forecast - by Technology
- 9.1.1. Physical
- 9.1.2. Thermal
- 9.1.3. Biological
- 9.1. Market Analysis, Insights and Forecast - by Technology
- 10. Middle East and Africa Waste to Energy Industry Analysis, Insights and Forecast, 2020-2032
- 10.1. Market Analysis, Insights and Forecast - by Technology
- 10.1.1. Physical
- 10.1.2. Thermal
- 10.1.3. Biological
- 10.1. Market Analysis, Insights and Forecast - by Technology
- 11. South America Waste to Energy Industry Analysis, Insights and Forecast, 2020-2032
- 11.1. Market Analysis, Insights and Forecast - by Technology
- 11.1.1. Physical
- 11.1.2. Thermal
- 11.1.3. Biological
- 11.1. Market Analysis, Insights and Forecast - by Technology
- 12. Competitive Analysis
- 12.1. Company Profiles
- 12.1.1 Covanta Holding Corp
- 12.1.1.1. Company Overview
- 12.1.1.2. Products
- 12.1.1.3. Company Financials
- 12.1.1.4. SWOT Analysis
- 12.1.2 A2A SpA
- 12.1.2.1. Company Overview
- 12.1.2.2. Products
- 12.1.2.3. Company Financials
- 12.1.2.4. SWOT Analysis
- 12.1.3 China Everbright Group
- 12.1.3.1. Company Overview
- 12.1.3.2. Products
- 12.1.3.3. Company Financials
- 12.1.3.4. SWOT Analysis
- 12.1.4 Wheelabrator Technologies Holdings Inc
- 12.1.4.1. Company Overview
- 12.1.4.2. Products
- 12.1.4.3. Company Financials
- 12.1.4.4. SWOT Analysis
- 12.1.5 Martin GmbH
- 12.1.5.1. Company Overview
- 12.1.5.2. Products
- 12.1.5.3. Company Financials
- 12.1.5.4. SWOT Analysis
- 12.1.6 Hitachi Zosen Corp
- 12.1.6.1. Company Overview
- 12.1.6.2. Products
- 12.1.6.3. Company Financials
- 12.1.6.4. SWOT Analysis
- 12.1.7 Suez Group
- 12.1.7.1. Company Overview
- 12.1.7.2. Products
- 12.1.7.3. Company Financials
- 12.1.7.4. SWOT Analysis
- 12.1.8 China Jinjiang Environment Holding Co Ltd
- 12.1.8.1. Company Overview
- 12.1.8.2. Products
- 12.1.8.3. Company Financials
- 12.1.8.4. SWOT Analysis
- 12.1.9 Veolia Environnement SA
- 12.1.9.1. Company Overview
- 12.1.9.2. Products
- 12.1.9.3. Company Financials
- 12.1.9.4. SWOT Analysis
- 12.1.10 Waste Management Inc
- 12.1.10.1. Company Overview
- 12.1.10.2. Products
- 12.1.10.3. Company Financials
- 12.1.10.4. SWOT Analysis
- 12.1.11 Babcock & Wilcox Enterprises Inc
- 12.1.11.1. Company Overview
- 12.1.11.2. Products
- 12.1.11.3. Company Financials
- 12.1.11.4. SWOT Analysis
- 12.1.12 Xcel Energy Inc
- 12.1.12.1. Company Overview
- 12.1.12.2. Products
- 12.1.12.3. Company Financials
- 12.1.12.4. SWOT Analysis
- 12.1.13 MVV Energie AG
- 12.1.13.1. Company Overview
- 12.1.13.2. Products
- 12.1.13.3. Company Financials
- 12.1.13.4. SWOT Analysis
- 12.1.14 Mitsubishi Heavy Industries Ltd
- 12.1.14.1. Company Overview
- 12.1.14.2. Products
- 12.1.14.3. Company Financials
- 12.1.14.4. SWOT Analysis
- 12.1.1 Covanta Holding Corp
- 12.2. Market Entropy
- 12.2.1 Company's Key Areas Served
- 12.2.2 Recent Developments
- 12.3. Company Market Share Analysis 2025
- 12.3.1 Top 5 Companies Market Share Analysis
- 12.3.2 Top 3 Companies Market Share Analysis
- 12.4. List of Potential Customers
- 13. Research Methodology
List of Figures
- Figure 1: Global Waste to Energy Industry Revenue Breakdown (Million, %) by Region 2025 & 2033
- Figure 2: Global Waste to Energy Industry Volume Breakdown (Gigawatt, %) by Region 2025 & 2033
- Figure 3: North America Waste to Energy Industry Revenue (Million), by Technology 2025 & 2033
- Figure 4: North America Waste to Energy Industry Volume (Gigawatt), by Technology 2025 & 2033
- Figure 5: North America Waste to Energy Industry Revenue Share (%), by Technology 2025 & 2033
- Figure 6: North America Waste to Energy Industry Volume Share (%), by Technology 2025 & 2033
- Figure 7: North America Waste to Energy Industry Revenue (Million), by Country 2025 & 2033
- Figure 8: North America Waste to Energy Industry Volume (Gigawatt), by Country 2025 & 2033
- Figure 9: North America Waste to Energy Industry Revenue Share (%), by Country 2025 & 2033
- Figure 10: North America Waste to Energy Industry Volume Share (%), by Country 2025 & 2033
- Figure 11: Asia Pacific Waste to Energy Industry Revenue (Million), by Technology 2025 & 2033
- Figure 12: Asia Pacific Waste to Energy Industry Volume (Gigawatt), by Technology 2025 & 2033
- Figure 13: Asia Pacific Waste to Energy Industry Revenue Share (%), by Technology 2025 & 2033
- Figure 14: Asia Pacific Waste to Energy Industry Volume Share (%), by Technology 2025 & 2033
- Figure 15: Asia Pacific Waste to Energy Industry Revenue (Million), by Country 2025 & 2033
- Figure 16: Asia Pacific Waste to Energy Industry Volume (Gigawatt), by Country 2025 & 2033
- Figure 17: Asia Pacific Waste to Energy Industry Revenue Share (%), by Country 2025 & 2033
- Figure 18: Asia Pacific Waste to Energy Industry Volume Share (%), by Country 2025 & 2033
- Figure 19: Europe Waste to Energy Industry Revenue (Million), by Technology 2025 & 2033
- Figure 20: Europe Waste to Energy Industry Volume (Gigawatt), by Technology 2025 & 2033
- Figure 21: Europe Waste to Energy Industry Revenue Share (%), by Technology 2025 & 2033
- Figure 22: Europe Waste to Energy Industry Volume Share (%), by Technology 2025 & 2033
- Figure 23: Europe Waste to Energy Industry Revenue (Million), by Country 2025 & 2033
- Figure 24: Europe Waste to Energy Industry Volume (Gigawatt), by Country 2025 & 2033
- Figure 25: Europe Waste to Energy Industry Revenue Share (%), by Country 2025 & 2033
- Figure 26: Europe Waste to Energy Industry Volume Share (%), by Country 2025 & 2033
- Figure 27: Middle East and Africa Waste to Energy Industry Revenue (Million), by Technology 2025 & 2033
- Figure 28: Middle East and Africa Waste to Energy Industry Volume (Gigawatt), by Technology 2025 & 2033
- Figure 29: Middle East and Africa Waste to Energy Industry Revenue Share (%), by Technology 2025 & 2033
- Figure 30: Middle East and Africa Waste to Energy Industry Volume Share (%), by Technology 2025 & 2033
- Figure 31: Middle East and Africa Waste to Energy Industry Revenue (Million), by Country 2025 & 2033
- Figure 32: Middle East and Africa Waste to Energy Industry Volume (Gigawatt), by Country 2025 & 2033
- Figure 33: Middle East and Africa Waste to Energy Industry Revenue Share (%), by Country 2025 & 2033
- Figure 34: Middle East and Africa Waste to Energy Industry Volume Share (%), by Country 2025 & 2033
- Figure 35: South America Waste to Energy Industry Revenue (Million), by Technology 2025 & 2033
- Figure 36: South America Waste to Energy Industry Volume (Gigawatt), by Technology 2025 & 2033
- Figure 37: South America Waste to Energy Industry Revenue Share (%), by Technology 2025 & 2033
- Figure 38: South America Waste to Energy Industry Volume Share (%), by Technology 2025 & 2033
- Figure 39: South America Waste to Energy Industry Revenue (Million), by Country 2025 & 2033
- Figure 40: South America Waste to Energy Industry Volume (Gigawatt), by Country 2025 & 2033
- Figure 41: South America Waste to Energy Industry Revenue Share (%), by Country 2025 & 2033
- Figure 42: South America Waste to Energy Industry Volume Share (%), by Country 2025 & 2033
List of Tables
- Table 1: Global Waste to Energy Industry Revenue Million Forecast, by Technology 2020 & 2033
- Table 2: Global Waste to Energy Industry Volume Gigawatt Forecast, by Technology 2020 & 2033
- Table 3: Global Waste to Energy Industry Revenue Million Forecast, by Region 2020 & 2033
- Table 4: Global Waste to Energy Industry Volume Gigawatt Forecast, by Region 2020 & 2033
- Table 5: Global Waste to Energy Industry Revenue Million Forecast, by Technology 2020 & 2033
- Table 6: Global Waste to Energy Industry Volume Gigawatt Forecast, by Technology 2020 & 2033
- Table 7: Global Waste to Energy Industry Revenue Million Forecast, by Country 2020 & 2033
- Table 8: Global Waste to Energy Industry Volume Gigawatt Forecast, by Country 2020 & 2033
- Table 9: United States Waste to Energy Industry Revenue (Million) Forecast, by Application 2020 & 2033
- Table 10: United States Waste to Energy Industry Volume (Gigawatt) Forecast, by Application 2020 & 2033
- Table 11: Canada Waste to Energy Industry Revenue (Million) Forecast, by Application 2020 & 2033
- Table 12: Canada Waste to Energy Industry Volume (Gigawatt) Forecast, by Application 2020 & 2033
- Table 13: Rest of North America Waste to Energy Industry Revenue (Million) Forecast, by Application 2020 & 2033
- Table 14: Rest of North America Waste to Energy Industry Volume (Gigawatt) Forecast, by Application 2020 & 2033
- Table 15: Global Waste to Energy Industry Revenue Million Forecast, by Technology 2020 & 2033
- Table 16: Global Waste to Energy Industry Volume Gigawatt Forecast, by Technology 2020 & 2033
- Table 17: Global Waste to Energy Industry Revenue Million Forecast, by Country 2020 & 2033
- Table 18: Global Waste to Energy Industry Volume Gigawatt Forecast, by Country 2020 & 2033
- Table 19: China Waste to Energy Industry Revenue (Million) Forecast, by Application 2020 & 2033
- Table 20: China Waste to Energy Industry Volume (Gigawatt) Forecast, by Application 2020 & 2033
- Table 21: India Waste to Energy Industry Revenue (Million) Forecast, by Application 2020 & 2033
- Table 22: India Waste to Energy Industry Volume (Gigawatt) Forecast, by Application 2020 & 2033
- Table 23: Japan Waste to Energy Industry Revenue (Million) Forecast, by Application 2020 & 2033
- Table 24: Japan Waste to Energy Industry Volume (Gigawatt) Forecast, by Application 2020 & 2033
- Table 25: Malaysia Waste to Energy Industry Revenue (Million) Forecast, by Application 2020 & 2033
- Table 26: Malaysia Waste to Energy Industry Volume (Gigawatt) Forecast, by Application 2020 & 2033
- Table 27: Thailand Waste to Energy Industry Revenue (Million) Forecast, by Application 2020 & 2033
- Table 28: Thailand Waste to Energy Industry Volume (Gigawatt) Forecast, by Application 2020 & 2033
- Table 29: Indonesia Waste to Energy Industry Revenue (Million) Forecast, by Application 2020 & 2033
- Table 30: Indonesia Waste to Energy Industry Volume (Gigawatt) Forecast, by Application 2020 & 2033
- Table 31: Vietnam Waste to Energy Industry Revenue (Million) Forecast, by Application 2020 & 2033
- Table 32: Vietnam Waste to Energy Industry Volume (Gigawatt) Forecast, by Application 2020 & 2033
- Table 33: Rest of Asia Pacific Waste to Energy Industry Revenue (Million) Forecast, by Application 2020 & 2033
- Table 34: Rest of Asia Pacific Waste to Energy Industry Volume (Gigawatt) Forecast, by Application 2020 & 2033
- Table 35: Global Waste to Energy Industry Revenue Million Forecast, by Technology 2020 & 2033
- Table 36: Global Waste to Energy Industry Volume Gigawatt Forecast, by Technology 2020 & 2033
- Table 37: Global Waste to Energy Industry Revenue Million Forecast, by Country 2020 & 2033
- Table 38: Global Waste to Energy Industry Volume Gigawatt Forecast, by Country 2020 & 2033
- Table 39: Spain Waste to Energy Industry Revenue (Million) Forecast, by Application 2020 & 2033
- Table 40: Spain Waste to Energy Industry Volume (Gigawatt) Forecast, by Application 2020 & 2033
- Table 41: Nordic Waste to Energy Industry Revenue (Million) Forecast, by Application 2020 & 2033
- Table 42: Nordic Waste to Energy Industry Volume (Gigawatt) Forecast, by Application 2020 & 2033
- Table 43: United Kingdom Waste to Energy Industry Revenue (Million) Forecast, by Application 2020 & 2033
- Table 44: United Kingdom Waste to Energy Industry Volume (Gigawatt) Forecast, by Application 2020 & 2033
- Table 45: Russia Waste to Energy Industry Revenue (Million) Forecast, by Application 2020 & 2033
- Table 46: Russia Waste to Energy Industry Volume (Gigawatt) Forecast, by Application 2020 & 2033
- Table 47: Turkey Waste to Energy Industry Revenue (Million) Forecast, by Application 2020 & 2033
- Table 48: Turkey Waste to Energy Industry Volume (Gigawatt) Forecast, by Application 2020 & 2033
- Table 49: Germany Waste to Energy Industry Revenue (Million) Forecast, by Application 2020 & 2033
- Table 50: Germany Waste to Energy Industry Volume (Gigawatt) Forecast, by Application 2020 & 2033
- Table 51: Italy Waste to Energy Industry Revenue (Million) Forecast, by Application 2020 & 2033
- Table 52: Italy Waste to Energy Industry Volume (Gigawatt) Forecast, by Application 2020 & 2033
- Table 53: Rest of Europe Waste to Energy Industry Revenue (Million) Forecast, by Application 2020 & 2033
- Table 54: Rest of Europe Waste to Energy Industry Volume (Gigawatt) Forecast, by Application 2020 & 2033
- Table 55: Global Waste to Energy Industry Revenue Million Forecast, by Technology 2020 & 2033
- Table 56: Global Waste to Energy Industry Volume Gigawatt Forecast, by Technology 2020 & 2033
- Table 57: Global Waste to Energy Industry Revenue Million Forecast, by Country 2020 & 2033
- Table 58: Global Waste to Energy Industry Volume Gigawatt Forecast, by Country 2020 & 2033
- Table 59: United Arab Emirates Waste to Energy Industry Revenue (Million) Forecast, by Application 2020 & 2033
- Table 60: United Arab Emirates Waste to Energy Industry Volume (Gigawatt) Forecast, by Application 2020 & 2033
- Table 61: Saudi Arabia Waste to Energy Industry Revenue (Million) Forecast, by Application 2020 & 2033
- Table 62: Saudi Arabia Waste to Energy Industry Volume (Gigawatt) Forecast, by Application 2020 & 2033
- Table 63: South Africa Waste to Energy Industry Revenue (Million) Forecast, by Application 2020 & 2033
- Table 64: South Africa Waste to Energy Industry Volume (Gigawatt) Forecast, by Application 2020 & 2033
- Table 65: Nigeria Waste to Energy Industry Revenue (Million) Forecast, by Application 2020 & 2033
- Table 66: Nigeria Waste to Energy Industry Volume (Gigawatt) Forecast, by Application 2020 & 2033
- Table 67: Qatar Waste to Energy Industry Revenue (Million) Forecast, by Application 2020 & 2033
- Table 68: Qatar Waste to Energy Industry Volume (Gigawatt) Forecast, by Application 2020 & 2033
- Table 69: Egypt Waste to Energy Industry Revenue (Million) Forecast, by Application 2020 & 2033
- Table 70: Egypt Waste to Energy Industry Volume (Gigawatt) Forecast, by Application 2020 & 2033
- Table 71: Rest of Middle East and Africa Waste to Energy Industry Revenue (Million) Forecast, by Application 2020 & 2033
- Table 72: Rest of Middle East and Africa Waste to Energy Industry Volume (Gigawatt) Forecast, by Application 2020 & 2033
- Table 73: Global Waste to Energy Industry Revenue Million Forecast, by Technology 2020 & 2033
- Table 74: Global Waste to Energy Industry Volume Gigawatt Forecast, by Technology 2020 & 2033
- Table 75: Global Waste to Energy Industry Revenue Million Forecast, by Country 2020 & 2033
- Table 76: Global Waste to Energy Industry Volume Gigawatt Forecast, by Country 2020 & 2033
- Table 77: Brazil Waste to Energy Industry Revenue (Million) Forecast, by Application 2020 & 2033
- Table 78: Brazil Waste to Energy Industry Volume (Gigawatt) Forecast, by Application 2020 & 2033
- Table 79: Argentina Waste to Energy Industry Revenue (Million) Forecast, by Application 2020 & 2033
- Table 80: Argentina Waste to Energy Industry Volume (Gigawatt) Forecast, by Application 2020 & 2033
- Table 81: Colombia Waste to Energy Industry Revenue (Million) Forecast, by Application 2020 & 2033
- Table 82: Colombia Waste to Energy Industry Volume (Gigawatt) Forecast, by Application 2020 & 2033
- Table 83: Rest of South America Waste to Energy Industry Revenue (Million) Forecast, by Application 2020 & 2033
- Table 84: Rest of South America Waste to Energy Industry Volume (Gigawatt) Forecast, by Application 2020 & 2033
Frequently Asked Questions
1. What is the projected Compound Annual Growth Rate (CAGR) of the Waste to Energy Industry?
The projected CAGR is approximately 11.22%.
2. Which companies are prominent players in the Waste to Energy Industry?
Key companies in the market include Covanta Holding Corp, A2A SpA, China Everbright Group, Wheelabrator Technologies Holdings Inc, Martin GmbH, Hitachi Zosen Corp, Suez Group, China Jinjiang Environment Holding Co Ltd, Veolia Environnement SA, Waste Management Inc, Babcock & Wilcox Enterprises Inc, Xcel Energy Inc, MVV Energie AG, Mitsubishi Heavy Industries Ltd.
3. What are the main segments of the Waste to Energy Industry?
The market segments include Technology.
4. Can you provide details about the market size?
The market size is estimated to be USD 38.37 Million as of 2022.
5. What are some drivers contributing to market growth?
4.; Increasing Amount of Waste Generation. Growing Concern for Waste Management to Meet the Needs for Sustainable Urban Living4.; Increasing Focus on Non-fossil Fuel Sources of Energy.
6. What are the notable trends driving market growth?
Thermal-based Waste-to-Energy Segment to Dominate the Market.
7. Are there any restraints impacting market growth?
4.; Expensive Nature of Incinerators.
8. Can you provide examples of recent developments in the market?
April 2023: Egypt signed a USD 120 million contract to design, develop, own, and manage the country's first solid waste-to-electricity facility. The contract was signed by the Giza governorate and a partnership consisting of Renergy Egypt and the National Authority for Military Production. As part of Egypt Vision 2030, the Abou Rawash, Giza plant would convert 1,200 metric tons of household solid waste per day to power.
9. What pricing options are available for accessing the report?
Pricing options include single-user, multi-user, and enterprise licenses priced at USD 4750, USD 5250, and USD 8750 respectively.
10. Is the market size provided in terms of value or volume?
The market size is provided in terms of value, measured in Million and volume, measured in Gigawatt.
11. Are there any specific market keywords associated with the report?
Yes, the market keyword associated with the report is "Waste to Energy Industry," which aids in identifying and referencing the specific market segment covered.
12. How do I determine which pricing option suits my needs best?
The pricing options vary based on user requirements and access needs. Individual users may opt for single-user licenses, while businesses requiring broader access may choose multi-user or enterprise licenses for cost-effective access to the report.
13. Are there any additional resources or data provided in the Waste to Energy Industry report?
While the report offers comprehensive insights, it's advisable to review the specific contents or supplementary materials provided to ascertain if additional resources or data are available.
14. How can I stay updated on further developments or reports in the Waste to Energy Industry?
To stay informed about further developments, trends, and reports in the Waste to Energy Industry, consider subscribing to industry newsletters, following relevant companies and organizations, or regularly checking reputable industry news sources and publications.
Methodology
Step 1 - Identification of Relevant Samples Size from Population Database


Step 2 - Approaches for Defining Global Market Size (Value, Volume* & Price*)

Note*: In applicable scenarios
Step 3 - Data Sources
Primary Research
- Web Analytics
- Survey Reports
- Research Institute
- Latest Research Reports
- Opinion Leaders
Secondary Research
- Annual Reports
- White Paper
- Latest Press Release
- Industry Association
- Paid Database
- Investor Presentations

Step 4 - Data Triangulation
Involves using different sources of information in order to increase the validity of a study
These sources are likely to be stakeholders in a program - participants, other researchers, program staff, other community members, and so on.
Then we put all data in single framework & apply various statistical tools to find out the dynamic on the market.
During the analysis stage, feedback from the stakeholder groups would be compared to determine areas of agreement as well as areas of divergence