

Key Insights
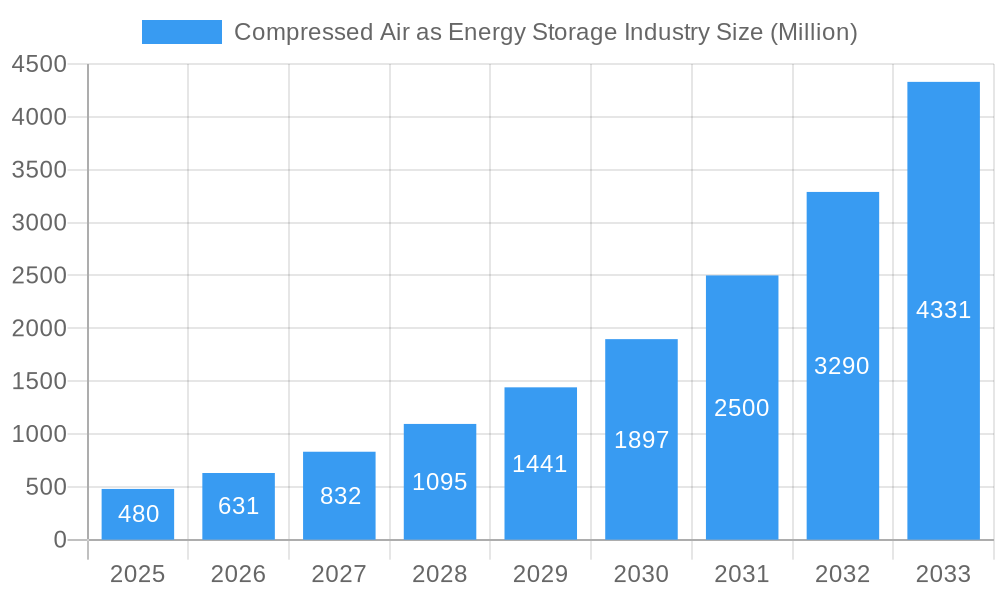
The Compressed Air Energy Storage (CAES) industry is poised for remarkable expansion, driven by the escalating demand for grid-scale energy storage solutions to support renewable energy integration and grid stability. With a projected market size of $0.48 billion in 2025, the industry is set to witness an explosive CAGR of 31.4% over the forecast period of 2025-2033. This robust growth is underpinned by several critical drivers. The increasing volatility and intermittency of renewable energy sources such as solar and wind necessitate reliable storage mechanisms to ensure a consistent power supply. CAES systems offer a cost-effective and scalable solution for storing large amounts of energy, making them increasingly attractive to utilities and grid operators. Furthermore, advancements in CAES technology, particularly in the efficiency and cost-effectiveness of adiabatic and diabatic systems, are paving the way for wider adoption. Government initiatives and supportive policies aimed at promoting energy storage deployment to achieve decarbonization goals are also significant catalysts for market expansion. The industry is witnessing significant investment and innovation from key players like Siemens AG, Apex Compressed Air Energy Storage LLC, and Hydrostor Inc., all of whom are actively developing and deploying advanced CAES technologies.
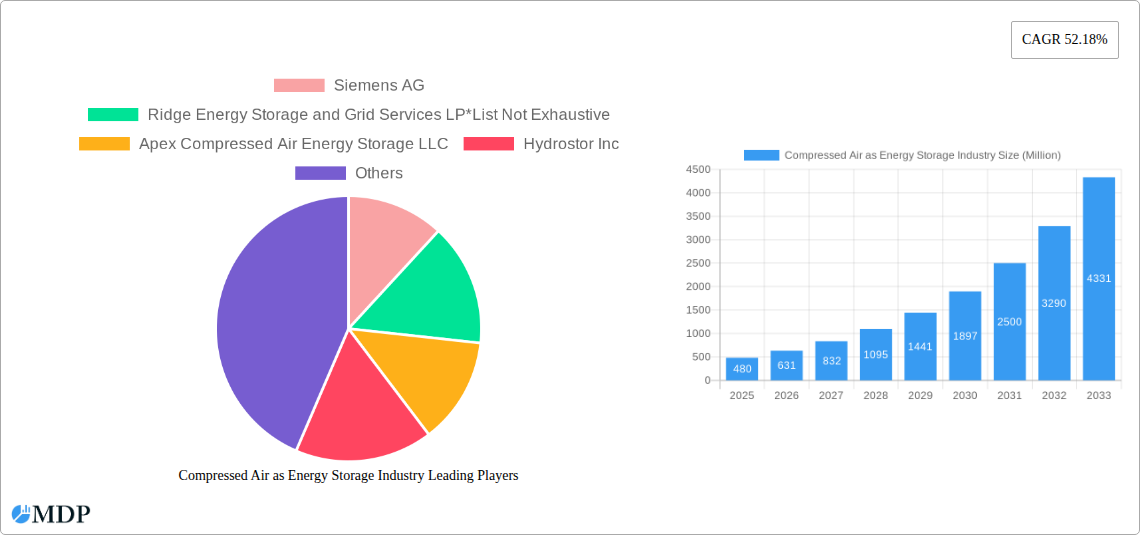
Compressed Air as Energy Storage Industry Market Size (In Million)
The compressed air energy storage market is characterized by its diverse segments, with adiabatic, diabatic, and isothermal technologies each offering unique advantages for different applications. Adiabatic CAES, which stores both energy and heat, is gaining traction for its improved efficiency and reduced reliance on external heat sources, making it a strong contender for future deployments. Diabatic systems, while historically more common, are being refined to enhance their performance. The market also presents significant opportunities across various regions, with North America and Europe expected to lead in adoption due to their proactive energy storage policies and substantial investments in grid modernization. Asia Pacific is also emerging as a key growth region, driven by rapid industrialization and a growing need for reliable and sustainable energy infrastructure. Despite the promising outlook, the market faces some restraints, including high initial capital costs for large-scale deployments and the need for suitable geological formations (like caverns) for certain CAES configurations. However, ongoing technological innovations and the decreasing cost of components are expected to mitigate these challenges, positioning CAES as a vital component of the future global energy landscape.
Compressed Air as Energy Storage Industry Company Market Share
Compressed Air as Energy Storage (CAES) Industry Market Report: Future Trends, Growth Opportunities, and Competitive Landscape (2019–2033)
This comprehensive report provides an in-depth analysis of the global Compressed Air as Energy Storage (CAES) market, a critical component of the burgeoning renewable energy and grid modernization ecosystem. With an estimated market size of over one billion dollars and projected to grow significantly, this study delves into the market dynamics, key trends, leading segments, and future outlook. The report covers the Study Period from 2019 to 2033, with a Base Year and Estimated Year of 2025, and a Forecast Period spanning 2025 to 2033, building upon the Historical Period of 2019–2024. We explore the transformative role of CAES in energy arbitrage, grid stability, and the integration of intermittent renewable sources. This report is indispensable for investors, policymakers, technology providers, and energy stakeholders seeking to understand and capitalize on the expanding CAES market.
Compressed Air as Energy Storage Industry Market Dynamics & Concentration
The Compressed Air as Energy Storage (CAES) market exhibits a dynamic interplay of forces shaping its trajectory. Market concentration is currently moderate, with key players actively investing in technological advancements and project deployments. Innovation drivers are primarily fueled by the increasing demand for grid-scale energy storage solutions to support renewable energy integration, enhance grid reliability, and manage peak demand. Regulatory frameworks, including government incentives for energy storage and renewable energy mandates, play a pivotal role in accelerating adoption. Product substitutes, such as battery energy storage systems (BESS) and pumped hydro storage, present a competitive landscape, though CAES offers distinct advantages in certain applications, particularly for longer-duration storage. End-user trends are characterized by a growing preference for sustainable and resilient energy infrastructure, driving utilities and industrial clients towards advanced storage technologies. Mergers and acquisitions (M&A) activities are expected to increase as larger energy companies seek to acquire expertise and expand their energy storage portfolios, with an estimated hundreds of M&A deals anticipated over the forecast period. The market share of CAES is projected to rise steadily, driven by its cost-effectiveness and scalability for large-capacity applications.
Compressed Air as Energy Storage Industry Industry Trends & Analysis
The Compressed Air as Energy Storage (CAES) industry is experiencing robust growth, propelled by several interconnected trends. The escalating need for grid-scale energy storage to mitigate the intermittency of renewable energy sources like solar and wind power is a primary market growth driver. As the global transition to cleaner energy accelerates, the demand for solutions that can store excess renewable generation and dispatch it during periods of low production or high demand is paramount. Technological disruptions are continuously improving the efficiency and cost-effectiveness of CAES systems. Innovations in compressor and turbine technology, as well as advancements in cavern integrity and heat management for adiabatic and diabatic systems, are enhancing performance and reducing operational expenses. Consumer preferences are shifting towards greater energy independence and resilience, with businesses and utilities actively seeking reliable energy storage options to avoid costly grid outages and optimize energy costs. Competitive dynamics are intensifying, with established players and emerging startups vying for market share. Companies are focusing on developing modular and scalable CAES solutions to cater to diverse project requirements. Market penetration of CAES is gradually increasing, particularly in regions with high renewable energy penetration and supportive grid policies. The compound annual growth rate (CAGR) for the CAES market is estimated to be over 15% during the forecast period, signifying substantial expansion. The integration of CAES with existing infrastructure and its potential for long-duration storage, often exceeding 10 hours, further solidifies its position as a vital energy storage technology. The increasing investment in grid modernization and smart grid initiatives globally further bolsters the adoption of CAES solutions, aiming to create a more stable and efficient energy network capable of handling the complexities of distributed energy resources.
Leading Markets & Segments in Compressed Air as Energy Storage Industry
North America currently dominates the Compressed Air as Energy Storage (CAES) market, driven by strong government support for renewable energy, significant investments in grid modernization, and a mature energy infrastructure. The United States, in particular, benefits from policies such as the Investment Tax Credit (ITC) and Production Tax Credit (PTC), which incentivize the development of energy storage projects. Economic policies favoring grid stability and the integration of intermittent renewables are crucial drivers in this region. The Diabatic segment, which utilizes external heat sources to improve efficiency, has seen significant traction due to its established technological maturity and lower initial capital costs compared to some advanced CAES designs. However, the Adiabatic segment, which recycles waste heat, is gaining momentum due to its higher energy efficiency and reduced environmental footprint, aligning with increasing sustainability mandates. Isothermal CAES, though less commercially prevalent, holds promise for future advancements in efficiency and scalability. Key drivers for dominance in these regions and segments include:
- Supportive Regulatory Frameworks: Government incentives, renewable portfolio standards, and grid integration mandates that favor energy storage deployment.
- Infrastructure Development: Availability of suitable geological formations for underground energy storage (e.g., depleted gas fields, salt caverns) and established grid networks capable of accommodating large-scale storage.
- Energy Market Structures: Wholesale electricity markets that provide revenue streams for energy storage services, such as capacity, energy arbitrage, and ancillary services.
- Technological Advancements: Ongoing innovation in CAES technologies leading to improved efficiency, reduced costs, and enhanced performance.
- Renewable Energy Growth: Rapid expansion of solar and wind power generation necessitates complementary energy storage solutions for grid stability and reliability.
The dominance analysis reveals a clear trend towards utility-scale projects, where the inherent advantages of CAES in terms of long-duration storage and cost-effectiveness for megawatt-hour capacities are most pronounced. The transition from traditional diabatic systems to more advanced adiabatic and potentially isothermal designs reflects the industry's pursuit of greater efficiency and reduced environmental impact.
Compressed Air as Energy Storage Industry Product Developments
Product developments in the Compressed Air as Energy Storage (CAES) industry are centered on enhancing efficiency, scalability, and cost-effectiveness. Innovations are focusing on advanced compression and expansion technologies, improved thermal management systems for adiabatic and diabatic designs, and optimized cavern storage solutions. Companies are developing modular CAES systems that can be deployed more rapidly and adapted to a wider range of site-specific requirements. The integration of CAES with renewable energy sources is a key focus, enabling seamless energy arbitrage and grid stabilization. Competitive advantages are being gained through reduced operational costs, increased round-trip efficiency (ranging from 60% to 80%), and longer discharge durations, often exceeding 10 hours. The market fit for these developments lies in addressing the growing need for reliable, long-duration energy storage to support grid stability and the integration of intermittent renewables.
Key Drivers of Compressed Air as Energy Storage Industry Growth
The growth of the Compressed Air as Energy Storage (CAES) industry is propelled by a confluence of powerful drivers. Foremost among these is the accelerating global transition to renewable energy, which necessitates robust storage solutions to manage the intermittency of solar and wind power. Supportive regulatory frameworks and government incentives, including tax credits and mandates for energy storage, significantly de-risk investments and encourage project development. Technological advancements in compressor, turbine, and thermal management systems are continually improving CAES efficiency and reducing costs. Furthermore, the increasing demand for grid stability and reliability, driven by aging infrastructure and the growing need to prevent costly blackouts, positions CAES as a critical enabler of a resilient energy future. The economic viability of energy arbitrage in evolving electricity markets, where CAES can purchase power during off-peak hours and sell it during peak demand, also fuels its adoption.
Challenges in the Compressed Air as Energy Storage Industry Market
Despite its promising outlook, the Compressed Air as Energy Storage (CAES) industry faces several significant challenges. High upfront capital costs for large-scale installations, particularly those requiring extensive geological site preparation, remain a barrier to entry. Regulatory hurdles and permitting complexities can prolong project development timelines, increasing overall project risk. Availability of suitable geological formations for underground storage (e.g., salt caverns, depleted gas fields) is geographically constrained, limiting deployment options in certain regions. Competition from other energy storage technologies, such as lithium-ion batteries, which benefit from established supply chains and falling costs, presents an ongoing challenge. Furthermore, technical challenges related to thermal efficiency and energy losses in certain CAES designs require continuous innovation. The economic impact of these challenges can translate to project delays of over 24 months and cost overruns of up to 15%.
Emerging Opportunities in Compressed Air as Energy Storage Industry
Emerging opportunities in the Compressed Air as Energy Storage (CAES) industry are poised to drive significant long-term growth. Technological breakthroughs in advanced CAES designs, such as isothermal and novel adiabatic systems, promise higher efficiencies and reduced environmental impact. Strategic partnerships between CAES developers, renewable energy project owners, and utilities are creating integrated solutions that optimize grid performance and renewable energy integration. Market expansion into new geographical regions with burgeoning renewable energy sectors and supportive policies presents substantial untapped potential. The increasing demand for long-duration energy storage (LDES) solutions, which CAES is uniquely positioned to provide, opens up significant new revenue streams for grid services and energy arbitrage. Furthermore, the development of hybrid energy storage systems that combine CAES with other technologies can offer tailored solutions for specific grid needs.
Leading Players in the Compressed Air as Energy Storage Industry Sector
- Siemens AG
- Ridge Energy Storage and Grid Services LP
- Apex Compressed Air Energy Storage LLC
- Hydrostor Inc
Key Milestones in Compressed Air as Energy Storage Industry Industry
- 2019: Significant advancements in adiabatic CAES technology lead to improved round-trip efficiency exceeding 70%.
- 2020: Several utility-scale CAES projects receive funding and regulatory approvals in North America.
- 2021: Increased investor interest and venture capital funding pour into CAES startups focused on innovative designs.
- 2022: Successful demonstration of longer-duration CAES capabilities, exceeding 10 hours of discharge.
- 2023: Strategic collaborations emerge between CAES developers and renewable energy developers to integrate storage solutions.
- 2024: Emerging trends point towards the development of more modular and scalable CAES systems for diverse applications.
Strategic Outlook for Compressed Air as Energy Storage Industry Market
The strategic outlook for the Compressed Air as Energy Storage (CAES) market is exceptionally positive, driven by the global imperative for grid modernization and renewable energy integration. Growth accelerators include continued advancements in CAES technology, leading to enhanced efficiency and reduced costs, making it increasingly competitive with other storage solutions. Supportive government policies and incentives will remain critical drivers, encouraging investment and deployment of CAES projects. The growing demand for long-duration energy storage solutions to complement intermittent renewable generation presents a significant opportunity for CAES to play a pivotal role in ensuring grid stability and reliability. Strategic partnerships and collaborations will be key to unlocking new markets and developing integrated energy storage solutions. The market's future potential lies in its ability to provide scalable, cost-effective, and environmentally sound energy storage at the grid level, contributing significantly to a sustainable and resilient energy future.
Compressed Air as Energy Storage Industry Segmentation
-
1. Type
- 1.1. Adiabatic
- 1.2. Diabatic
- 1.3. Isothermal
Compressed Air as Energy Storage Industry Segmentation By Geography
- 1. North America
- 2. Europe
- 3. Asia Pacific
- 4. Rest of the World
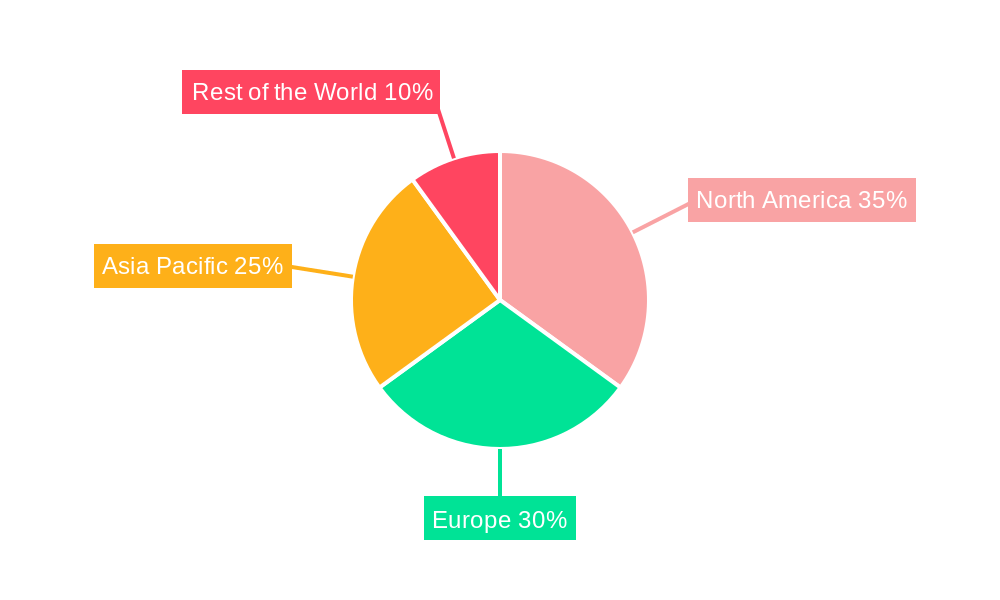
Compressed Air as Energy Storage Industry Regional Market Share
Geographic Coverage of Compressed Air as Energy Storage Industry
Compressed Air as Energy Storage Industry REPORT HIGHLIGHTS
| Aspects | Details |
|---|---|
| Study Period | 2020-2034 |
| Base Year | 2025 |
| Estimated Year | 2026 |
| Forecast Period | 2026-2034 |
| Historical Period | 2020-2025 |
| Growth Rate | CAGR of 31.4% from 2020-2034 |
| Segmentation |
|
Table of Contents
- 1. Introduction
- 1.1. Research Scope
- 1.2. Market Segmentation
- 1.3. Research Objective
- 1.4. Definitions and Assumptions
- 2. Executive Summary
- 2.1. Market Snapshot
- 3. Market Dynamics
- 3.1. Market Drivers
- 3.2. Market Restrains
- 3.3. Market Trends
- 3.4. Market Opportunities
- 4. Market Factor Analysis
- 4.1. Porters Five Forces
- 4.1.1. Bargaining Power of Suppliers
- 4.1.2. Bargaining Power of Buyers
- 4.1.3. Threat of New Entrants
- 4.1.4. Threat of Substitutes
- 4.1.5. Competitive Rivalry
- 4.2. PESTEL analysis
- 4.3. BCG Analysis
- 4.3.1. Stars (High Growth, High Market Share)
- 4.3.2. Cash Cows (Low Growth, High Market Share)
- 4.3.3. Question Mark (High Growth, Low Market Share)
- 4.3.4. Dogs (Low Growth, Low Market Share)
- 4.4. Ansoff Matrix Analysis
- 4.5. Supply Chain Analysis
- 4.6. Regulatory Landscape
- 4.7. Current Market Potential and Opportunity Assessment (TAM–SAM–SOM Framework)
- 4.8. MDP Analyst Note
- 4.1. Porters Five Forces
- 5. Market Analysis, Insights and Forecast 2021-2033
- 5.1. Market Analysis, Insights and Forecast - by Type
- 5.1.1. Adiabatic
- 5.1.2. Diabatic
- 5.1.3. Isothermal
- 5.2. Market Analysis, Insights and Forecast - by Region
- 5.2.1. North America
- 5.2.2. Europe
- 5.2.3. Asia Pacific
- 5.2.4. Rest of the World
- 5.1. Market Analysis, Insights and Forecast - by Type
- 6. Global Compressed Air as Energy Storage Industry Analysis, Insights and Forecast, 2021-2033
- 6.1. Market Analysis, Insights and Forecast - by Type
- 6.1.1. Adiabatic
- 6.1.2. Diabatic
- 6.1.3. Isothermal
- 6.1. Market Analysis, Insights and Forecast - by Type
- 7. North America Compressed Air as Energy Storage Industry Analysis, Insights and Forecast, 2020-2032
- 7.1. Market Analysis, Insights and Forecast - by Type
- 7.1.1. Adiabatic
- 7.1.2. Diabatic
- 7.1.3. Isothermal
- 7.1. Market Analysis, Insights and Forecast - by Type
- 8. Europe Compressed Air as Energy Storage Industry Analysis, Insights and Forecast, 2020-2032
- 8.1. Market Analysis, Insights and Forecast - by Type
- 8.1.1. Adiabatic
- 8.1.2. Diabatic
- 8.1.3. Isothermal
- 8.1. Market Analysis, Insights and Forecast - by Type
- 9. Asia Pacific Compressed Air as Energy Storage Industry Analysis, Insights and Forecast, 2020-2032
- 9.1. Market Analysis, Insights and Forecast - by Type
- 9.1.1. Adiabatic
- 9.1.2. Diabatic
- 9.1.3. Isothermal
- 9.1. Market Analysis, Insights and Forecast - by Type
- 10. Rest of the World Compressed Air as Energy Storage Industry Analysis, Insights and Forecast, 2020-2032
- 10.1. Market Analysis, Insights and Forecast - by Type
- 10.1.1. Adiabatic
- 10.1.2. Diabatic
- 10.1.3. Isothermal
- 10.1. Market Analysis, Insights and Forecast - by Type
- 11. Competitive Analysis
- 11.1. Company Profiles
- 11.1.1 Siemens AG
- 11.1.1.1. Company Overview
- 11.1.1.2. Products
- 11.1.1.3. Company Financials
- 11.1.1.4. SWOT Analysis
- 11.1.2 Ridge Energy Storage and Grid Services LP*List Not Exhaustive
- 11.1.2.1. Company Overview
- 11.1.2.2. Products
- 11.1.2.3. Company Financials
- 11.1.2.4. SWOT Analysis
- 11.1.3 Apex Compressed Air Energy Storage LLC
- 11.1.3.1. Company Overview
- 11.1.3.2. Products
- 11.1.3.3. Company Financials
- 11.1.3.4. SWOT Analysis
- 11.1.4 Hydrostor Inc
- 11.1.4.1. Company Overview
- 11.1.4.2. Products
- 11.1.4.3. Company Financials
- 11.1.4.4. SWOT Analysis
- 11.1.1 Siemens AG
- 11.2. Market Entropy
- 11.2.1 Company's Key Areas Served
- 11.2.2 Recent Developments
- 11.3. Company Market Share Analysis 2025
- 11.3.1 Top 5 Companies Market Share Analysis
- 11.3.2 Top 3 Companies Market Share Analysis
- 11.4. List of Potential Customers
- 12. Research Methodology
List of Figures
- Figure 1: Global Compressed Air as Energy Storage Industry Revenue Breakdown (billion, %) by Region 2025 & 2033
- Figure 2: North America Compressed Air as Energy Storage Industry Revenue (billion), by Type 2025 & 2033
- Figure 3: North America Compressed Air as Energy Storage Industry Revenue Share (%), by Type 2025 & 2033
- Figure 4: North America Compressed Air as Energy Storage Industry Revenue (billion), by Country 2025 & 2033
- Figure 5: North America Compressed Air as Energy Storage Industry Revenue Share (%), by Country 2025 & 2033
- Figure 6: Europe Compressed Air as Energy Storage Industry Revenue (billion), by Type 2025 & 2033
- Figure 7: Europe Compressed Air as Energy Storage Industry Revenue Share (%), by Type 2025 & 2033
- Figure 8: Europe Compressed Air as Energy Storage Industry Revenue (billion), by Country 2025 & 2033
- Figure 9: Europe Compressed Air as Energy Storage Industry Revenue Share (%), by Country 2025 & 2033
- Figure 10: Asia Pacific Compressed Air as Energy Storage Industry Revenue (billion), by Type 2025 & 2033
- Figure 11: Asia Pacific Compressed Air as Energy Storage Industry Revenue Share (%), by Type 2025 & 2033
- Figure 12: Asia Pacific Compressed Air as Energy Storage Industry Revenue (billion), by Country 2025 & 2033
- Figure 13: Asia Pacific Compressed Air as Energy Storage Industry Revenue Share (%), by Country 2025 & 2033
- Figure 14: Rest of the World Compressed Air as Energy Storage Industry Revenue (billion), by Type 2025 & 2033
- Figure 15: Rest of the World Compressed Air as Energy Storage Industry Revenue Share (%), by Type 2025 & 2033
- Figure 16: Rest of the World Compressed Air as Energy Storage Industry Revenue (billion), by Country 2025 & 2033
- Figure 17: Rest of the World Compressed Air as Energy Storage Industry Revenue Share (%), by Country 2025 & 2033
List of Tables
- Table 1: Global Compressed Air as Energy Storage Industry Revenue billion Forecast, by Type 2020 & 2033
- Table 2: Global Compressed Air as Energy Storage Industry Revenue billion Forecast, by Region 2020 & 2033
- Table 3: Global Compressed Air as Energy Storage Industry Revenue billion Forecast, by Type 2020 & 2033
- Table 4: Global Compressed Air as Energy Storage Industry Revenue billion Forecast, by Country 2020 & 2033
- Table 5: Global Compressed Air as Energy Storage Industry Revenue billion Forecast, by Type 2020 & 2033
- Table 6: Global Compressed Air as Energy Storage Industry Revenue billion Forecast, by Country 2020 & 2033
- Table 7: Global Compressed Air as Energy Storage Industry Revenue billion Forecast, by Type 2020 & 2033
- Table 8: Global Compressed Air as Energy Storage Industry Revenue billion Forecast, by Country 2020 & 2033
- Table 9: Global Compressed Air as Energy Storage Industry Revenue billion Forecast, by Type 2020 & 2033
- Table 10: Global Compressed Air as Energy Storage Industry Revenue billion Forecast, by Country 2020 & 2033
Frequently Asked Questions
1. What is the projected Compound Annual Growth Rate (CAGR) of the Compressed Air as Energy Storage Industry?
The projected CAGR is approximately 31.4%.
2. Which companies are prominent players in the Compressed Air as Energy Storage Industry?
Key companies in the market include Siemens AG, Ridge Energy Storage and Grid Services LP*List Not Exhaustive, Apex Compressed Air Energy Storage LLC, Hydrostor Inc.
3. What are the main segments of the Compressed Air as Energy Storage Industry?
The market segments include Type.
4. Can you provide details about the market size?
The market size is estimated to be USD 0.48 billion as of 2022.
5. What are some drivers contributing to market growth?
4.; Growing Oil and Gas Industry4.; Rapid Growth in the Industrial Sector.
6. What are the notable trends driving market growth?
Diabatic CAES Technology to Dominate the Market.
7. Are there any restraints impacting market growth?
4.; Fluctuation in Oil and Gas Prices.
8. Can you provide examples of recent developments in the market?
N/A
9. What pricing options are available for accessing the report?
Pricing options include single-user, multi-user, and enterprise licenses priced at USD 4750, USD 5250, and USD 8750 respectively.
10. Is the market size provided in terms of value or volume?
The market size is provided in terms of value, measured in billion.
11. Are there any specific market keywords associated with the report?
Yes, the market keyword associated with the report is "Compressed Air as Energy Storage Industry," which aids in identifying and referencing the specific market segment covered.
12. How do I determine which pricing option suits my needs best?
The pricing options vary based on user requirements and access needs. Individual users may opt for single-user licenses, while businesses requiring broader access may choose multi-user or enterprise licenses for cost-effective access to the report.
13. Are there any additional resources or data provided in the Compressed Air as Energy Storage Industry report?
While the report offers comprehensive insights, it's advisable to review the specific contents or supplementary materials provided to ascertain if additional resources or data are available.
14. How can I stay updated on further developments or reports in the Compressed Air as Energy Storage Industry?
To stay informed about further developments, trends, and reports in the Compressed Air as Energy Storage Industry, consider subscribing to industry newsletters, following relevant companies and organizations, or regularly checking reputable industry news sources and publications.
Methodology
Step 1 - Identification of Relevant Samples Size from Population Database


Step 2 - Approaches for Defining Global Market Size (Value, Volume* & Price*)

Note*: In applicable scenarios
Step 3 - Data Sources
Primary Research
- Web Analytics
- Survey Reports
- Research Institute
- Latest Research Reports
- Opinion Leaders
Secondary Research
- Annual Reports
- White Paper
- Latest Press Release
- Industry Association
- Paid Database
- Investor Presentations

Step 4 - Data Triangulation
Involves using different sources of information in order to increase the validity of a study
These sources are likely to be stakeholders in a program - participants, other researchers, program staff, other community members, and so on.
Then we put all data in single framework & apply various statistical tools to find out the dynamic on the market.
During the analysis stage, feedback from the stakeholder groups would be compared to determine areas of agreement as well as areas of divergence