

Key Insights
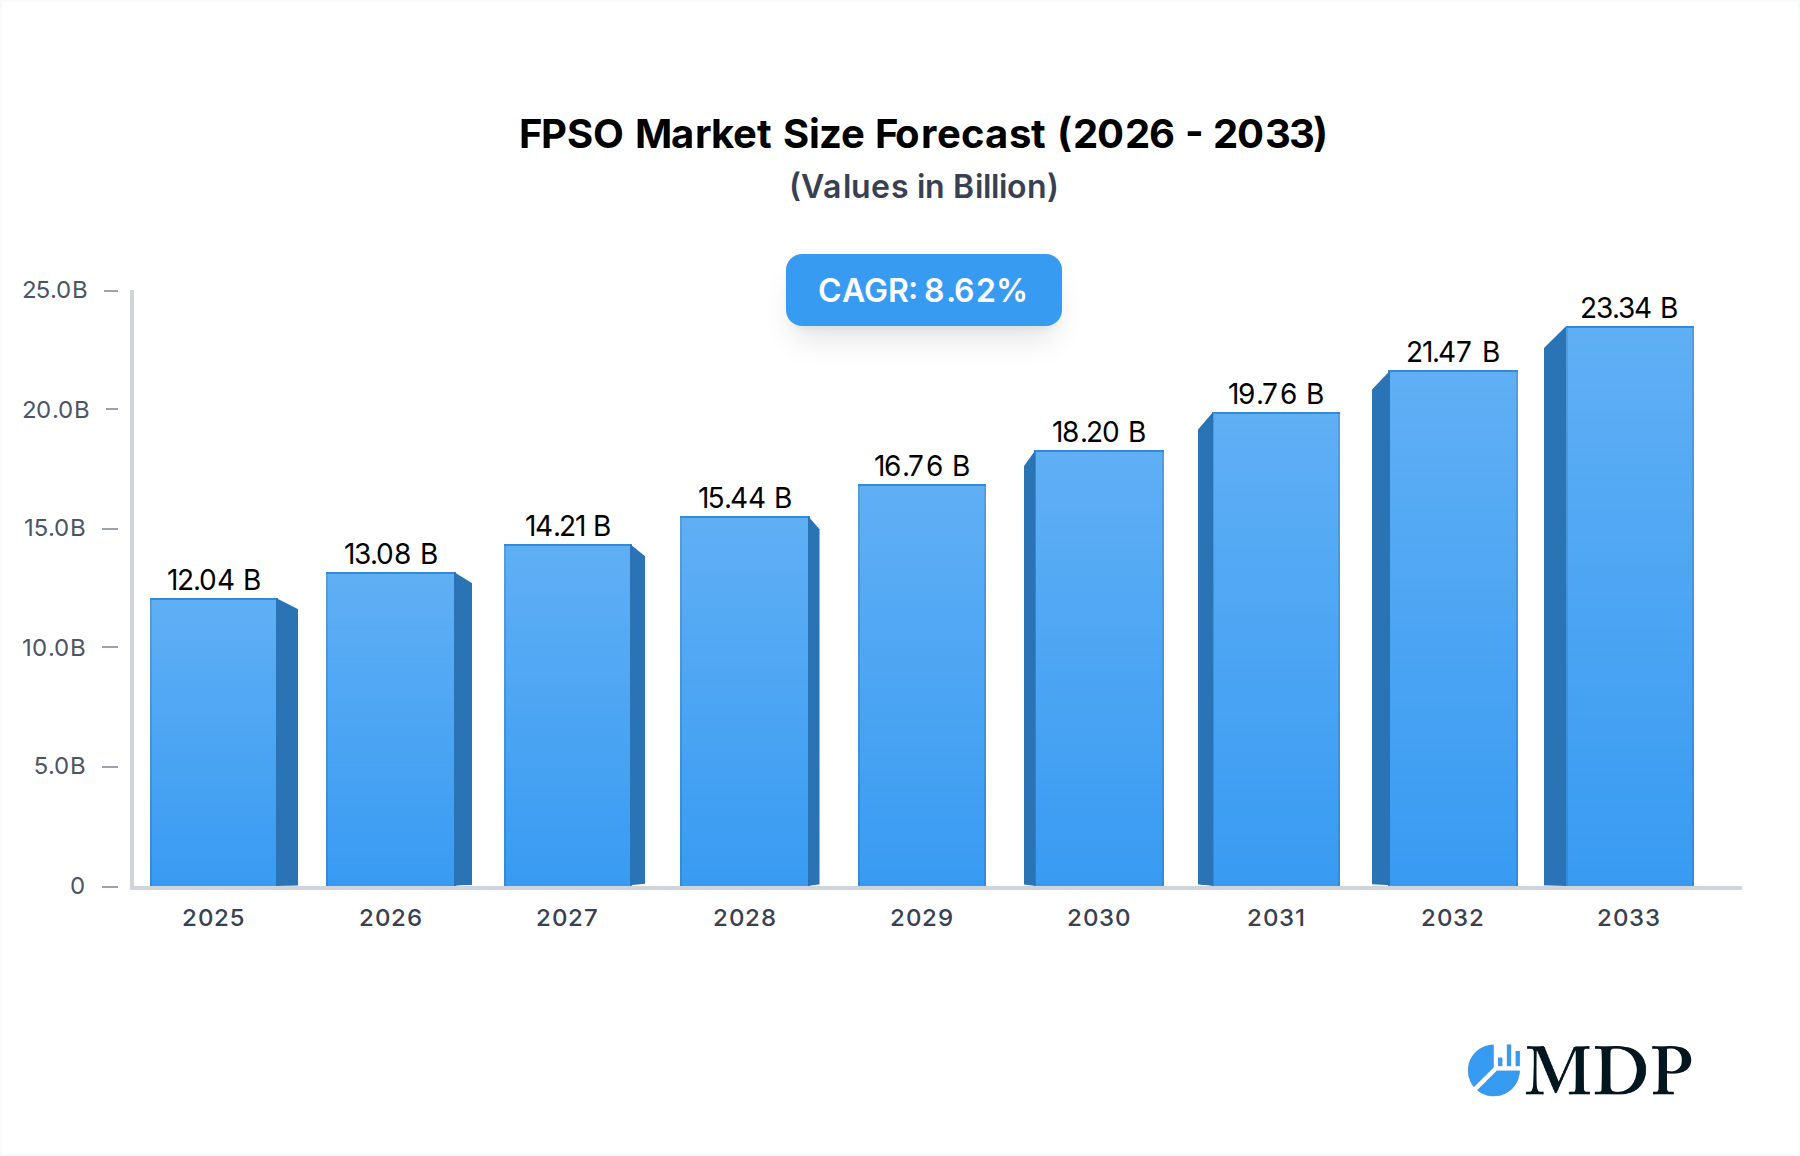
The Floating Production Storage and Offloading (FPSO) market is poised for substantial growth, projected to reach approximately 12.04 Billion USD by 2025, with an impressive Compound Annual Growth Rate (CAGR) of 8.50% through 2033. This robust expansion is primarily fueled by the increasing demand for offshore oil and gas exploration, particularly in deeper and more challenging water depths where FPSOs offer a cost-effective and flexible solution. Key drivers include the development of complex deepwater and ultra-deepwater fields, the need for efficient hydrocarbon production and storage capabilities, and the continuous technological advancements in FPSO design and operation, leading to enhanced efficiency and reduced environmental impact. The market is also benefiting from the strategic investments by major oil and gas companies in expanding their offshore production capacities to meet global energy demands. The growing emphasis on reducing project timelines and operational costs further elevates the appeal of FPSO solutions over traditional fixed platforms for many offshore projects.

FPSO Market Market Size (In Billion)
The FPSO market is segmented by ownership, with both operator-owned and contractor-owned models playing significant roles, reflecting different strategic approaches to offshore asset management. The water depth segmentation highlights a strong trend towards deep water and ultra-deepwater deployments, underscoring the industry's push into more frontier exploration areas. Prominent players like Shell PLC, Saipem SpA, BP PLC, and SBM Offshore NV are at the forefront, driving innovation and securing major contracts. Geographically, North America, Europe (particularly Norway and the UK), and Asia Pacific (driven by China and Australia) are anticipated to be leading regions in FPSO deployment due to their extensive offshore reserves and active exploration activities. However, potential restraints such as volatile crude oil prices, stringent environmental regulations, and the high capital expenditure associated with large FPSO projects could influence the pace of market growth. Nevertheless, the inherent advantages of FPSOs in remote and harsh environments are expected to sustain a positive growth trajectory.
FPSO Market Company Market Share
Unlocking Global Offshore Potential: The Definitive FPSO Market Report 2024-2033
Gain unparalleled insights into the dynamic Floating Production, Storage, and Offloading (FPSO) market with this comprehensive industry analysis. Covering the historical period from 2019-2024 and projecting growth through 2033, this report is an essential resource for understanding the strategies, innovations, and key players shaping the future of offshore oil and gas production. Discover critical market trends, leading segment dominance, product developments, growth drivers, challenges, and emerging opportunities. This in-depth report, with a base and estimated year of 2025, provides actionable intelligence for stakeholders seeking to navigate and capitalize on this multi-billion dollar sector.
FPSO Market Market Dynamics & Concentration
The FPSO market is characterized by a moderately concentrated structure, with a few dominant players holding significant market share, particularly in the contractor-owned segment. Innovation drivers are primarily fueled by the increasing demand for efficient extraction from deep water and ultra-deep water fields, pushing technological advancements in hull design, turret systems, and processing capabilities. Regulatory frameworks, driven by stringent environmental standards and safety protocols, are evolving, influencing project development and operational requirements. Product substitutes are limited in the context of large-scale offshore production, with FPSOs offering a unique combination of mobility, storage, and processing capabilities. End-user trends are shifting towards more sustainable and cost-effective offshore solutions, with a growing emphasis on gas production and the potential for FPSOs in renewable energy applications. Mergers and acquisitions (M&A) activities are observed as companies seek to consolidate their market position, enhance their technological portfolios, and expand their geographical reach. The report details specific M&A deal counts and provides market share insights for key players.
FPSO Market Industry Trends & Analysis
The FPSO market is poised for significant expansion, driven by several key factors. The ongoing global demand for oil and gas, coupled with the depletion of conventional onshore reserves, is compelling energy companies to explore increasingly challenging offshore environments, particularly deep water and ultra-deep water prospects. This necessity directly fuels the demand for sophisticated FPSO units capable of operating reliably in harsh conditions and at extreme depths. Technological disruptions are a constant theme, with continuous advancements in modular design, subsea tie-backs, and digital integration enhancing operational efficiency, reducing deployment times, and improving safety. Innovations in areas like enhanced oil recovery (EOR) techniques deployed on FPSOs are also contributing to increased field productivity. Consumer preferences, or rather, end-user demands from oil and gas operators, are leaning towards flexible, cost-effective, and environmentally responsible solutions. This includes a greater focus on life-of-field support, minimizing operational footprints, and exploring opportunities for carbon capture utilization and storage (CCUS) integration with FPSOs. Competitive dynamics are intense, with a strong emphasis on technological prowess, project execution capabilities, and the ability to offer tailored solutions. The report will delve into the projected Compound Annual Growth Rate (CAGR) for the FPSO market during the forecast period and analyze market penetration across various segments.
Leading Markets & Segments in FPSO Market
The deep water and ultra-deep water segments are the dominant forces within the FPSO market, propelled by significant untapped hydrocarbon reserves in these challenging offshore regions. Economically, the higher recovery rates and the necessity of advanced technology for extraction in these depths make FPSOs the preferred solution. Infrastructure development, including the deployment of sophisticated subsea pipelines and support vessels, further solidifies the dominance of these water depth categories.
- Water Depth Dominance:
- Deep Water: Continues to be a primary focus for exploration and production, with numerous existing and upcoming projects. Economic policies supporting offshore development and the proven technological readiness for this depth are key drivers.
- Ultra-deep Water: Represents the frontier of offshore exploration, offering vast potential reserves. Investments in cutting-edge technology and the drive for maximizing hydrocarbon recovery from increasingly complex geological formations fuel its growth.
The contractor-owned segment is also witnessing substantial growth, as major FPSO contractors possess the specialized expertise, capital, and infrastructure to design, construct, and operate these complex units, offering integrated solutions to operators. This model allows operators to focus on exploration and production without the significant upfront capital investment and operational complexities associated with owning and managing FPSOs.
- Ownership Segment Dynamics:
- Contractor-owned: Advantages include reduced operator capital expenditure, access to specialized expertise, and streamlined project execution. This segment is expected to see robust growth due to the complexity and cost of FPSO development.
- Operator-owned: While some major operators maintain their own FPSO fleets, the trend is leaning towards outsourcing to specialized contractors due to the specialized nature of FPSO technology and operations.
FPSO Market Product Developments
Product developments in the FPSO market are characterized by a relentless pursuit of enhanced efficiency, safety, and environmental performance. Innovations focus on modular design for faster deployment, advanced mooring systems for extreme weather resilience, and improved processing technologies for greater hydrocarbon recovery and cleaner effluent discharge. The integration of digital solutions, including predictive maintenance and remote monitoring, is becoming standard, offering significant operational advantages. Furthermore, research into FPSO applications for emerging energy sources, such as hydrogen production or offshore carbon capture, signifies a future-oriented approach to market fit.
Key Drivers of FPSO Market Growth
The FPSO market's growth is propelled by a confluence of technological, economic, and regulatory factors. The persistent global demand for energy necessitates offshore exploration, particularly in previously inaccessible deep water and ultra-deep water reserves. Economic incentives, such as government policies supporting offshore development and the favorable economics of producing from these complex fields, are significant drivers. Technological advancements in FPSO design, subsea infrastructure, and production optimization continue to lower the cost and improve the viability of offshore projects, making them increasingly attractive investments.
Challenges in the FPSO Market Market
Despite robust growth prospects, the FPSO market faces several challenges. Regulatory hurdles and evolving environmental compliance standards can add complexity and cost to project development. Supply chain disruptions and the scarcity of specialized components and skilled personnel can impact project timelines and budgets. Furthermore, competitive pressures among FPSO contractors and the fluctuating global oil and gas prices can influence investment decisions and project feasibility, requiring significant capital investment and long-term commitment.
Emerging Opportunities in FPSO Market
Emerging opportunities in the FPSO market are largely driven by technological breakthroughs and strategic market expansion. The increasing focus on energy transition is opening avenues for FPSOs in non-traditional roles, such as supporting offshore renewable energy installations or facilitating the development of carbon capture and storage (CCS) infrastructure. Strategic partnerships between FPSO providers, technology developers, and offshore operators are crucial for co-creating innovative solutions and unlocking new market segments. Furthermore, the expansion of offshore exploration into new geographical regions with untapped reserves presents significant growth potential.
Leading Players in the FPSO Market Sector
- Shell PLC
- Bluewater Holding BV
- Saipem SpA
- BP PLC
- Petroleo Brasileiro SA (Petrobras)
- Teekay Offshore Partners LP
- Chevron Corporation
- TotalEnergies SE
- Petrofac Limited
- ExxonMobil Corp
- Modec Inc
- BW Offshore Limited
- SBM Offshore NV
- CNOOC Ltd
Key Milestones in FPSO Market Industry
- May 2023: SBM Offshore and Esso Exploration & Production Guyana entered a 10-year Operations and Maintenance Enabling Agreement. The agreement entails SBM Offshore being responsible for the operations and maintenance of four FPSOs: Liza Destiny, Liza Unity, Prosperity, and ONE GUYANA.
- April 2023: Following a major upgrade to enable gas production, Shell resumed operations at the Pierce field in the United Kingdom Central North Sea. The Haewene Brim floating production, storage, and offloading vessel (FPSO), utilized for hydrocarbon production at the Pierce field, underwent significant modifications. A new subsea gas export line was installed, connecting to the SEGAL pipeline system, which transports gas to the St Fergus facility north of Aberdeen. This development allows for the extraction of gas from the Pierce field, which had previously been focused solely on oil production.
- April 2023: KBR, headquartered in Houston, has officially announced the acquisition of an engineering contract for Equinor's Bay du Nord project, valued at USD 9.4 billion and located in the offshore eastern region of Canada. The awarded contract encompasses the possibility of providing detailed design and procurement management services until the completion of the FPSO (Floating Production, Storage, and Offloading) unit.
Strategic Outlook for FPSO Market Market
The strategic outlook for the FPSO market is exceptionally positive, driven by the continuous demand for offshore hydrocarbons and the burgeoning opportunities within the energy transition. Continued investment in technological innovation, particularly in areas of automation, digitalization, and environmental sustainability, will be crucial for maintaining a competitive edge. Strategic collaborations and partnerships will be key to unlocking new markets and developing integrated solutions for complex offshore projects. The market is expected to witness a sustained demand for FPSOs in deep water and ultra-deep water applications, while also exploring nascent opportunities in renewable energy support and carbon management initiatives, signaling a diversified and resilient future.
FPSO Market Segmentation
-
1. Ownership
- 1.1. Operator-owned
- 1.2. Contractor-owned
-
2. Water Depth
- 2.1. Shallow Water
- 2.2. Deep Water
- 2.3. Ultra-deep Water
FPSO Market Segmentation By Geography
-
1. North America
- 1.1. United States
- 1.2. Canada
- 1.3. Mexico
- 1.4. Rest of North America
-
2. Europe
- 2.1. Norway
- 2.2. United Kingdom
- 2.3. Russia
- 2.4. Netherland
- 2.5. France
- 2.6. Italy
- 2.7. NORDIC
- 2.8. Germany
- 2.9. Spain
- 2.10. Rest of Europe
-
3. Asia Pacific
- 3.1. China
- 3.2. India
- 3.3. Australia
- 3.4. Indonesia
- 3.5. Malaysia
- 3.6. Thailand
- 3.7. Japan
- 3.8. Vietnam
- 3.9. Rest of Asia Pacific
-
4. South America
- 4.1. Brazil
- 4.2. Argentina
- 4.3. Venezuela
- 4.4. Colombia
- 4.5. Rest of South America
-
5. Middle East and Africa
- 5.1. Saudi Arabia
- 5.2. United Arab Emirates
- 5.3. Nigeria
- 5.4. Algeria
- 5.5. Qatar
- 5.6. South Africa
- 5.7. Egypt
- 5.8. Rest of Middle East and Africa
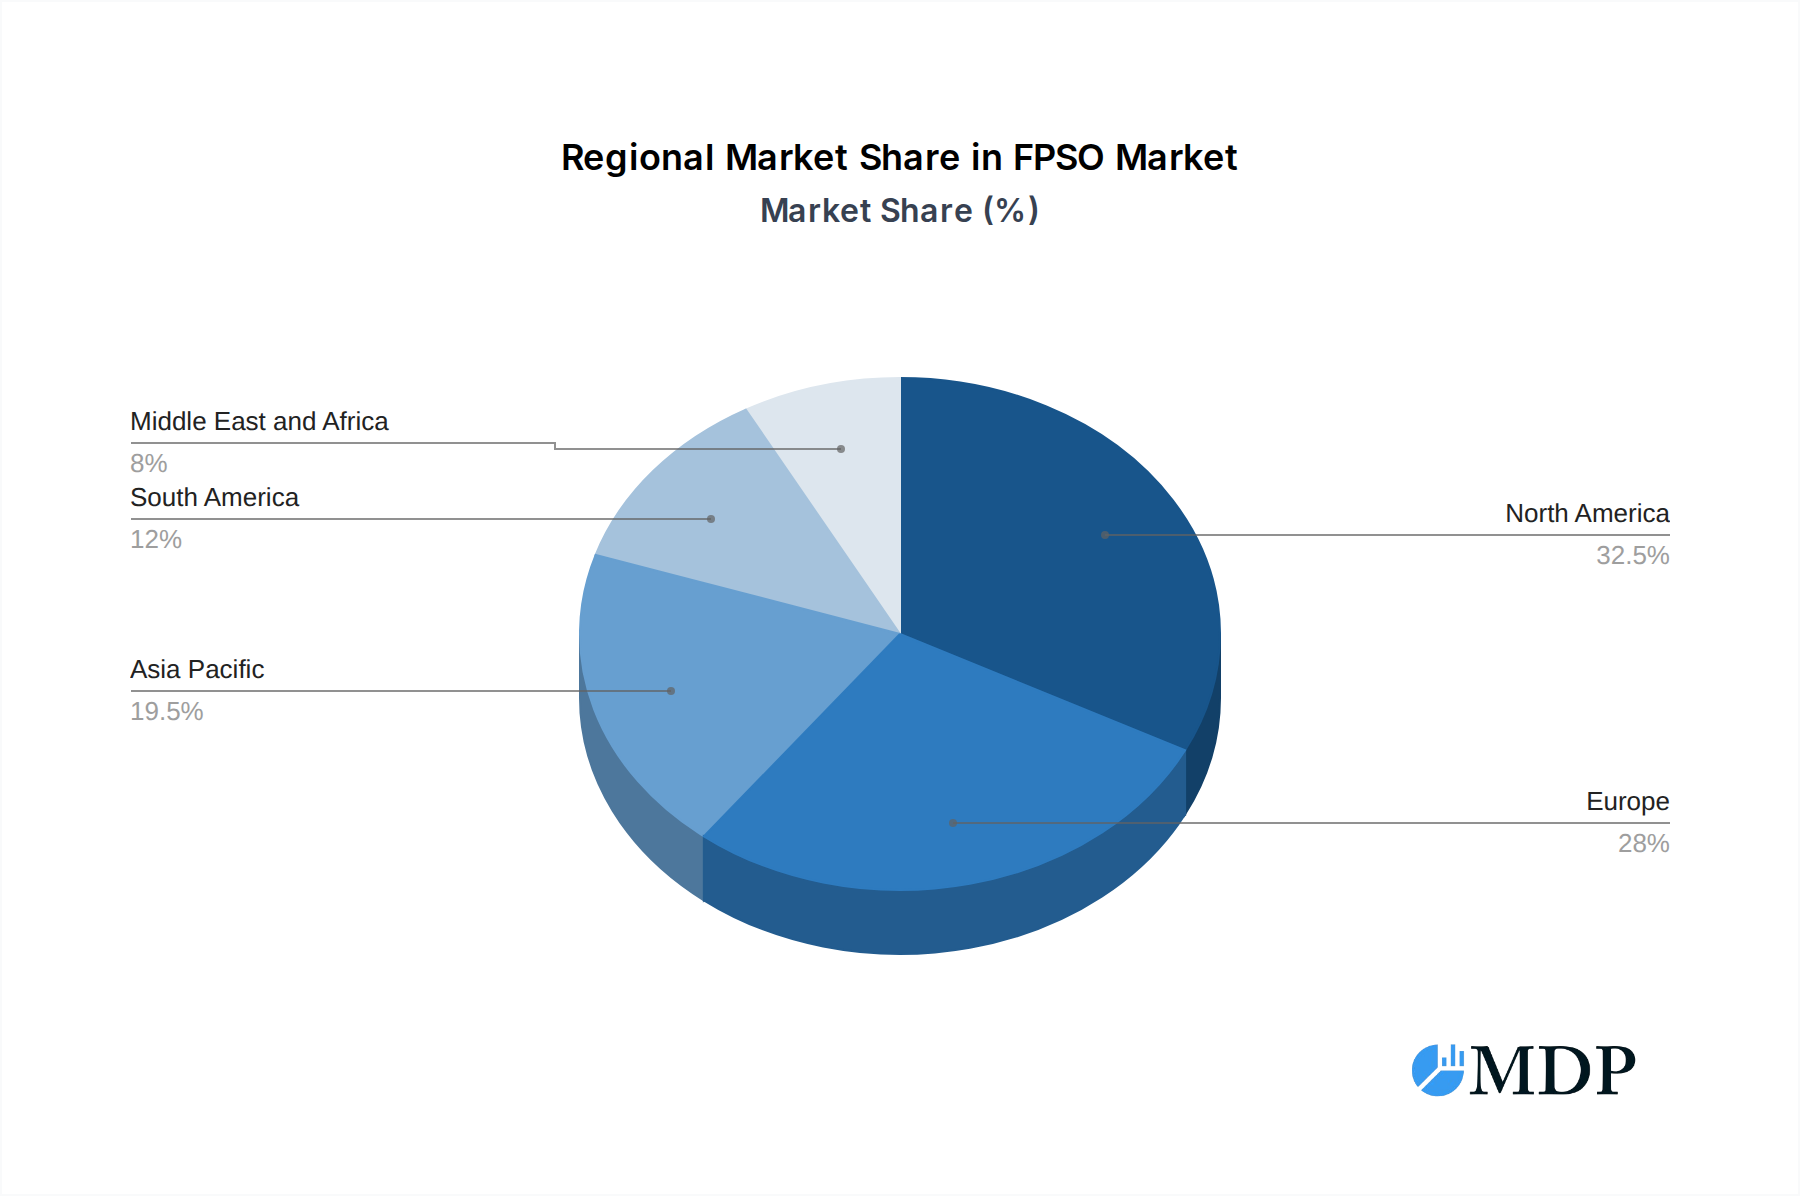
FPSO Market Regional Market Share
Geographic Coverage of FPSO Market
FPSO Market REPORT HIGHLIGHTS
| Aspects | Details |
|---|---|
| Study Period | 2020-2034 |
| Base Year | 2025 |
| Estimated Year | 2026 |
| Forecast Period | 2026-2034 |
| Historical Period | 2020-2025 |
| Growth Rate | CAGR of 8.50% from 2020-2034 |
| Segmentation |
|
Table of Contents
- 1. Introduction
- 1.1. Research Scope
- 1.2. Market Segmentation
- 1.3. Research Objective
- 1.4. Definitions and Assumptions
- 2. Executive Summary
- 2.1. Market Snapshot
- 3. Market Dynamics
- 3.1. Market Drivers
- 3.2. Market Restrains
- 3.3. Market Trends
- 3.4. Market Opportunities
- 4. Market Factor Analysis
- 4.1. Porters Five Forces
- 4.1.1. Bargaining Power of Suppliers
- 4.1.2. Bargaining Power of Buyers
- 4.1.3. Threat of New Entrants
- 4.1.4. Threat of Substitutes
- 4.1.5. Competitive Rivalry
- 4.2. PESTEL analysis
- 4.3. BCG Analysis
- 4.3.1. Stars (High Growth, High Market Share)
- 4.3.2. Cash Cows (Low Growth, High Market Share)
- 4.3.3. Question Mark (High Growth, Low Market Share)
- 4.3.4. Dogs (Low Growth, Low Market Share)
- 4.4. Ansoff Matrix Analysis
- 4.5. Supply Chain Analysis
- 4.6. Regulatory Landscape
- 4.7. Current Market Potential and Opportunity Assessment (TAM–SAM–SOM Framework)
- 4.8. MDP Analyst Note
- 4.1. Porters Five Forces
- 5. Market Analysis, Insights and Forecast 2021-2033
- 5.1. Market Analysis, Insights and Forecast - by Ownership
- 5.1.1. Operator-owned
- 5.1.2. Contractor-owned
- 5.2. Market Analysis, Insights and Forecast - by Water Depth
- 5.2.1. Shallow Water
- 5.2.2. Deep Water
- 5.2.3. Ultra-deep Water
- 5.3. Market Analysis, Insights and Forecast - by Region
- 5.3.1. North America
- 5.3.2. Europe
- 5.3.3. Asia Pacific
- 5.3.4. South America
- 5.3.5. Middle East and Africa
- 5.1. Market Analysis, Insights and Forecast - by Ownership
- 6. Global FPSO Market Analysis, Insights and Forecast, 2021-2033
- 6.1. Market Analysis, Insights and Forecast - by Ownership
- 6.1.1. Operator-owned
- 6.1.2. Contractor-owned
- 6.2. Market Analysis, Insights and Forecast - by Water Depth
- 6.2.1. Shallow Water
- 6.2.2. Deep Water
- 6.2.3. Ultra-deep Water
- 6.1. Market Analysis, Insights and Forecast - by Ownership
- 7. North America FPSO Market Analysis, Insights and Forecast, 2020-2032
- 7.1. Market Analysis, Insights and Forecast - by Ownership
- 7.1.1. Operator-owned
- 7.1.2. Contractor-owned
- 7.2. Market Analysis, Insights and Forecast - by Water Depth
- 7.2.1. Shallow Water
- 7.2.2. Deep Water
- 7.2.3. Ultra-deep Water
- 7.1. Market Analysis, Insights and Forecast - by Ownership
- 8. Europe FPSO Market Analysis, Insights and Forecast, 2020-2032
- 8.1. Market Analysis, Insights and Forecast - by Ownership
- 8.1.1. Operator-owned
- 8.1.2. Contractor-owned
- 8.2. Market Analysis, Insights and Forecast - by Water Depth
- 8.2.1. Shallow Water
- 8.2.2. Deep Water
- 8.2.3. Ultra-deep Water
- 8.1. Market Analysis, Insights and Forecast - by Ownership
- 9. Asia Pacific FPSO Market Analysis, Insights and Forecast, 2020-2032
- 9.1. Market Analysis, Insights and Forecast - by Ownership
- 9.1.1. Operator-owned
- 9.1.2. Contractor-owned
- 9.2. Market Analysis, Insights and Forecast - by Water Depth
- 9.2.1. Shallow Water
- 9.2.2. Deep Water
- 9.2.3. Ultra-deep Water
- 9.1. Market Analysis, Insights and Forecast - by Ownership
- 10. South America FPSO Market Analysis, Insights and Forecast, 2020-2032
- 10.1. Market Analysis, Insights and Forecast - by Ownership
- 10.1.1. Operator-owned
- 10.1.2. Contractor-owned
- 10.2. Market Analysis, Insights and Forecast - by Water Depth
- 10.2.1. Shallow Water
- 10.2.2. Deep Water
- 10.2.3. Ultra-deep Water
- 10.1. Market Analysis, Insights and Forecast - by Ownership
- 11. Middle East and Africa FPSO Market Analysis, Insights and Forecast, 2020-2032
- 11.1. Market Analysis, Insights and Forecast - by Ownership
- 11.1.1. Operator-owned
- 11.1.2. Contractor-owned
- 11.2. Market Analysis, Insights and Forecast - by Water Depth
- 11.2.1. Shallow Water
- 11.2.2. Deep Water
- 11.2.3. Ultra-deep Water
- 11.1. Market Analysis, Insights and Forecast - by Ownership
- 12. Competitive Analysis
- 12.1. Company Profiles
- 12.1.1 6 Shell PLC
- 12.1.1.1. Company Overview
- 12.1.1.2. Products
- 12.1.1.3. Company Financials
- 12.1.1.4. SWOT Analysis
- 12.1.2 5 Bluewater Holding BV
- 12.1.2.1. Company Overview
- 12.1.2.2. Products
- 12.1.2.3. Company Financials
- 12.1.2.4. SWOT Analysis
- 12.1.3 6 Saipem SpA
- 12.1.3.1. Company Overview
- 12.1.3.2. Products
- 12.1.3.3. Company Financials
- 12.1.3.4. SWOT Analysis
- 12.1.4 7 BP PLC*List Not Exhaustive
- 12.1.4.1. Company Overview
- 12.1.4.2. Products
- 12.1.4.3. Company Financials
- 12.1.4.4. SWOT Analysis
- 12.1.5 1 Petroleo Brasileiro SA (Petrobras)
- 12.1.5.1. Company Overview
- 12.1.5.2. Products
- 12.1.5.3. Company Financials
- 12.1.5.4. SWOT Analysis
- 12.1.6 4 Teekay Offshore Partners LP
- 12.1.6.1. Company Overview
- 12.1.6.2. Products
- 12.1.6.3. Company Financials
- 12.1.6.4. SWOT Analysis
- 12.1.7 5 Chevron Corporation
- 12.1.7.1. Company Overview
- 12.1.7.2. Products
- 12.1.7.3. Company Financials
- 12.1.7.4. SWOT Analysis
- 12.1.8 3 TotalEnergies SE
- 12.1.8.1. Company Overview
- 12.1.8.2. Products
- 12.1.8.3. Company Financials
- 12.1.8.4. SWOT Analysis
- 12.1.9 7 Petrofac Limited
- 12.1.9.1. Company Overview
- 12.1.9.2. Products
- 12.1.9.3. Company Financials
- 12.1.9.4. SWOT Analysis
- 12.1.10 4 ExxonMobil Corp
- 12.1.10.1. Company Overview
- 12.1.10.2. Products
- 12.1.10.3. Company Financials
- 12.1.10.4. SWOT Analysis
- 12.1.11 1 Modec Inc
- 12.1.11.1. Company Overview
- 12.1.11.2. Products
- 12.1.11.3. Company Financials
- 12.1.11.4. SWOT Analysis
- 12.1.12 3 BW Offshore Limited
- 12.1.12.1. Company Overview
- 12.1.12.2. Products
- 12.1.12.3. Company Financials
- 12.1.12.4. SWOT Analysis
- 12.1.13 FPSO Operators
- 12.1.13.1. Company Overview
- 12.1.13.2. Products
- 12.1.13.3. Company Financials
- 12.1.13.4. SWOT Analysis
- 12.1.14 2 SBM Offshore NV
- 12.1.14.1. Company Overview
- 12.1.14.2. Products
- 12.1.14.3. Company Financials
- 12.1.14.4. SWOT Analysis
- 12.1.15 2 CNOOC Ltd
- 12.1.15.1. Company Overview
- 12.1.15.2. Products
- 12.1.15.3. Company Financials
- 12.1.15.4. SWOT Analysis
- 12.1.16 FPSO Contractors
- 12.1.16.1. Company Overview
- 12.1.16.2. Products
- 12.1.16.3. Company Financials
- 12.1.16.4. SWOT Analysis
- 12.1.1 6 Shell PLC
- 12.2. Market Entropy
- 12.2.1 Company's Key Areas Served
- 12.2.2 Recent Developments
- 12.3. Company Market Share Analysis 2025
- 12.3.1 Top 5 Companies Market Share Analysis
- 12.3.2 Top 3 Companies Market Share Analysis
- 12.4. List of Potential Customers
- 13. Research Methodology
List of Figures
- Figure 1: Global FPSO Market Revenue Breakdown (Million, %) by Region 2025 & 2033
- Figure 2: North America FPSO Market Revenue (Million), by Ownership 2025 & 2033
- Figure 3: North America FPSO Market Revenue Share (%), by Ownership 2025 & 2033
- Figure 4: North America FPSO Market Revenue (Million), by Water Depth 2025 & 2033
- Figure 5: North America FPSO Market Revenue Share (%), by Water Depth 2025 & 2033
- Figure 6: North America FPSO Market Revenue (Million), by Country 2025 & 2033
- Figure 7: North America FPSO Market Revenue Share (%), by Country 2025 & 2033
- Figure 8: Europe FPSO Market Revenue (Million), by Ownership 2025 & 2033
- Figure 9: Europe FPSO Market Revenue Share (%), by Ownership 2025 & 2033
- Figure 10: Europe FPSO Market Revenue (Million), by Water Depth 2025 & 2033
- Figure 11: Europe FPSO Market Revenue Share (%), by Water Depth 2025 & 2033
- Figure 12: Europe FPSO Market Revenue (Million), by Country 2025 & 2033
- Figure 13: Europe FPSO Market Revenue Share (%), by Country 2025 & 2033
- Figure 14: Asia Pacific FPSO Market Revenue (Million), by Ownership 2025 & 2033
- Figure 15: Asia Pacific FPSO Market Revenue Share (%), by Ownership 2025 & 2033
- Figure 16: Asia Pacific FPSO Market Revenue (Million), by Water Depth 2025 & 2033
- Figure 17: Asia Pacific FPSO Market Revenue Share (%), by Water Depth 2025 & 2033
- Figure 18: Asia Pacific FPSO Market Revenue (Million), by Country 2025 & 2033
- Figure 19: Asia Pacific FPSO Market Revenue Share (%), by Country 2025 & 2033
- Figure 20: South America FPSO Market Revenue (Million), by Ownership 2025 & 2033
- Figure 21: South America FPSO Market Revenue Share (%), by Ownership 2025 & 2033
- Figure 22: South America FPSO Market Revenue (Million), by Water Depth 2025 & 2033
- Figure 23: South America FPSO Market Revenue Share (%), by Water Depth 2025 & 2033
- Figure 24: South America FPSO Market Revenue (Million), by Country 2025 & 2033
- Figure 25: South America FPSO Market Revenue Share (%), by Country 2025 & 2033
- Figure 26: Middle East and Africa FPSO Market Revenue (Million), by Ownership 2025 & 2033
- Figure 27: Middle East and Africa FPSO Market Revenue Share (%), by Ownership 2025 & 2033
- Figure 28: Middle East and Africa FPSO Market Revenue (Million), by Water Depth 2025 & 2033
- Figure 29: Middle East and Africa FPSO Market Revenue Share (%), by Water Depth 2025 & 2033
- Figure 30: Middle East and Africa FPSO Market Revenue (Million), by Country 2025 & 2033
- Figure 31: Middle East and Africa FPSO Market Revenue Share (%), by Country 2025 & 2033
List of Tables
- Table 1: Global FPSO Market Revenue Million Forecast, by Ownership 2020 & 2033
- Table 2: Global FPSO Market Revenue Million Forecast, by Water Depth 2020 & 2033
- Table 3: Global FPSO Market Revenue Million Forecast, by Region 2020 & 2033
- Table 4: Global FPSO Market Revenue Million Forecast, by Ownership 2020 & 2033
- Table 5: Global FPSO Market Revenue Million Forecast, by Water Depth 2020 & 2033
- Table 6: Global FPSO Market Revenue Million Forecast, by Country 2020 & 2033
- Table 7: United States FPSO Market Revenue (Million) Forecast, by Application 2020 & 2033
- Table 8: Canada FPSO Market Revenue (Million) Forecast, by Application 2020 & 2033
- Table 9: Mexico FPSO Market Revenue (Million) Forecast, by Application 2020 & 2033
- Table 10: Rest of North America FPSO Market Revenue (Million) Forecast, by Application 2020 & 2033
- Table 11: Global FPSO Market Revenue Million Forecast, by Ownership 2020 & 2033
- Table 12: Global FPSO Market Revenue Million Forecast, by Water Depth 2020 & 2033
- Table 13: Global FPSO Market Revenue Million Forecast, by Country 2020 & 2033
- Table 14: Norway FPSO Market Revenue (Million) Forecast, by Application 2020 & 2033
- Table 15: United Kingdom FPSO Market Revenue (Million) Forecast, by Application 2020 & 2033
- Table 16: Russia FPSO Market Revenue (Million) Forecast, by Application 2020 & 2033
- Table 17: Netherland FPSO Market Revenue (Million) Forecast, by Application 2020 & 2033
- Table 18: France FPSO Market Revenue (Million) Forecast, by Application 2020 & 2033
- Table 19: Italy FPSO Market Revenue (Million) Forecast, by Application 2020 & 2033
- Table 20: NORDIC FPSO Market Revenue (Million) Forecast, by Application 2020 & 2033
- Table 21: Germany FPSO Market Revenue (Million) Forecast, by Application 2020 & 2033
- Table 22: Spain FPSO Market Revenue (Million) Forecast, by Application 2020 & 2033
- Table 23: Rest of Europe FPSO Market Revenue (Million) Forecast, by Application 2020 & 2033
- Table 24: Global FPSO Market Revenue Million Forecast, by Ownership 2020 & 2033
- Table 25: Global FPSO Market Revenue Million Forecast, by Water Depth 2020 & 2033
- Table 26: Global FPSO Market Revenue Million Forecast, by Country 2020 & 2033
- Table 27: China FPSO Market Revenue (Million) Forecast, by Application 2020 & 2033
- Table 28: India FPSO Market Revenue (Million) Forecast, by Application 2020 & 2033
- Table 29: Australia FPSO Market Revenue (Million) Forecast, by Application 2020 & 2033
- Table 30: Indonesia FPSO Market Revenue (Million) Forecast, by Application 2020 & 2033
- Table 31: Malaysia FPSO Market Revenue (Million) Forecast, by Application 2020 & 2033
- Table 32: Thailand FPSO Market Revenue (Million) Forecast, by Application 2020 & 2033
- Table 33: Japan FPSO Market Revenue (Million) Forecast, by Application 2020 & 2033
- Table 34: Vietnam FPSO Market Revenue (Million) Forecast, by Application 2020 & 2033
- Table 35: Rest of Asia Pacific FPSO Market Revenue (Million) Forecast, by Application 2020 & 2033
- Table 36: Global FPSO Market Revenue Million Forecast, by Ownership 2020 & 2033
- Table 37: Global FPSO Market Revenue Million Forecast, by Water Depth 2020 & 2033
- Table 38: Global FPSO Market Revenue Million Forecast, by Country 2020 & 2033
- Table 39: Brazil FPSO Market Revenue (Million) Forecast, by Application 2020 & 2033
- Table 40: Argentina FPSO Market Revenue (Million) Forecast, by Application 2020 & 2033
- Table 41: Venezuela FPSO Market Revenue (Million) Forecast, by Application 2020 & 2033
- Table 42: Colombia FPSO Market Revenue (Million) Forecast, by Application 2020 & 2033
- Table 43: Rest of South America FPSO Market Revenue (Million) Forecast, by Application 2020 & 2033
- Table 44: Global FPSO Market Revenue Million Forecast, by Ownership 2020 & 2033
- Table 45: Global FPSO Market Revenue Million Forecast, by Water Depth 2020 & 2033
- Table 46: Global FPSO Market Revenue Million Forecast, by Country 2020 & 2033
- Table 47: Saudi Arabia FPSO Market Revenue (Million) Forecast, by Application 2020 & 2033
- Table 48: United Arab Emirates FPSO Market Revenue (Million) Forecast, by Application 2020 & 2033
- Table 49: Nigeria FPSO Market Revenue (Million) Forecast, by Application 2020 & 2033
- Table 50: Algeria FPSO Market Revenue (Million) Forecast, by Application 2020 & 2033
- Table 51: Qatar FPSO Market Revenue (Million) Forecast, by Application 2020 & 2033
- Table 52: South Africa FPSO Market Revenue (Million) Forecast, by Application 2020 & 2033
- Table 53: Egypt FPSO Market Revenue (Million) Forecast, by Application 2020 & 2033
- Table 54: Rest of Middle East and Africa FPSO Market Revenue (Million) Forecast, by Application 2020 & 2033
Frequently Asked Questions
1. What is the projected Compound Annual Growth Rate (CAGR) of the FPSO Market?
The projected CAGR is approximately 8.50%.
2. Which companies are prominent players in the FPSO Market?
Key companies in the market include 6 Shell PLC, 5 Bluewater Holding BV, 6 Saipem SpA, 7 BP PLC*List Not Exhaustive, 1 Petroleo Brasileiro SA (Petrobras), 4 Teekay Offshore Partners LP, 5 Chevron Corporation, 3 TotalEnergies SE, 7 Petrofac Limited, 4 ExxonMobil Corp, 1 Modec Inc, 3 BW Offshore Limited, FPSO Operators, 2 SBM Offshore NV, 2 CNOOC Ltd, FPSO Contractors.
3. What are the main segments of the FPSO Market?
The market segments include Ownership, Water Depth.
4. Can you provide details about the market size?
The market size is estimated to be USD 12.04 Million as of 2022.
5. What are some drivers contributing to market growth?
4.; Increasing Offshore Oil and Gas Exploration and Production Activities4.; Growing Demand for Energy.
6. What are the notable trends driving market growth?
Contractor-owned FPSO Expected to Dominate the Market.
7. Are there any restraints impacting market growth?
4.; High Upfront Costs.
8. Can you provide examples of recent developments in the market?
May 2023: SBM Offshore and Esso Exploration & Production Guyana entered a 10-year Operations and Maintenance Enabling Agreement. The agreement entails SBM Offshore being responsible for the operations and maintenance of four FPSOs: Liza Destiny, Liza Unity, Prosperity, and ONE GUYANA.
9. What pricing options are available for accessing the report?
Pricing options include single-user, multi-user, and enterprise licenses priced at USD 4750, USD 5250, and USD 8750 respectively.
10. Is the market size provided in terms of value or volume?
The market size is provided in terms of value, measured in Million.
11. Are there any specific market keywords associated with the report?
Yes, the market keyword associated with the report is "FPSO Market," which aids in identifying and referencing the specific market segment covered.
12. How do I determine which pricing option suits my needs best?
The pricing options vary based on user requirements and access needs. Individual users may opt for single-user licenses, while businesses requiring broader access may choose multi-user or enterprise licenses for cost-effective access to the report.
13. Are there any additional resources or data provided in the FPSO Market report?
While the report offers comprehensive insights, it's advisable to review the specific contents or supplementary materials provided to ascertain if additional resources or data are available.
14. How can I stay updated on further developments or reports in the FPSO Market?
To stay informed about further developments, trends, and reports in the FPSO Market, consider subscribing to industry newsletters, following relevant companies and organizations, or regularly checking reputable industry news sources and publications.
Methodology
Step 1 - Identification of Relevant Samples Size from Population Database


Step 2 - Approaches for Defining Global Market Size (Value, Volume* & Price*)

Note*: In applicable scenarios
Step 3 - Data Sources
Primary Research
- Web Analytics
- Survey Reports
- Research Institute
- Latest Research Reports
- Opinion Leaders
Secondary Research
- Annual Reports
- White Paper
- Latest Press Release
- Industry Association
- Paid Database
- Investor Presentations

Step 4 - Data Triangulation
Involves using different sources of information in order to increase the validity of a study
These sources are likely to be stakeholders in a program - participants, other researchers, program staff, other community members, and so on.
Then we put all data in single framework & apply various statistical tools to find out the dynamic on the market.
During the analysis stage, feedback from the stakeholder groups would be compared to determine areas of agreement as well as areas of divergence