

Key Insights
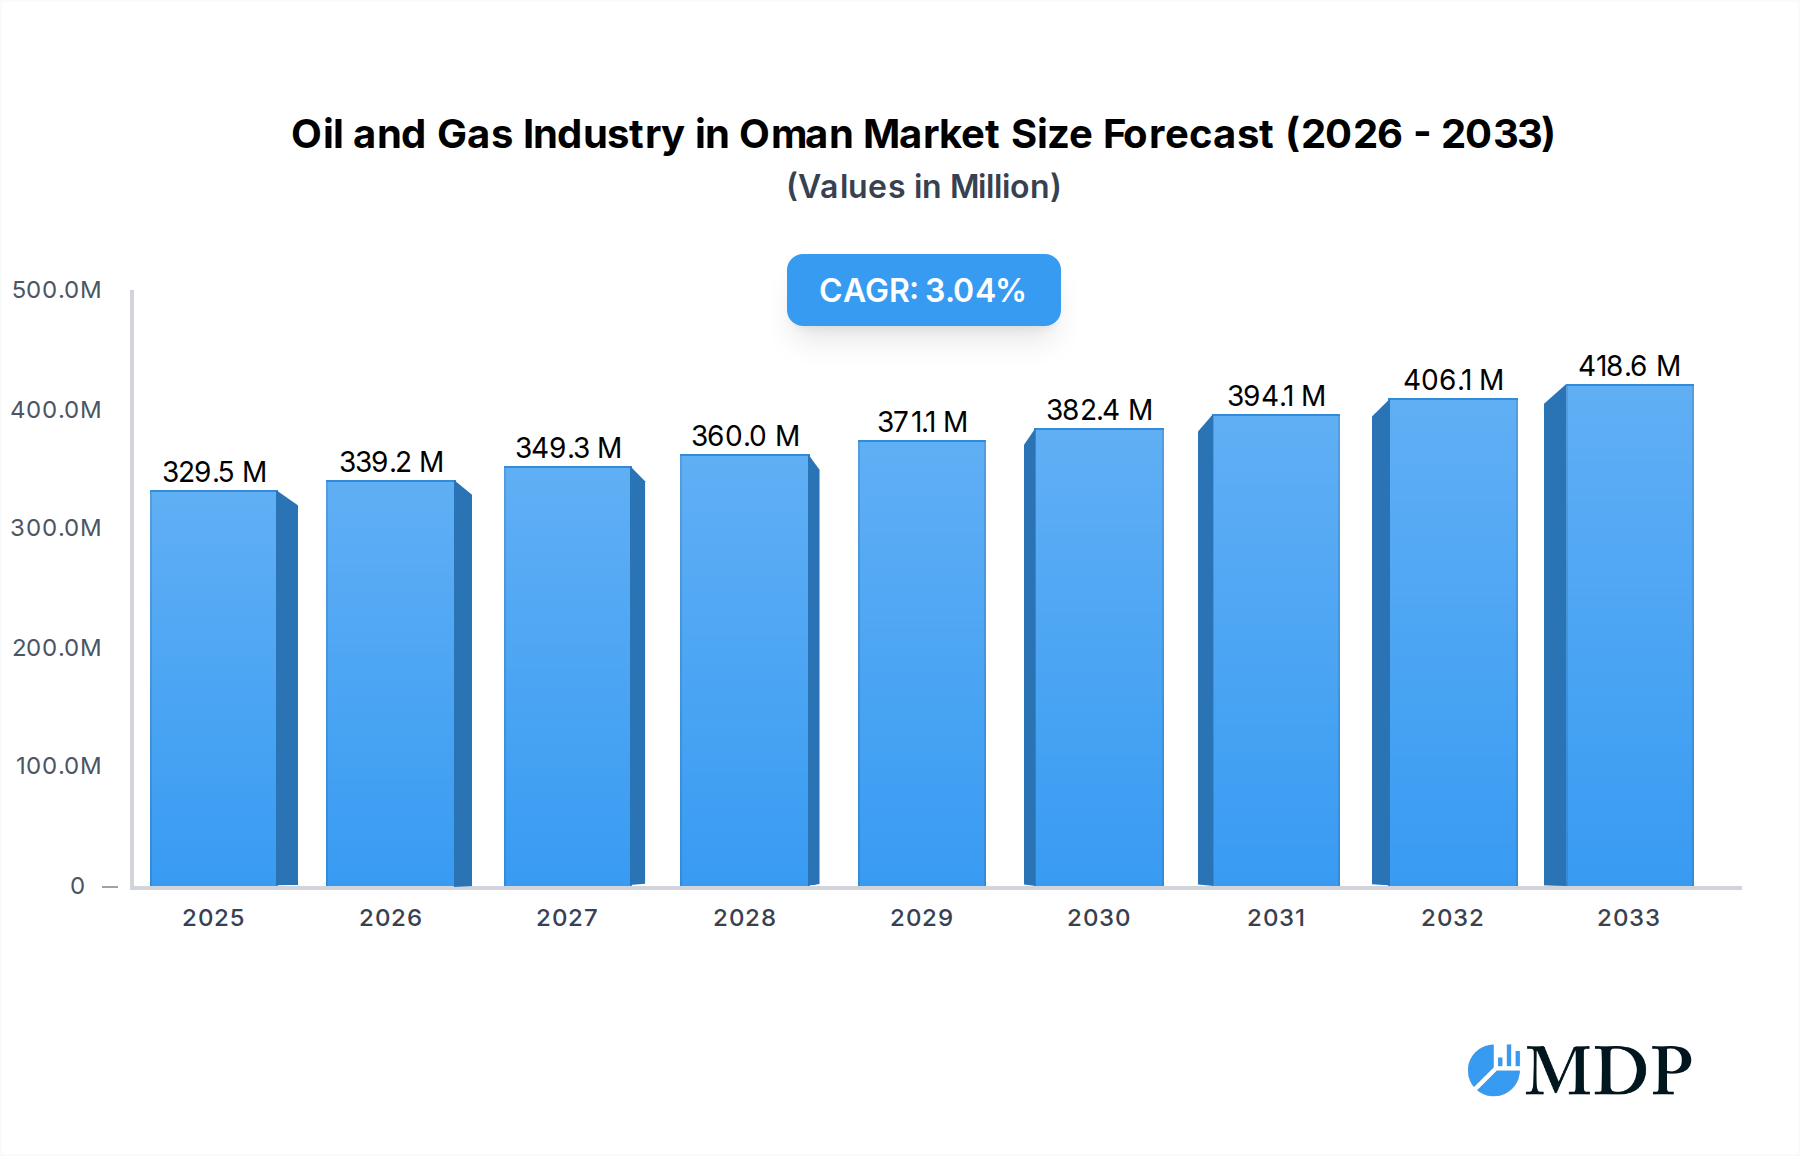
The Omani oil and gas industry is poised for steady growth, projecting a market size of USD 329.46 million in 2025 with a Compound Annual Growth Rate (CAGR) of 2.9% during the forecast period. This expansion is primarily fueled by strategic investments in both upstream and downstream sectors, aimed at enhancing production capacity and diversifying the energy portfolio. Key drivers include the nation's commitment to increasing crude oil output through both onshore and offshore exploration and development projects, alongside significant advancements in midstream infrastructure, such as crude transportation networks and LNG terminal expansions. The downstream segment is also experiencing a revival, with ongoing modernization of refineries and the development of petrochemical plants to add value to crude oil and natural gas resources. These concerted efforts are designed to capitalize on evolving global energy demands and solidify Oman's position as a reliable energy producer.

Oil and Gas Industry in Oman Market Size (In Million)
Despite the positive outlook, the industry faces certain restraints, including the inherent volatility of global oil prices and increasing pressure for environmental sustainability and a transition to cleaner energy sources. However, Oman's strategic location and its proactive approach to energy policy, including initiatives for energy efficiency and exploration of new energy technologies, are expected to mitigate these challenges. The market is segmented across upstream (onshore and offshore), midstream (crude transportation, LNG terminals, and storage), and downstream (refineries and petrochemical plants), each contributing to the overall market dynamics. Major international and national players, including Petroleum Development Oman, Shell PLC, and China National Petroleum Corporation, are actively involved, driving innovation and capacity expansion across these segments, particularly within the GCC and wider Middle East & Africa region, which represents a significant market share.
Oil and Gas Industry in Oman Company Market Share
Unlocking Oman's Oil & Gas Potential: A Comprehensive Market Analysis (2019-2033)
This in-depth report offers a detailed exploration of the Oman oil and gas industry, providing critical insights for stakeholders seeking to navigate this dynamic sector. Spanning the historical period from 2019 to 2024 and projecting through to 2033, with a base and estimated year of 2025, this analysis delves into market dynamics, key trends, leading segments, product developments, growth drivers, challenges, emerging opportunities, and strategic outlook. Packed with actionable data and high-traffic keywords like "Oman oil and gas market," "upstream Oman," "downstream Oman," "LNG Oman," and "petrochemical Oman," this report is your essential guide to understanding the present and future of Oman's vital energy sector.
Oil and Gas Industry in Oman Market Dynamics & Concentration
The Oman oil and gas industry exhibits a moderate market concentration, with Petroleum Development Oman (PDO) holding a significant, though not monopolistic, share. Innovation drivers are primarily fueled by the nation's commitment to enhancing exploration and production efficiency, alongside investments in downstream diversification. The regulatory framework, overseen by the Ministry of Energy & Minerals, remains a critical influence, prioritizing sustainable development and attracting foreign direct investment. Product substitutes, while nascent in the energy transition, are not yet posing a significant threat to core oil and gas products in the short to medium term. End-user trends are increasingly focused on domestic industrial demand and export market optimization. Merger and acquisition activities, while not at an explosive pace, are strategic, often involving international partnerships aimed at technology transfer and resource access. Historical data indicates approximately 5 to 10 significant M&A deals annually, with market share distribution showing PDO accounting for over 60% of upstream production, while downstream segments are more fragmented.
Oil and Gas Industry in Oman Industry Trends & Analysis
The Oman oil and gas market is experiencing robust growth driven by a strategic national vision to maximize hydrocarbon resource utilization and economic diversification. A key market growth driver is the nation's proactive approach to attracting international investment in exploration and production, evidenced by recent licensing rounds offering promising new blocks. Technological disruptions are increasingly shaping the sector, with a growing emphasis on advanced seismic imaging, enhanced oil recovery (EOR) techniques, and digitalization to optimize operational efficiency and reduce costs. Consumer preferences, particularly within the industrial sector, are shifting towards reliable and competitively priced energy supplies, bolstering demand for both natural gas and refined products. Competitive dynamics are characterized by strategic collaborations and joint ventures, fostering a balanced yet competitive landscape. The projected Compound Annual Growth Rate (CAGR) for the Oman oil and gas industry is estimated at approximately 4% for the forecast period 2025-2033. Market penetration of advanced technologies is steadily increasing, with investments in digital transformation across upstream, midstream, and downstream operations expected to accelerate.
Leading Markets & Segments in Oil and Gas Industry in Oman
The Upstream: Onshore segment stands as the dominant force within the Oman oil and gas industry. Its dominance is underpinned by extensive proven reserves and a long history of successful exploration and production activities.
- Key Upcoming and Existing Projects: Ongoing investments in enhanced oil recovery (EOR) projects and the development of new discoveries in onshore concession areas continue to drive production. For example, the continued optimization of PDO's extensive onshore fields remains a cornerstone of national production.
- Offshore: While currently a smaller contributor, the offshore segment is poised for significant growth, driven by exploration into deeper waters and the potential for substantial new discoveries.
- Midstream: Crude Transportation: This segment is critical for connecting upstream production to domestic and international markets. Investments are focused on maintaining and upgrading existing pipeline networks to ensure efficient and safe delivery.
- LNG Terminal and Storage: Oman's established LNG infrastructure plays a vital role in its export strategy and domestic gas supply. Expansion and modernization efforts are crucial to meet growing regional and global demand.
- Downstream: Refineries: The downstream sector is a key pillar of Oman's economic diversification. Existing refineries are undergoing upgrades to increase capacity and produce higher-value products.
- Key Upcoming and Existing Projects: The development of new integrated refining and petrochemical complexes is a major focus, aiming to boost value addition and create employment opportunities.
- Petrochemical Plants: The growth of petrochemicals is intrinsically linked to the refining sector, leveraging feedstock to produce a range of high-value chemicals and polymers. This segment is a significant driver of industrial growth and export diversification.
Oil and Gas Industry in Oman Product Developments
Product developments within the Oman oil and gas industry are increasingly focused on value-added derivatives and cleaner energy solutions. Investments in petrochemical complexes are yielding a wider array of polymers and chemicals, catering to growing regional manufacturing needs. There's also a nascent but growing interest in exploring the potential for hydrogen production and carbon capture technologies, aligning with global decarbonization trends and enhancing the long-term sustainability of the sector. These innovations aim to optimize resource utilization, create new revenue streams, and position Oman as a forward-thinking energy producer.
Key Drivers of Oil and Gas Industry in Oman Growth
The growth of the Oman oil and gas industry is propelled by several key factors. Strategically, the government's commitment to maximizing hydrocarbon resource utilization through favorable licensing rounds and investment incentives is paramount. Technological advancements in exploration and production, such as advanced seismic imaging and EOR techniques, are unlocking previously inaccessible reserves. Furthermore, the increasing demand for energy from burgeoning industrial sectors within Oman and the wider GCC region provides a consistent market for both crude oil and natural gas. The nation's ongoing efforts to diversify its economy also mean that the oil and gas sector remains a crucial contributor to national revenue and development.
Challenges in the Oil and Gas Industry in Oman Market
Despite its strengths, the Oman oil and gas industry faces several challenges. Global price volatility for crude oil and natural gas presents an inherent economic risk, impacting revenue streams and investment decisions. Increasingly stringent environmental regulations and the global push towards decarbonization necessitate significant investments in cleaner technologies and sustainable practices. Competition from other major energy-producing nations for market share and investment capital remains a constant factor. Additionally, the logistical complexities and infrastructure requirements for developing remote or deepwater exploration blocks can pose significant operational hurdles.
Emerging Opportunities in Oil and Gas Industry in Oman
Emerging opportunities in the Oman oil and gas industry are diverse and strategically important. The nation's ongoing exploration licensing rounds continue to uncover new hydrocarbon potential, particularly in offshore regions. Investments in downstream petrochemicals offer significant scope for value addition and export diversification. Furthermore, Oman is actively exploring its potential in the burgeoning hydrogen economy, seeking to leverage its renewable energy resources and existing energy infrastructure for green and blue hydrogen production. Strategic partnerships with international companies remain a key catalyst for technological transfer and market access, positioning Oman to capitalize on future energy demands.
Leading Players in the Oil and Gas Industry in Oman Sector
- Petroleum Development Oman
- Shell PLC
- Oman Oil Marketing Company SAOG
- Masirah Oil Limited
- Occidental Petroleum Corporation
- Eni SpA
- BP PLC
- Total SA
- China National Petroleum Corporation
Key Milestones in Oil and Gas Industry in Oman Industry
- April 2023: Masirah Oil, a subsidiary of Singapore-headquartered independent Rex International, announced to explore its flagship asset offshore Oman, with its sights set on a production boost from the block 50 purchases. In addition, a block-wide review of exploration potential would be performed. Based on the results of an exploration review at Block 50, planning for acquiring additional targeted seismic would be implemented.
- March 2023: The Omani Ministry of Energy & Minerals offered domestic and international investors three oil and gas exploration areas as part of its latest licensing round. The tracts offered blocks 15, 36, and 54, where multiple companies have conducted seismic and drilling activities.
- January 2023: Shell Integrated Gas Oman BV, a subsidiary of Shell PLC, announced the beginning of gas production from the Mabrouk North East field in Block 10 in Oman. Production from Block 10 is expected to touch 0.5 billion standard cubic feet of gas per day (bscf/d) by mid-2024, with the produced gas supplied to Oman's gas network that feeds local industries.
Strategic Outlook for Oil and Gas Industry in Oman Market
The strategic outlook for the Oman oil and gas industry is one of sustained growth and targeted diversification. The nation's commitment to exploring new frontiers, particularly in offshore exploration, will continue to unlock new reserves. Significant investments are anticipated in the downstream sector, focusing on expanding refining capacities and developing high-value petrochemical products to capture a larger share of the value chain. Furthermore, Oman's proactive engagement with the energy transition, including its exploration of hydrogen and renewable energy integration, positions it favorably for long-term sustainability and market relevance. Strategic international collaborations will remain pivotal in driving technological innovation and securing market access, ensuring the continued resilience and prosperity of Oman's vital energy sector.
Oil and Gas Industry in Oman Segmentation
-
1. Upstream
-
1.1. Onshore
- 1.1.1. Overview
- 1.1.2. Key Upcoming and Existing Projects
- 1.2. Offshore
-
1.1. Onshore
-
2. Midstream
-
2.1. Crude Transportation
- 2.1.1. Overview
- 2.1.2. Key Upcoming and Existing Projects
- 2.2. LNG Terminal and Storage
-
2.1. Crude Transportation
-
3. Downstream
-
3.1. Refineries
- 3.1.1. Overview
- 3.1.2. Key Upcoming and Existing Projects
- 3.2. Petrochemical Plants
-
3.1. Refineries
Oil and Gas Industry in Oman Segmentation By Geography
-
1. North America
- 1.1. United States
- 1.2. Canada
- 1.3. Mexico
-
2. South America
- 2.1. Brazil
- 2.2. Argentina
- 2.3. Rest of South America
-
3. Europe
- 3.1. United Kingdom
- 3.2. Germany
- 3.3. France
- 3.4. Italy
- 3.5. Spain
- 3.6. Russia
- 3.7. Benelux
- 3.8. Nordics
- 3.9. Rest of Europe
-
4. Middle East & Africa
- 4.1. Turkey
- 4.2. Israel
- 4.3. GCC
- 4.4. North Africa
- 4.5. South Africa
- 4.6. Rest of Middle East & Africa
-
5. Asia Pacific
- 5.1. China
- 5.2. India
- 5.3. Japan
- 5.4. South Korea
- 5.5. ASEAN
- 5.6. Oceania
- 5.7. Rest of Asia Pacific
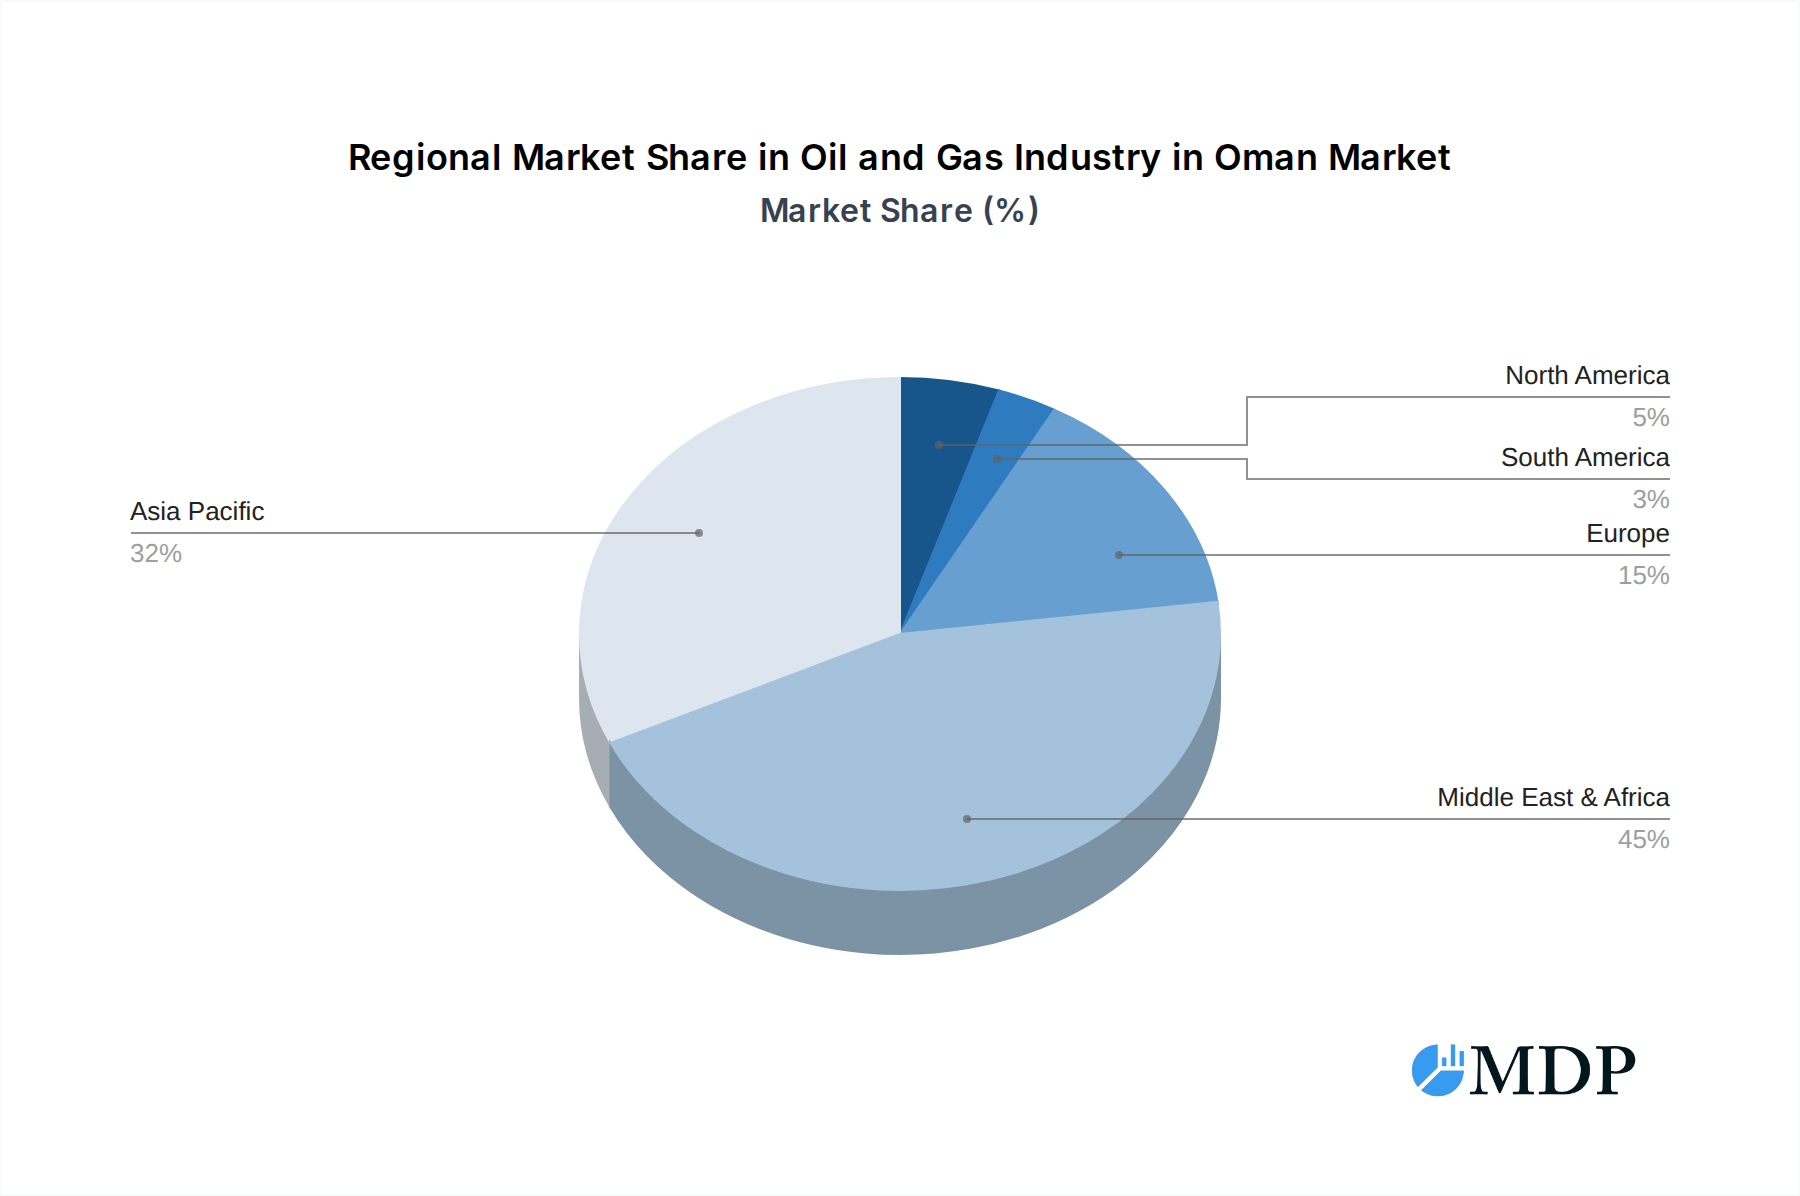
Oil and Gas Industry in Oman Regional Market Share
Geographic Coverage of Oil and Gas Industry in Oman
Oil and Gas Industry in Oman REPORT HIGHLIGHTS
| Aspects | Details |
|---|---|
| Study Period | 2020-2034 |
| Base Year | 2025 |
| Estimated Year | 2026 |
| Forecast Period | 2026-2034 |
| Historical Period | 2020-2025 |
| Growth Rate | CAGR of 2.9% from 2020-2034 |
| Segmentation |
|
Table of Contents
- 1. Introduction
- 1.1. Research Scope
- 1.2. Market Segmentation
- 1.3. Research Objective
- 1.4. Definitions and Assumptions
- 2. Executive Summary
- 2.1. Market Snapshot
- 3. Market Dynamics
- 3.1. Market Drivers
- 3.2. Market Restrains
- 3.3. Market Trends
- 3.4. Market Opportunities
- 4. Market Factor Analysis
- 4.1. Porters Five Forces
- 4.1.1. Bargaining Power of Suppliers
- 4.1.2. Bargaining Power of Buyers
- 4.1.3. Threat of New Entrants
- 4.1.4. Threat of Substitutes
- 4.1.5. Competitive Rivalry
- 4.2. PESTEL analysis
- 4.3. BCG Analysis
- 4.3.1. Stars (High Growth, High Market Share)
- 4.3.2. Cash Cows (Low Growth, High Market Share)
- 4.3.3. Question Mark (High Growth, Low Market Share)
- 4.3.4. Dogs (Low Growth, Low Market Share)
- 4.4. Ansoff Matrix Analysis
- 4.5. Supply Chain Analysis
- 4.6. Regulatory Landscape
- 4.7. Current Market Potential and Opportunity Assessment (TAM–SAM–SOM Framework)
- 4.8. MDP Analyst Note
- 4.1. Porters Five Forces
- 5. Market Analysis, Insights and Forecast 2021-2033
- 5.1. Market Analysis, Insights and Forecast - by Upstream
- 5.1.1. Onshore
- 5.1.1.1. Overview
- 5.1.1.2. Key Upcoming and Existing Projects
- 5.1.2. Offshore
- 5.1.1. Onshore
- 5.2. Market Analysis, Insights and Forecast - by Midstream
- 5.2.1. Crude Transportation
- 5.2.1.1. Overview
- 5.2.1.2. Key Upcoming and Existing Projects
- 5.2.2. LNG Terminal and Storage
- 5.2.1. Crude Transportation
- 5.3. Market Analysis, Insights and Forecast - by Downstream
- 5.3.1. Refineries
- 5.3.1.1. Overview
- 5.3.1.2. Key Upcoming and Existing Projects
- 5.3.2. Petrochemical Plants
- 5.3.1. Refineries
- 5.4. Market Analysis, Insights and Forecast - by Region
- 5.4.1. North America
- 5.4.2. South America
- 5.4.3. Europe
- 5.4.4. Middle East & Africa
- 5.4.5. Asia Pacific
- 5.1. Market Analysis, Insights and Forecast - by Upstream
- 6. Global Oil and Gas Industry in Oman Analysis, Insights and Forecast, 2021-2033
- 6.1. Market Analysis, Insights and Forecast - by Upstream
- 6.1.1. Onshore
- 6.1.1.1. Overview
- 6.1.1.2. Key Upcoming and Existing Projects
- 6.1.2. Offshore
- 6.1.1. Onshore
- 6.2. Market Analysis, Insights and Forecast - by Midstream
- 6.2.1. Crude Transportation
- 6.2.1.1. Overview
- 6.2.1.2. Key Upcoming and Existing Projects
- 6.2.2. LNG Terminal and Storage
- 6.2.1. Crude Transportation
- 6.3. Market Analysis, Insights and Forecast - by Downstream
- 6.3.1. Refineries
- 6.3.1.1. Overview
- 6.3.1.2. Key Upcoming and Existing Projects
- 6.3.2. Petrochemical Plants
- 6.3.1. Refineries
- 6.1. Market Analysis, Insights and Forecast - by Upstream
- 7. North America Oil and Gas Industry in Oman Analysis, Insights and Forecast, 2020-2032
- 7.1. Market Analysis, Insights and Forecast - by Upstream
- 7.1.1. Onshore
- 7.1.1.1. Overview
- 7.1.1.2. Key Upcoming and Existing Projects
- 7.1.2. Offshore
- 7.1.1. Onshore
- 7.2. Market Analysis, Insights and Forecast - by Midstream
- 7.2.1. Crude Transportation
- 7.2.1.1. Overview
- 7.2.1.2. Key Upcoming and Existing Projects
- 7.2.2. LNG Terminal and Storage
- 7.2.1. Crude Transportation
- 7.3. Market Analysis, Insights and Forecast - by Downstream
- 7.3.1. Refineries
- 7.3.1.1. Overview
- 7.3.1.2. Key Upcoming and Existing Projects
- 7.3.2. Petrochemical Plants
- 7.3.1. Refineries
- 7.1. Market Analysis, Insights and Forecast - by Upstream
- 8. South America Oil and Gas Industry in Oman Analysis, Insights and Forecast, 2020-2032
- 8.1. Market Analysis, Insights and Forecast - by Upstream
- 8.1.1. Onshore
- 8.1.1.1. Overview
- 8.1.1.2. Key Upcoming and Existing Projects
- 8.1.2. Offshore
- 8.1.1. Onshore
- 8.2. Market Analysis, Insights and Forecast - by Midstream
- 8.2.1. Crude Transportation
- 8.2.1.1. Overview
- 8.2.1.2. Key Upcoming and Existing Projects
- 8.2.2. LNG Terminal and Storage
- 8.2.1. Crude Transportation
- 8.3. Market Analysis, Insights and Forecast - by Downstream
- 8.3.1. Refineries
- 8.3.1.1. Overview
- 8.3.1.2. Key Upcoming and Existing Projects
- 8.3.2. Petrochemical Plants
- 8.3.1. Refineries
- 8.1. Market Analysis, Insights and Forecast - by Upstream
- 9. Europe Oil and Gas Industry in Oman Analysis, Insights and Forecast, 2020-2032
- 9.1. Market Analysis, Insights and Forecast - by Upstream
- 9.1.1. Onshore
- 9.1.1.1. Overview
- 9.1.1.2. Key Upcoming and Existing Projects
- 9.1.2. Offshore
- 9.1.1. Onshore
- 9.2. Market Analysis, Insights and Forecast - by Midstream
- 9.2.1. Crude Transportation
- 9.2.1.1. Overview
- 9.2.1.2. Key Upcoming and Existing Projects
- 9.2.2. LNG Terminal and Storage
- 9.2.1. Crude Transportation
- 9.3. Market Analysis, Insights and Forecast - by Downstream
- 9.3.1. Refineries
- 9.3.1.1. Overview
- 9.3.1.2. Key Upcoming and Existing Projects
- 9.3.2. Petrochemical Plants
- 9.3.1. Refineries
- 9.1. Market Analysis, Insights and Forecast - by Upstream
- 10. Middle East & Africa Oil and Gas Industry in Oman Analysis, Insights and Forecast, 2020-2032
- 10.1. Market Analysis, Insights and Forecast - by Upstream
- 10.1.1. Onshore
- 10.1.1.1. Overview
- 10.1.1.2. Key Upcoming and Existing Projects
- 10.1.2. Offshore
- 10.1.1. Onshore
- 10.2. Market Analysis, Insights and Forecast - by Midstream
- 10.2.1. Crude Transportation
- 10.2.1.1. Overview
- 10.2.1.2. Key Upcoming and Existing Projects
- 10.2.2. LNG Terminal and Storage
- 10.2.1. Crude Transportation
- 10.3. Market Analysis, Insights and Forecast - by Downstream
- 10.3.1. Refineries
- 10.3.1.1. Overview
- 10.3.1.2. Key Upcoming and Existing Projects
- 10.3.2. Petrochemical Plants
- 10.3.1. Refineries
- 10.1. Market Analysis, Insights and Forecast - by Upstream
- 11. Asia Pacific Oil and Gas Industry in Oman Analysis, Insights and Forecast, 2020-2032
- 11.1. Market Analysis, Insights and Forecast - by Upstream
- 11.1.1. Onshore
- 11.1.1.1. Overview
- 11.1.1.2. Key Upcoming and Existing Projects
- 11.1.2. Offshore
- 11.1.1. Onshore
- 11.2. Market Analysis, Insights and Forecast - by Midstream
- 11.2.1. Crude Transportation
- 11.2.1.1. Overview
- 11.2.1.2. Key Upcoming and Existing Projects
- 11.2.2. LNG Terminal and Storage
- 11.2.1. Crude Transportation
- 11.3. Market Analysis, Insights and Forecast - by Downstream
- 11.3.1. Refineries
- 11.3.1.1. Overview
- 11.3.1.2. Key Upcoming and Existing Projects
- 11.3.2. Petrochemical Plants
- 11.3.1. Refineries
- 11.1. Market Analysis, Insights and Forecast - by Upstream
- 12. Competitive Analysis
- 12.1. Company Profiles
- 12.1.1 Petroleum Development Oman
- 12.1.1.1. Company Overview
- 12.1.1.2. Products
- 12.1.1.3. Company Financials
- 12.1.1.4. SWOT Analysis
- 12.1.2 Shell PLC
- 12.1.2.1. Company Overview
- 12.1.2.2. Products
- 12.1.2.3. Company Financials
- 12.1.2.4. SWOT Analysis
- 12.1.3 Oman Oil Marketing Company SAOG
- 12.1.3.1. Company Overview
- 12.1.3.2. Products
- 12.1.3.3. Company Financials
- 12.1.3.4. SWOT Analysis
- 12.1.4 Masirah Oil Limited
- 12.1.4.1. Company Overview
- 12.1.4.2. Products
- 12.1.4.3. Company Financials
- 12.1.4.4. SWOT Analysis
- 12.1.5 Occidental Petroleum Corporation
- 12.1.5.1. Company Overview
- 12.1.5.2. Products
- 12.1.5.3. Company Financials
- 12.1.5.4. SWOT Analysis
- 12.1.6 Eni SpA
- 12.1.6.1. Company Overview
- 12.1.6.2. Products
- 12.1.6.3. Company Financials
- 12.1.6.4. SWOT Analysis
- 12.1.7 BP PLC
- 12.1.7.1. Company Overview
- 12.1.7.2. Products
- 12.1.7.3. Company Financials
- 12.1.7.4. SWOT Analysis
- 12.1.8 Total SA
- 12.1.8.1. Company Overview
- 12.1.8.2. Products
- 12.1.8.3. Company Financials
- 12.1.8.4. SWOT Analysis
- 12.1.9 China National Petroleum Corporation*List Not Exhaustive
- 12.1.9.1. Company Overview
- 12.1.9.2. Products
- 12.1.9.3. Company Financials
- 12.1.9.4. SWOT Analysis
- 12.1.1 Petroleum Development Oman
- 12.2. Market Entropy
- 12.2.1 Company's Key Areas Served
- 12.2.2 Recent Developments
- 12.3. Company Market Share Analysis 2025
- 12.3.1 Top 5 Companies Market Share Analysis
- 12.3.2 Top 3 Companies Market Share Analysis
- 12.4. List of Potential Customers
- 13. Research Methodology
List of Figures
- Figure 1: Global Oil and Gas Industry in Oman Revenue Breakdown (million, %) by Region 2025 & 2033
- Figure 2: Global Oil and Gas Industry in Oman Volume Breakdown (Billion, %) by Region 2025 & 2033
- Figure 3: North America Oil and Gas Industry in Oman Revenue (million), by Upstream 2025 & 2033
- Figure 4: North America Oil and Gas Industry in Oman Volume (Billion), by Upstream 2025 & 2033
- Figure 5: North America Oil and Gas Industry in Oman Revenue Share (%), by Upstream 2025 & 2033
- Figure 6: North America Oil and Gas Industry in Oman Volume Share (%), by Upstream 2025 & 2033
- Figure 7: North America Oil and Gas Industry in Oman Revenue (million), by Midstream 2025 & 2033
- Figure 8: North America Oil and Gas Industry in Oman Volume (Billion), by Midstream 2025 & 2033
- Figure 9: North America Oil and Gas Industry in Oman Revenue Share (%), by Midstream 2025 & 2033
- Figure 10: North America Oil and Gas Industry in Oman Volume Share (%), by Midstream 2025 & 2033
- Figure 11: North America Oil and Gas Industry in Oman Revenue (million), by Downstream 2025 & 2033
- Figure 12: North America Oil and Gas Industry in Oman Volume (Billion), by Downstream 2025 & 2033
- Figure 13: North America Oil and Gas Industry in Oman Revenue Share (%), by Downstream 2025 & 2033
- Figure 14: North America Oil and Gas Industry in Oman Volume Share (%), by Downstream 2025 & 2033
- Figure 15: North America Oil and Gas Industry in Oman Revenue (million), by Country 2025 & 2033
- Figure 16: North America Oil and Gas Industry in Oman Volume (Billion), by Country 2025 & 2033
- Figure 17: North America Oil and Gas Industry in Oman Revenue Share (%), by Country 2025 & 2033
- Figure 18: North America Oil and Gas Industry in Oman Volume Share (%), by Country 2025 & 2033
- Figure 19: South America Oil and Gas Industry in Oman Revenue (million), by Upstream 2025 & 2033
- Figure 20: South America Oil and Gas Industry in Oman Volume (Billion), by Upstream 2025 & 2033
- Figure 21: South America Oil and Gas Industry in Oman Revenue Share (%), by Upstream 2025 & 2033
- Figure 22: South America Oil and Gas Industry in Oman Volume Share (%), by Upstream 2025 & 2033
- Figure 23: South America Oil and Gas Industry in Oman Revenue (million), by Midstream 2025 & 2033
- Figure 24: South America Oil and Gas Industry in Oman Volume (Billion), by Midstream 2025 & 2033
- Figure 25: South America Oil and Gas Industry in Oman Revenue Share (%), by Midstream 2025 & 2033
- Figure 26: South America Oil and Gas Industry in Oman Volume Share (%), by Midstream 2025 & 2033
- Figure 27: South America Oil and Gas Industry in Oman Revenue (million), by Downstream 2025 & 2033
- Figure 28: South America Oil and Gas Industry in Oman Volume (Billion), by Downstream 2025 & 2033
- Figure 29: South America Oil and Gas Industry in Oman Revenue Share (%), by Downstream 2025 & 2033
- Figure 30: South America Oil and Gas Industry in Oman Volume Share (%), by Downstream 2025 & 2033
- Figure 31: South America Oil and Gas Industry in Oman Revenue (million), by Country 2025 & 2033
- Figure 32: South America Oil and Gas Industry in Oman Volume (Billion), by Country 2025 & 2033
- Figure 33: South America Oil and Gas Industry in Oman Revenue Share (%), by Country 2025 & 2033
- Figure 34: South America Oil and Gas Industry in Oman Volume Share (%), by Country 2025 & 2033
- Figure 35: Europe Oil and Gas Industry in Oman Revenue (million), by Upstream 2025 & 2033
- Figure 36: Europe Oil and Gas Industry in Oman Volume (Billion), by Upstream 2025 & 2033
- Figure 37: Europe Oil and Gas Industry in Oman Revenue Share (%), by Upstream 2025 & 2033
- Figure 38: Europe Oil and Gas Industry in Oman Volume Share (%), by Upstream 2025 & 2033
- Figure 39: Europe Oil and Gas Industry in Oman Revenue (million), by Midstream 2025 & 2033
- Figure 40: Europe Oil and Gas Industry in Oman Volume (Billion), by Midstream 2025 & 2033
- Figure 41: Europe Oil and Gas Industry in Oman Revenue Share (%), by Midstream 2025 & 2033
- Figure 42: Europe Oil and Gas Industry in Oman Volume Share (%), by Midstream 2025 & 2033
- Figure 43: Europe Oil and Gas Industry in Oman Revenue (million), by Downstream 2025 & 2033
- Figure 44: Europe Oil and Gas Industry in Oman Volume (Billion), by Downstream 2025 & 2033
- Figure 45: Europe Oil and Gas Industry in Oman Revenue Share (%), by Downstream 2025 & 2033
- Figure 46: Europe Oil and Gas Industry in Oman Volume Share (%), by Downstream 2025 & 2033
- Figure 47: Europe Oil and Gas Industry in Oman Revenue (million), by Country 2025 & 2033
- Figure 48: Europe Oil and Gas Industry in Oman Volume (Billion), by Country 2025 & 2033
- Figure 49: Europe Oil and Gas Industry in Oman Revenue Share (%), by Country 2025 & 2033
- Figure 50: Europe Oil and Gas Industry in Oman Volume Share (%), by Country 2025 & 2033
- Figure 51: Middle East & Africa Oil and Gas Industry in Oman Revenue (million), by Upstream 2025 & 2033
- Figure 52: Middle East & Africa Oil and Gas Industry in Oman Volume (Billion), by Upstream 2025 & 2033
- Figure 53: Middle East & Africa Oil and Gas Industry in Oman Revenue Share (%), by Upstream 2025 & 2033
- Figure 54: Middle East & Africa Oil and Gas Industry in Oman Volume Share (%), by Upstream 2025 & 2033
- Figure 55: Middle East & Africa Oil and Gas Industry in Oman Revenue (million), by Midstream 2025 & 2033
- Figure 56: Middle East & Africa Oil and Gas Industry in Oman Volume (Billion), by Midstream 2025 & 2033
- Figure 57: Middle East & Africa Oil and Gas Industry in Oman Revenue Share (%), by Midstream 2025 & 2033
- Figure 58: Middle East & Africa Oil and Gas Industry in Oman Volume Share (%), by Midstream 2025 & 2033
- Figure 59: Middle East & Africa Oil and Gas Industry in Oman Revenue (million), by Downstream 2025 & 2033
- Figure 60: Middle East & Africa Oil and Gas Industry in Oman Volume (Billion), by Downstream 2025 & 2033
- Figure 61: Middle East & Africa Oil and Gas Industry in Oman Revenue Share (%), by Downstream 2025 & 2033
- Figure 62: Middle East & Africa Oil and Gas Industry in Oman Volume Share (%), by Downstream 2025 & 2033
- Figure 63: Middle East & Africa Oil and Gas Industry in Oman Revenue (million), by Country 2025 & 2033
- Figure 64: Middle East & Africa Oil and Gas Industry in Oman Volume (Billion), by Country 2025 & 2033
- Figure 65: Middle East & Africa Oil and Gas Industry in Oman Revenue Share (%), by Country 2025 & 2033
- Figure 66: Middle East & Africa Oil and Gas Industry in Oman Volume Share (%), by Country 2025 & 2033
- Figure 67: Asia Pacific Oil and Gas Industry in Oman Revenue (million), by Upstream 2025 & 2033
- Figure 68: Asia Pacific Oil and Gas Industry in Oman Volume (Billion), by Upstream 2025 & 2033
- Figure 69: Asia Pacific Oil and Gas Industry in Oman Revenue Share (%), by Upstream 2025 & 2033
- Figure 70: Asia Pacific Oil and Gas Industry in Oman Volume Share (%), by Upstream 2025 & 2033
- Figure 71: Asia Pacific Oil and Gas Industry in Oman Revenue (million), by Midstream 2025 & 2033
- Figure 72: Asia Pacific Oil and Gas Industry in Oman Volume (Billion), by Midstream 2025 & 2033
- Figure 73: Asia Pacific Oil and Gas Industry in Oman Revenue Share (%), by Midstream 2025 & 2033
- Figure 74: Asia Pacific Oil and Gas Industry in Oman Volume Share (%), by Midstream 2025 & 2033
- Figure 75: Asia Pacific Oil and Gas Industry in Oman Revenue (million), by Downstream 2025 & 2033
- Figure 76: Asia Pacific Oil and Gas Industry in Oman Volume (Billion), by Downstream 2025 & 2033
- Figure 77: Asia Pacific Oil and Gas Industry in Oman Revenue Share (%), by Downstream 2025 & 2033
- Figure 78: Asia Pacific Oil and Gas Industry in Oman Volume Share (%), by Downstream 2025 & 2033
- Figure 79: Asia Pacific Oil and Gas Industry in Oman Revenue (million), by Country 2025 & 2033
- Figure 80: Asia Pacific Oil and Gas Industry in Oman Volume (Billion), by Country 2025 & 2033
- Figure 81: Asia Pacific Oil and Gas Industry in Oman Revenue Share (%), by Country 2025 & 2033
- Figure 82: Asia Pacific Oil and Gas Industry in Oman Volume Share (%), by Country 2025 & 2033
List of Tables
- Table 1: Global Oil and Gas Industry in Oman Revenue million Forecast, by Upstream 2020 & 2033
- Table 2: Global Oil and Gas Industry in Oman Volume Billion Forecast, by Upstream 2020 & 2033
- Table 3: Global Oil and Gas Industry in Oman Revenue million Forecast, by Midstream 2020 & 2033
- Table 4: Global Oil and Gas Industry in Oman Volume Billion Forecast, by Midstream 2020 & 2033
- Table 5: Global Oil and Gas Industry in Oman Revenue million Forecast, by Downstream 2020 & 2033
- Table 6: Global Oil and Gas Industry in Oman Volume Billion Forecast, by Downstream 2020 & 2033
- Table 7: Global Oil and Gas Industry in Oman Revenue million Forecast, by Region 2020 & 2033
- Table 8: Global Oil and Gas Industry in Oman Volume Billion Forecast, by Region 2020 & 2033
- Table 9: Global Oil and Gas Industry in Oman Revenue million Forecast, by Upstream 2020 & 2033
- Table 10: Global Oil and Gas Industry in Oman Volume Billion Forecast, by Upstream 2020 & 2033
- Table 11: Global Oil and Gas Industry in Oman Revenue million Forecast, by Midstream 2020 & 2033
- Table 12: Global Oil and Gas Industry in Oman Volume Billion Forecast, by Midstream 2020 & 2033
- Table 13: Global Oil and Gas Industry in Oman Revenue million Forecast, by Downstream 2020 & 2033
- Table 14: Global Oil and Gas Industry in Oman Volume Billion Forecast, by Downstream 2020 & 2033
- Table 15: Global Oil and Gas Industry in Oman Revenue million Forecast, by Country 2020 & 2033
- Table 16: Global Oil and Gas Industry in Oman Volume Billion Forecast, by Country 2020 & 2033
- Table 17: United States Oil and Gas Industry in Oman Revenue (million) Forecast, by Application 2020 & 2033
- Table 18: United States Oil and Gas Industry in Oman Volume (Billion) Forecast, by Application 2020 & 2033
- Table 19: Canada Oil and Gas Industry in Oman Revenue (million) Forecast, by Application 2020 & 2033
- Table 20: Canada Oil and Gas Industry in Oman Volume (Billion) Forecast, by Application 2020 & 2033
- Table 21: Mexico Oil and Gas Industry in Oman Revenue (million) Forecast, by Application 2020 & 2033
- Table 22: Mexico Oil and Gas Industry in Oman Volume (Billion) Forecast, by Application 2020 & 2033
- Table 23: Global Oil and Gas Industry in Oman Revenue million Forecast, by Upstream 2020 & 2033
- Table 24: Global Oil and Gas Industry in Oman Volume Billion Forecast, by Upstream 2020 & 2033
- Table 25: Global Oil and Gas Industry in Oman Revenue million Forecast, by Midstream 2020 & 2033
- Table 26: Global Oil and Gas Industry in Oman Volume Billion Forecast, by Midstream 2020 & 2033
- Table 27: Global Oil and Gas Industry in Oman Revenue million Forecast, by Downstream 2020 & 2033
- Table 28: Global Oil and Gas Industry in Oman Volume Billion Forecast, by Downstream 2020 & 2033
- Table 29: Global Oil and Gas Industry in Oman Revenue million Forecast, by Country 2020 & 2033
- Table 30: Global Oil and Gas Industry in Oman Volume Billion Forecast, by Country 2020 & 2033
- Table 31: Brazil Oil and Gas Industry in Oman Revenue (million) Forecast, by Application 2020 & 2033
- Table 32: Brazil Oil and Gas Industry in Oman Volume (Billion) Forecast, by Application 2020 & 2033
- Table 33: Argentina Oil and Gas Industry in Oman Revenue (million) Forecast, by Application 2020 & 2033
- Table 34: Argentina Oil and Gas Industry in Oman Volume (Billion) Forecast, by Application 2020 & 2033
- Table 35: Rest of South America Oil and Gas Industry in Oman Revenue (million) Forecast, by Application 2020 & 2033
- Table 36: Rest of South America Oil and Gas Industry in Oman Volume (Billion) Forecast, by Application 2020 & 2033
- Table 37: Global Oil and Gas Industry in Oman Revenue million Forecast, by Upstream 2020 & 2033
- Table 38: Global Oil and Gas Industry in Oman Volume Billion Forecast, by Upstream 2020 & 2033
- Table 39: Global Oil and Gas Industry in Oman Revenue million Forecast, by Midstream 2020 & 2033
- Table 40: Global Oil and Gas Industry in Oman Volume Billion Forecast, by Midstream 2020 & 2033
- Table 41: Global Oil and Gas Industry in Oman Revenue million Forecast, by Downstream 2020 & 2033
- Table 42: Global Oil and Gas Industry in Oman Volume Billion Forecast, by Downstream 2020 & 2033
- Table 43: Global Oil and Gas Industry in Oman Revenue million Forecast, by Country 2020 & 2033
- Table 44: Global Oil and Gas Industry in Oman Volume Billion Forecast, by Country 2020 & 2033
- Table 45: United Kingdom Oil and Gas Industry in Oman Revenue (million) Forecast, by Application 2020 & 2033
- Table 46: United Kingdom Oil and Gas Industry in Oman Volume (Billion) Forecast, by Application 2020 & 2033
- Table 47: Germany Oil and Gas Industry in Oman Revenue (million) Forecast, by Application 2020 & 2033
- Table 48: Germany Oil and Gas Industry in Oman Volume (Billion) Forecast, by Application 2020 & 2033
- Table 49: France Oil and Gas Industry in Oman Revenue (million) Forecast, by Application 2020 & 2033
- Table 50: France Oil and Gas Industry in Oman Volume (Billion) Forecast, by Application 2020 & 2033
- Table 51: Italy Oil and Gas Industry in Oman Revenue (million) Forecast, by Application 2020 & 2033
- Table 52: Italy Oil and Gas Industry in Oman Volume (Billion) Forecast, by Application 2020 & 2033
- Table 53: Spain Oil and Gas Industry in Oman Revenue (million) Forecast, by Application 2020 & 2033
- Table 54: Spain Oil and Gas Industry in Oman Volume (Billion) Forecast, by Application 2020 & 2033
- Table 55: Russia Oil and Gas Industry in Oman Revenue (million) Forecast, by Application 2020 & 2033
- Table 56: Russia Oil and Gas Industry in Oman Volume (Billion) Forecast, by Application 2020 & 2033
- Table 57: Benelux Oil and Gas Industry in Oman Revenue (million) Forecast, by Application 2020 & 2033
- Table 58: Benelux Oil and Gas Industry in Oman Volume (Billion) Forecast, by Application 2020 & 2033
- Table 59: Nordics Oil and Gas Industry in Oman Revenue (million) Forecast, by Application 2020 & 2033
- Table 60: Nordics Oil and Gas Industry in Oman Volume (Billion) Forecast, by Application 2020 & 2033
- Table 61: Rest of Europe Oil and Gas Industry in Oman Revenue (million) Forecast, by Application 2020 & 2033
- Table 62: Rest of Europe Oil and Gas Industry in Oman Volume (Billion) Forecast, by Application 2020 & 2033
- Table 63: Global Oil and Gas Industry in Oman Revenue million Forecast, by Upstream 2020 & 2033
- Table 64: Global Oil and Gas Industry in Oman Volume Billion Forecast, by Upstream 2020 & 2033
- Table 65: Global Oil and Gas Industry in Oman Revenue million Forecast, by Midstream 2020 & 2033
- Table 66: Global Oil and Gas Industry in Oman Volume Billion Forecast, by Midstream 2020 & 2033
- Table 67: Global Oil and Gas Industry in Oman Revenue million Forecast, by Downstream 2020 & 2033
- Table 68: Global Oil and Gas Industry in Oman Volume Billion Forecast, by Downstream 2020 & 2033
- Table 69: Global Oil and Gas Industry in Oman Revenue million Forecast, by Country 2020 & 2033
- Table 70: Global Oil and Gas Industry in Oman Volume Billion Forecast, by Country 2020 & 2033
- Table 71: Turkey Oil and Gas Industry in Oman Revenue (million) Forecast, by Application 2020 & 2033
- Table 72: Turkey Oil and Gas Industry in Oman Volume (Billion) Forecast, by Application 2020 & 2033
- Table 73: Israel Oil and Gas Industry in Oman Revenue (million) Forecast, by Application 2020 & 2033
- Table 74: Israel Oil and Gas Industry in Oman Volume (Billion) Forecast, by Application 2020 & 2033
- Table 75: GCC Oil and Gas Industry in Oman Revenue (million) Forecast, by Application 2020 & 2033
- Table 76: GCC Oil and Gas Industry in Oman Volume (Billion) Forecast, by Application 2020 & 2033
- Table 77: North Africa Oil and Gas Industry in Oman Revenue (million) Forecast, by Application 2020 & 2033
- Table 78: North Africa Oil and Gas Industry in Oman Volume (Billion) Forecast, by Application 2020 & 2033
- Table 79: South Africa Oil and Gas Industry in Oman Revenue (million) Forecast, by Application 2020 & 2033
- Table 80: South Africa Oil and Gas Industry in Oman Volume (Billion) Forecast, by Application 2020 & 2033
- Table 81: Rest of Middle East & Africa Oil and Gas Industry in Oman Revenue (million) Forecast, by Application 2020 & 2033
- Table 82: Rest of Middle East & Africa Oil and Gas Industry in Oman Volume (Billion) Forecast, by Application 2020 & 2033
- Table 83: Global Oil and Gas Industry in Oman Revenue million Forecast, by Upstream 2020 & 2033
- Table 84: Global Oil and Gas Industry in Oman Volume Billion Forecast, by Upstream 2020 & 2033
- Table 85: Global Oil and Gas Industry in Oman Revenue million Forecast, by Midstream 2020 & 2033
- Table 86: Global Oil and Gas Industry in Oman Volume Billion Forecast, by Midstream 2020 & 2033
- Table 87: Global Oil and Gas Industry in Oman Revenue million Forecast, by Downstream 2020 & 2033
- Table 88: Global Oil and Gas Industry in Oman Volume Billion Forecast, by Downstream 2020 & 2033
- Table 89: Global Oil and Gas Industry in Oman Revenue million Forecast, by Country 2020 & 2033
- Table 90: Global Oil and Gas Industry in Oman Volume Billion Forecast, by Country 2020 & 2033
- Table 91: China Oil and Gas Industry in Oman Revenue (million) Forecast, by Application 2020 & 2033
- Table 92: China Oil and Gas Industry in Oman Volume (Billion) Forecast, by Application 2020 & 2033
- Table 93: India Oil and Gas Industry in Oman Revenue (million) Forecast, by Application 2020 & 2033
- Table 94: India Oil and Gas Industry in Oman Volume (Billion) Forecast, by Application 2020 & 2033
- Table 95: Japan Oil and Gas Industry in Oman Revenue (million) Forecast, by Application 2020 & 2033
- Table 96: Japan Oil and Gas Industry in Oman Volume (Billion) Forecast, by Application 2020 & 2033
- Table 97: South Korea Oil and Gas Industry in Oman Revenue (million) Forecast, by Application 2020 & 2033
- Table 98: South Korea Oil and Gas Industry in Oman Volume (Billion) Forecast, by Application 2020 & 2033
- Table 99: ASEAN Oil and Gas Industry in Oman Revenue (million) Forecast, by Application 2020 & 2033
- Table 100: ASEAN Oil and Gas Industry in Oman Volume (Billion) Forecast, by Application 2020 & 2033
- Table 101: Oceania Oil and Gas Industry in Oman Revenue (million) Forecast, by Application 2020 & 2033
- Table 102: Oceania Oil and Gas Industry in Oman Volume (Billion) Forecast, by Application 2020 & 2033
- Table 103: Rest of Asia Pacific Oil and Gas Industry in Oman Revenue (million) Forecast, by Application 2020 & 2033
- Table 104: Rest of Asia Pacific Oil and Gas Industry in Oman Volume (Billion) Forecast, by Application 2020 & 2033
Frequently Asked Questions
1. What is the projected Compound Annual Growth Rate (CAGR) of the Oil and Gas Industry in Oman?
The projected CAGR is approximately 2.9%.
2. Which companies are prominent players in the Oil and Gas Industry in Oman?
Key companies in the market include Petroleum Development Oman, Shell PLC, Oman Oil Marketing Company SAOG, Masirah Oil Limited, Occidental Petroleum Corporation, Eni SpA, BP PLC, Total SA, China National Petroleum Corporation*List Not Exhaustive.
3. What are the main segments of the Oil and Gas Industry in Oman?
The market segments include Upstream, Midstream, Downstream.
4. Can you provide details about the market size?
The market size is estimated to be USD 329.46 million as of 2022.
5. What are some drivers contributing to market growth?
4.; Increasing Gas Production and Infrastructure4.; Increasing Exploration and Production Activities.
6. What are the notable trends driving market growth?
Upstream Sector to Dominate the Market.
7. Are there any restraints impacting market growth?
4.; Increasing Gas Production and Infrastructure4.; Increasing Exploration and Production Activities.
8. Can you provide examples of recent developments in the market?
April 2023: Masirah Oil, a subsidiary of Singapore-headquartered independent Rex International, announced to explore its flagship asset offshore Oman, with its sights set on a production boost from the block 50 purchases. In addition, a block-wide review of exploration potential would be performed. Based on the results of an exploration review at Block 50, planning for acquiring additional targeted seismic would be implemented.
9. What pricing options are available for accessing the report?
Pricing options include single-user, multi-user, and enterprise licenses priced at USD 3800, USD 4500, and USD 5800 respectively.
10. Is the market size provided in terms of value or volume?
The market size is provided in terms of value, measured in million and volume, measured in Billion.
11. Are there any specific market keywords associated with the report?
Yes, the market keyword associated with the report is "Oil and Gas Industry in Oman," which aids in identifying and referencing the specific market segment covered.
12. How do I determine which pricing option suits my needs best?
The pricing options vary based on user requirements and access needs. Individual users may opt for single-user licenses, while businesses requiring broader access may choose multi-user or enterprise licenses for cost-effective access to the report.
13. Are there any additional resources or data provided in the Oil and Gas Industry in Oman report?
While the report offers comprehensive insights, it's advisable to review the specific contents or supplementary materials provided to ascertain if additional resources or data are available.
14. How can I stay updated on further developments or reports in the Oil and Gas Industry in Oman?
To stay informed about further developments, trends, and reports in the Oil and Gas Industry in Oman, consider subscribing to industry newsletters, following relevant companies and organizations, or regularly checking reputable industry news sources and publications.
Methodology
Step 1 - Identification of Relevant Samples Size from Population Database


Step 2 - Approaches for Defining Global Market Size (Value, Volume* & Price*)

Note*: In applicable scenarios
Step 3 - Data Sources
Primary Research
- Web Analytics
- Survey Reports
- Research Institute
- Latest Research Reports
- Opinion Leaders
Secondary Research
- Annual Reports
- White Paper
- Latest Press Release
- Industry Association
- Paid Database
- Investor Presentations

Step 4 - Data Triangulation
Involves using different sources of information in order to increase the validity of a study
These sources are likely to be stakeholders in a program - participants, other researchers, program staff, other community members, and so on.
Then we put all data in single framework & apply various statistical tools to find out the dynamic on the market.
During the analysis stage, feedback from the stakeholder groups would be compared to determine areas of agreement as well as areas of divergence