

Key Insights
The North America Shale Market is poised for substantial growth, currently valued at an estimated $88.6 billion in 2024. This robust expansion is driven by the region's abundant shale reserves, technological advancements in extraction techniques such as hydraulic fracturing and horizontal drilling, and a sustained global demand for oil and gas. The market is projected to experience a Compound Annual Growth Rate (CAGR) of 5.9% during the forecast period, indicating a dynamic and evolving landscape. Key drivers include increasing energy independence initiatives in the United States and Canada, coupled with the cost-effectiveness of shale extraction compared to traditional methods. The market is segmented across production analysis, consumption analysis, and import/export dynamics, all of which are expected to witness upward trends. Major players like ExxonMobil, Chevron, Marathon Petroleum, ConocoPhillips, and Pioneer Natural Resources are heavily invested in this sector, actively participating in exploration, production, and refining operations across key regions like the United States and Canada.
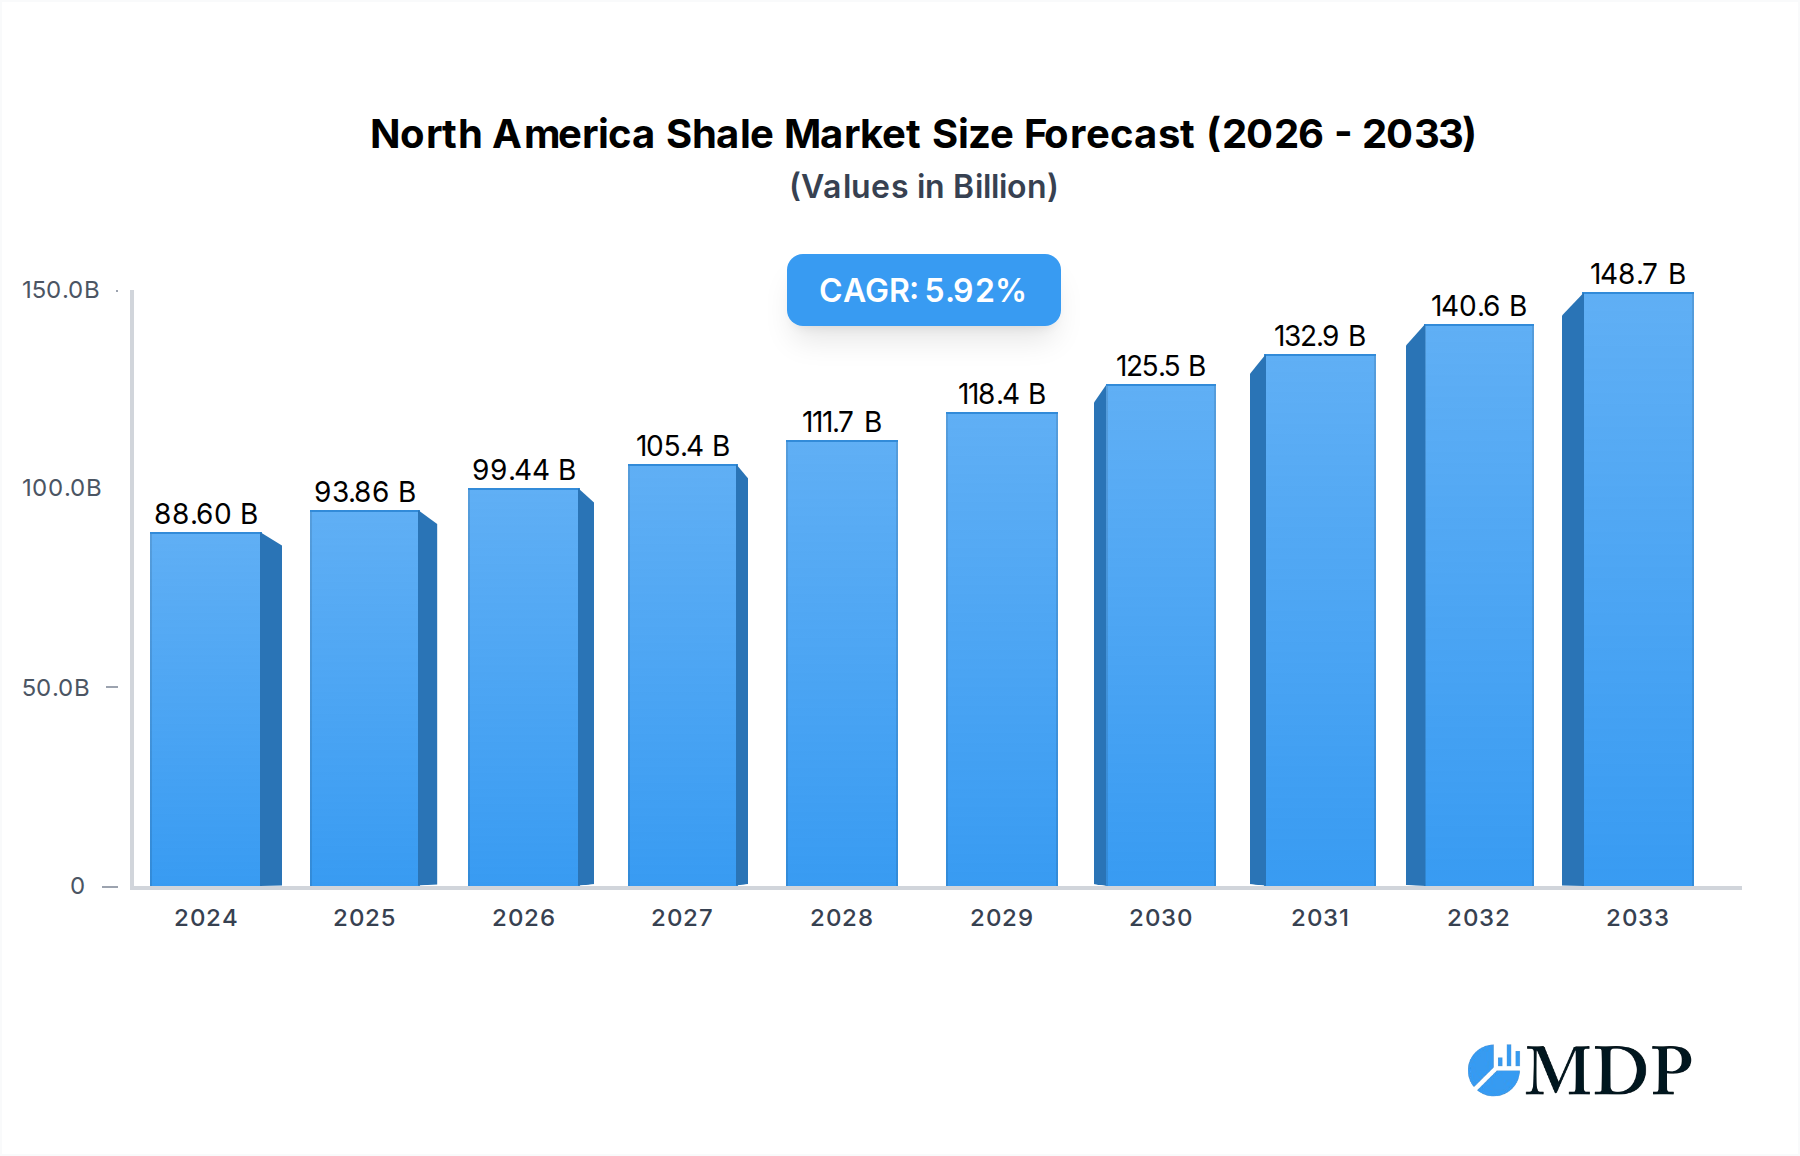
North America Shale Market Market Size (In Billion)
The market's trajectory is further shaped by evolving industry trends, including the integration of digital technologies for enhanced efficiency and safety, as well as a growing focus on environmental, social, and governance (ESG) practices within the industry. While significant opportunities exist, the market also faces certain restraints. These include increasing regulatory scrutiny concerning environmental impacts, fluctuating commodity prices that can affect investment decisions, and the ongoing global transition towards renewable energy sources, which may temper long-term demand growth. Nevertheless, the sheer volume of accessible shale resources and the established infrastructure for oil and gas distribution in North America are expected to sustain market momentum. The comprehensive analysis of production, consumption, import, and export volumes, alongside price trend analysis, will be crucial for stakeholders to navigate this complex and opportunity-rich market.

North America Shale Market Company Market Share
This in-depth report provides an exhaustive analysis of the North America Shale Market, a critical sector for global energy security. Leveraging extensive data and expert insights, this report covers market dynamics, industry trends, leading segments, product developments, key drivers, challenges, emerging opportunities, and a detailed strategic outlook. Our comprehensive coverage spans the historical period (2019-2024), base year (2025), estimated year (2025), and a robust forecast period (2025-2033), offering unparalleled insights for industry stakeholders, investors, and policymakers navigating the evolving North American energy landscape.
North America Shale Market Market Dynamics & Concentration
The North America Shale Market exhibits a moderate to high concentration, with a few dominant players controlling significant market share. ExxonMobil, Chevron, and Pioneer Natural Resources are among the key entities shaping the market's trajectory, holding substantial reserves and production capacities. Innovation is a primary driver, fueled by advancements in hydraulic fracturing and horizontal drilling technologies, leading to improved extraction efficiency and the unlocking of previously uneconomical reserves. The regulatory framework, while evolving to address environmental concerns, remains a crucial factor influencing operational permits and development strategies. Product substitutes, such as renewable energy sources, are gaining traction but the demand for oil and gas remains robust, particularly for industrial and transportation applications. End-user trends indicate a growing preference for cleaner extraction methods and a focus on energy efficiency across industries. Mergers and acquisitions (M&A) activities are dynamic, driven by the pursuit of economies of scale, access to premium acreage, and portfolio optimization. For instance, an estimated 50-75 M&A deals were observed in the historical period, with an aggregate deal value exceeding $50 billion. The market share of the top three players is estimated to be around 35-45% in the base year.
North America Shale Market Industry Trends & Analysis
The North America Shale Market is poised for significant expansion, driven by a confluence of factors including robust domestic demand, technological prowess, and favorable economic conditions. The Compound Annual Growth Rate (CAGR) for the forecast period (2025-2033) is projected to be around 4.5% to 6.0%, reflecting sustained growth in oil and natural gas production. Technological disruptions, particularly in enhanced oil recovery (EOR) techniques and digital oilfield solutions, are continuously improving operational efficiency and reducing extraction costs, leading to increased market penetration, estimated at 70-80% for shale-derived hydrocarbons in the region's energy mix. Consumer preferences are increasingly leaning towards lower-carbon intensity products, pushing producers to adopt more sustainable practices and invest in emissions reduction technologies. Competitive dynamics are intense, with companies constantly seeking to optimize their cost structures and gain market share through strategic acreage acquisition and exploration. The increasing adoption of AI and machine learning in reservoir characterization and production optimization is a notable trend. The global energy transition, while a long-term consideration, currently presents an opportunity for shale producers to meet immediate energy demands more efficiently and affordably. The continued demand for petrochemical feedstocks also underpins the growth of the shale gas segment.
Leading Markets & Segments in North America Shale Market
The Permian Basin, spanning across West Texas and New Mexico, is the undisputed leading region within the North America Shale Market. Its dominance is attributed to extensive proven reserves, prolific well productivity, and a well-established infrastructure for transportation and processing.
- Production Analysis: The Permian Basin consistently accounts for over 50% of total U.S. shale oil production and a significant portion of natural gas output. Key drivers include geological advantages, such as thick pay zones and high permeability, coupled with technological advancements in horizontal drilling and hydraulic fracturing tailored to the basin's specific geology.
- Consumption Analysis: While production is concentrated, consumption is more geographically dispersed across North America. However, regions with significant petrochemical complexes and industrial activity, such as the U.S. Gulf Coast and parts of the Midwest, represent major consumption hubs for shale-derived hydrocarbons. Economic policies promoting industrial growth and energy-intensive manufacturing bolster this demand.
- Import Market Analysis (Value & Volume): The North American shale market is a net exporter, meaning import volumes are relatively low. However, certain specialized crude grades or refined products might be imported to meet specific market demands. The value of imports is estimated to be around $5 billion to $10 billion annually.
- Export Market Analysis (Value & Volume): The export market is a crucial growth engine. Crude oil and Liquefied Natural Gas (LNG) are the primary export commodities. Asian and European markets represent the largest recipients. The value of exports is substantial, estimated at over $150 billion in the base year, with volumes projected to reach over 8 million barrels per day for crude oil and over 30 billion cubic feet per day for natural gas in the forecast period. Infrastructure investments in export terminals and pipelines are key enablers.
- Price Trend Analysis: Shale commodity prices are largely dictated by global benchmarks (WTI for oil, Henry Hub for natural gas) but are also influenced by regional supply-demand balances, production costs, and geopolitical events. The price of crude oil is expected to range between $75 to $95 per barrel, while natural gas prices are projected to be between $3.00 to $4.50 per MMBtu during the forecast period, subject to market volatility.
North America Shale Market Product Developments
Product developments in the North America Shale Market are centered on enhancing extraction efficiency and reducing environmental impact. Companies are investing in advanced materials for proppants, improved drilling fluids, and innovative completion techniques to maximize hydrocarbon recovery from existing wells and optimize the performance of new ones. The development of technologies for capturing and utilizing methane emissions, along with advancements in water recycling and treatment for hydraulic fracturing operations, are key areas of focus. These innovations provide competitive advantages by lowering operational costs, increasing production volumes, and meeting stringent environmental regulations, ensuring a sustainable supply of essential energy resources.
Key Drivers of North America Shale Market Growth
The growth of the North America Shale Market is propelled by several key factors. Technological advancements in horizontal drilling and hydraulic fracturing continue to unlock vast reserves and improve extraction economics, making previously uneconomical fields viable. Robust global demand for oil and natural gas, driven by industrial activity, transportation, and power generation, provides a consistent market for shale production. Supportive regulatory environments in certain key producing regions, coupled with significant private and public investment, further fuel expansion. The development of extensive midstream infrastructure, including pipelines and export terminals, ensures efficient transportation of produced hydrocarbons to domestic and international markets, solidifying the region's position as a major energy supplier.
Challenges in the North America Shale Market Market
Despite its growth, the North America Shale Market faces several challenges. Stringent environmental regulations, particularly concerning water usage, emissions, and seismic activity, can lead to increased operational costs and project delays. Supply chain disruptions, including shortages of skilled labor, equipment, and materials, can impede drilling and completion schedules. Intense competition among a large number of producers can exert downward pressure on prices and profit margins. Furthermore, the evolving global energy landscape and the push towards renewable energy sources present long-term uncertainties regarding future demand for fossil fuels. Volatility in commodity prices also poses a significant risk to investment decisions and profitability.
Emerging Opportunities in North America Shale Market
Emerging opportunities in the North America Shale Market lie in leveraging technological innovation for enhanced sustainability and market expansion. The development and adoption of Carbon Capture, Utilization, and Storage (CCUS) technologies present a significant avenue for reducing the carbon footprint of shale operations. Strategic partnerships and collaborations aimed at developing cleaner extraction methods and improving energy efficiency can unlock new markets and customer segments. Furthermore, the growing demand for natural gas as a transitional fuel, especially in power generation and for petrochemical feedstock, offers substantial growth potential. Investing in advanced analytics and digital transformation can optimize production, reduce costs, and improve decision-making, thereby enhancing overall market competitiveness and long-term viability.
Leading Players in the North America Shale Market Sector
- ExxonMobil
- Chevron
- Marathon Petroleum
- ConocoPhillips
- Pioneer Natural Resources
Key Milestones in North America Shale Market Industry
- 2019: Significant advancements in coiled tubing technology leading to improved well intervention and production optimization.
- 2020: Increased focus on methane emission reduction technologies and voluntary corporate commitments.
- 2021: Record levels of LNG exports from North America driven by global energy demand.
- 2022: Major acquisitions and consolidations within the Permian Basin, indicating market maturity and strategic repositioning.
- 2023: Enhanced adoption of digital oilfield technologies, including AI and IoT for real-time monitoring and predictive maintenance.
- Ongoing: Continued investment in pipeline infrastructure to support growing production and export capacities.
Strategic Outlook for North America Shale Market Market
The strategic outlook for the North America Shale Market remains positive, driven by its inherent advantages in resource availability and technological expertise. The market is expected to focus on optimizing existing production, enhancing operational efficiency, and investing in technologies that reduce environmental impact, such as methane capture and water recycling. Continued demand for oil and gas, particularly for industrial and petrochemical applications, will support production levels. Strategic opportunities lie in further developing export capabilities for both crude oil and LNG, capitalizing on global energy needs. Companies that prioritize innovation, embrace sustainable practices, and adapt to evolving market dynamics will be best positioned for long-term success and to maintain North America's crucial role in the global energy supply chain.
North America Shale Market Segmentation
- 1. Production Analysis
- 2. Consumption Analysis
- 3. Import Market Analysis (Value & Volume)
- 4. Export Market Analysis (Value & Volume)
- 5. Price Trend Analysis
North America Shale Market Segmentation By Geography
- 1. United States
- 2. Canada
- 3. Rest of North America
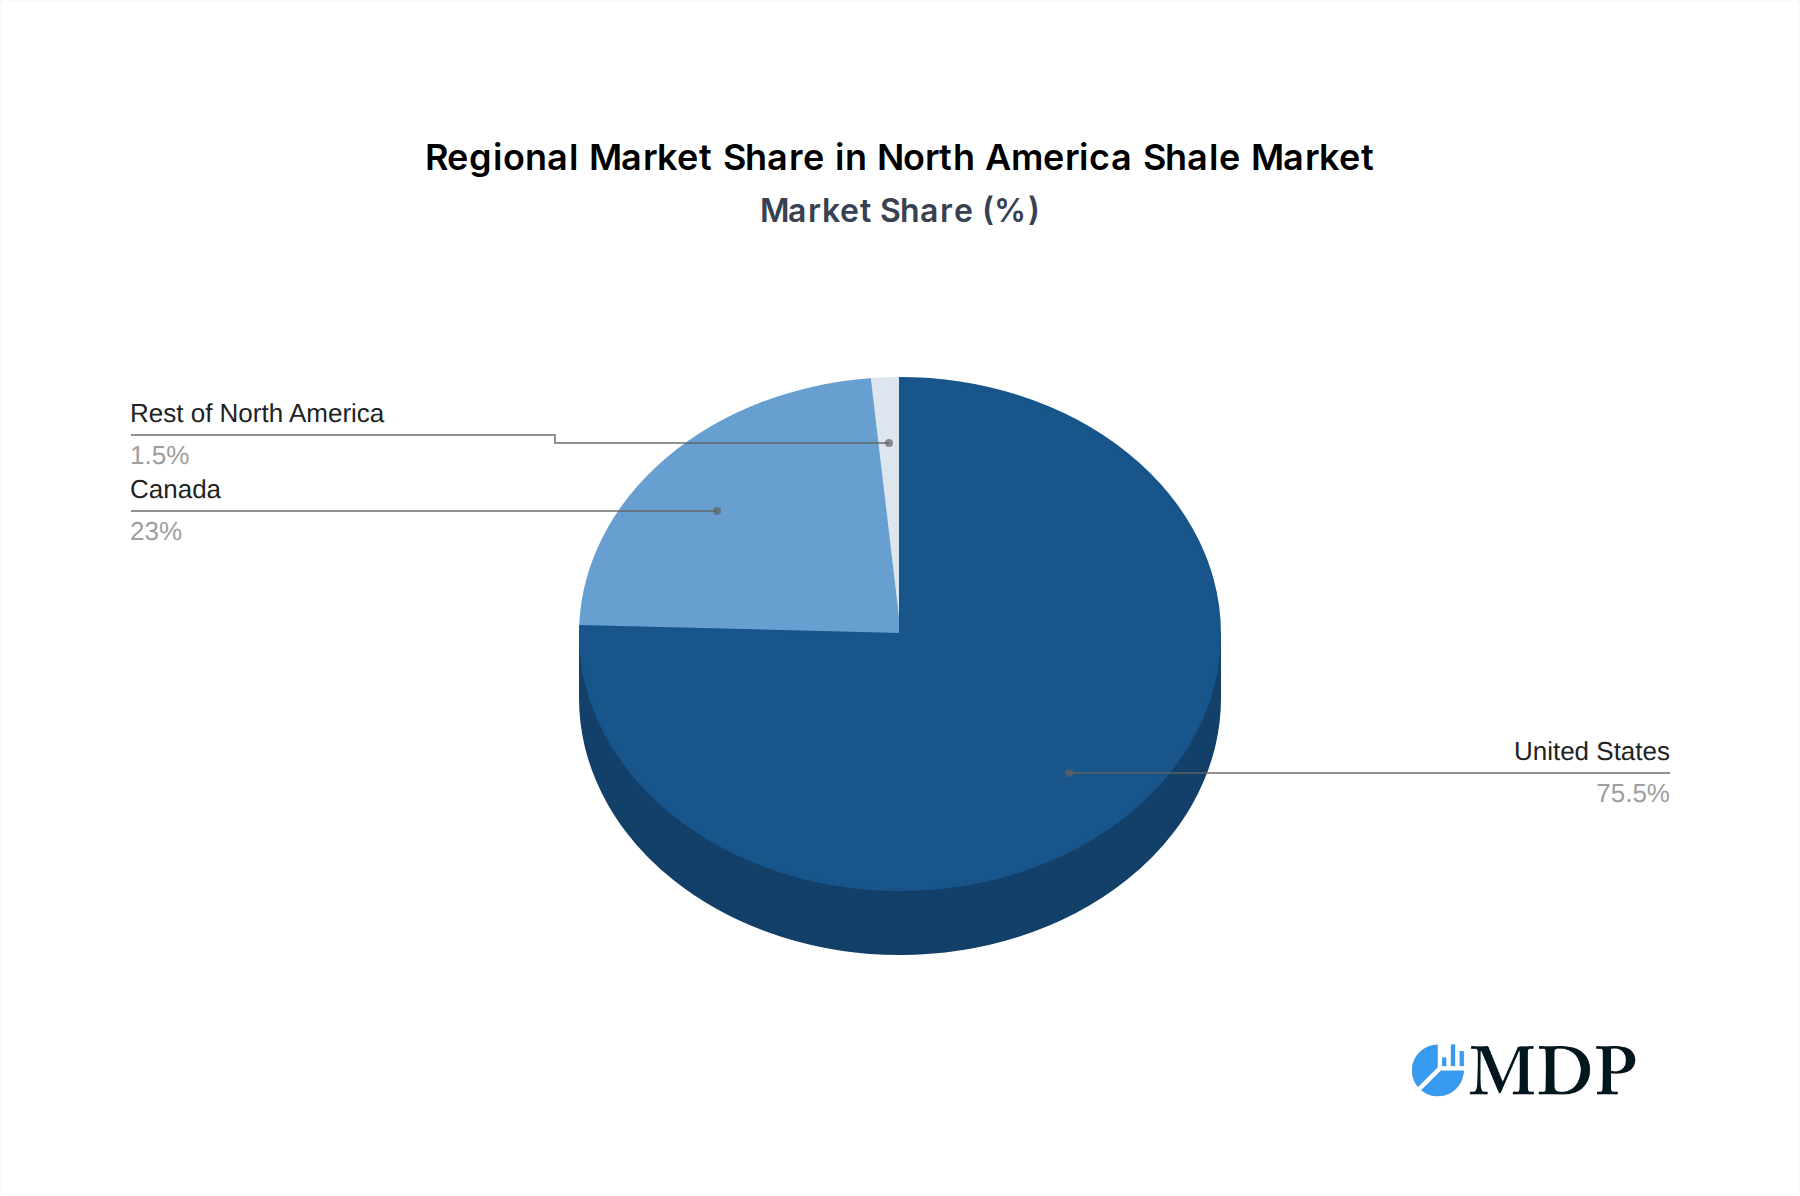
North America Shale Market Regional Market Share
Geographic Coverage of North America Shale Market
North America Shale Market REPORT HIGHLIGHTS
| Aspects | Details |
|---|---|
| Study Period | 2020-2034 |
| Base Year | 2025 |
| Estimated Year | 2026 |
| Forecast Period | 2026-2034 |
| Historical Period | 2020-2025 |
| Growth Rate | CAGR of 5.9% from 2020-2034 |
| Segmentation |
|
Table of Contents
- 1. Introduction
- 1.1. Research Scope
- 1.2. Market Segmentation
- 1.3. Research Objective
- 1.4. Definitions and Assumptions
- 2. Executive Summary
- 2.1. Market Snapshot
- 3. Market Dynamics
- 3.1. Market Drivers
- 3.2. Market Restrains
- 3.3. Market Trends
- 3.4. Market Opportunities
- 4. Market Factor Analysis
- 4.1. Porters Five Forces
- 4.1.1. Bargaining Power of Suppliers
- 4.1.2. Bargaining Power of Buyers
- 4.1.3. Threat of New Entrants
- 4.1.4. Threat of Substitutes
- 4.1.5. Competitive Rivalry
- 4.2. PESTEL analysis
- 4.3. BCG Analysis
- 4.3.1. Stars (High Growth, High Market Share)
- 4.3.2. Cash Cows (Low Growth, High Market Share)
- 4.3.3. Question Mark (High Growth, Low Market Share)
- 4.3.4. Dogs (Low Growth, Low Market Share)
- 4.4. Ansoff Matrix Analysis
- 4.5. Supply Chain Analysis
- 4.6. Regulatory Landscape
- 4.7. Current Market Potential and Opportunity Assessment (TAM–SAM–SOM Framework)
- 4.8. MDP Analyst Note
- 4.1. Porters Five Forces
- 5. Market Analysis, Insights and Forecast 2021-2033
- 5.1. Market Analysis, Insights and Forecast - by Production Analysis
- 5.2. Market Analysis, Insights and Forecast - by Consumption Analysis
- 5.3. Market Analysis, Insights and Forecast - by Import Market Analysis (Value & Volume)
- 5.4. Market Analysis, Insights and Forecast - by Export Market Analysis (Value & Volume)
- 5.5. Market Analysis, Insights and Forecast - by Price Trend Analysis
- 5.6. Market Analysis, Insights and Forecast - by Region
- 5.6.1. United States
- 5.6.2. Canada
- 5.6.3. Rest of North America
- 6. North America Shale Market Analysis, Insights and Forecast, 2021-2033
- 6.1. Market Analysis, Insights and Forecast - by Production Analysis
- 6.2. Market Analysis, Insights and Forecast - by Consumption Analysis
- 6.3. Market Analysis, Insights and Forecast - by Import Market Analysis (Value & Volume)
- 6.4. Market Analysis, Insights and Forecast - by Export Market Analysis (Value & Volume)
- 6.5. Market Analysis, Insights and Forecast - by Price Trend Analysis
- 7. United States North America Shale Market Analysis, Insights and Forecast, 2020-2032
- 7.1. Market Analysis, Insights and Forecast - by Production Analysis
- 7.2. Market Analysis, Insights and Forecast - by Consumption Analysis
- 7.3. Market Analysis, Insights and Forecast - by Import Market Analysis (Value & Volume)
- 7.4. Market Analysis, Insights and Forecast - by Export Market Analysis (Value & Volume)
- 7.5. Market Analysis, Insights and Forecast - by Price Trend Analysis
- 8. Canada North America Shale Market Analysis, Insights and Forecast, 2020-2032
- 8.1. Market Analysis, Insights and Forecast - by Production Analysis
- 8.2. Market Analysis, Insights and Forecast - by Consumption Analysis
- 8.3. Market Analysis, Insights and Forecast - by Import Market Analysis (Value & Volume)
- 8.4. Market Analysis, Insights and Forecast - by Export Market Analysis (Value & Volume)
- 8.5. Market Analysis, Insights and Forecast - by Price Trend Analysis
- 9. Rest of North America North America Shale Market Analysis, Insights and Forecast, 2020-2032
- 9.1. Market Analysis, Insights and Forecast - by Production Analysis
- 9.2. Market Analysis, Insights and Forecast - by Consumption Analysis
- 9.3. Market Analysis, Insights and Forecast - by Import Market Analysis (Value & Volume)
- 9.4. Market Analysis, Insights and Forecast - by Export Market Analysis (Value & Volume)
- 9.5. Market Analysis, Insights and Forecast - by Price Trend Analysis
- 10. Competitive Analysis
- 10.1. Company Profiles
- 10.1.1 ExxonMobil
- 10.1.1.1. Company Overview
- 10.1.1.2. Products
- 10.1.1.3. Company Financials
- 10.1.1.4. SWOT Analysis
- 10.1.2 Chevron
- 10.1.2.1. Company Overview
- 10.1.2.2. Products
- 10.1.2.3. Company Financials
- 10.1.2.4. SWOT Analysis
- 10.1.3 Marathon Petroleum
- 10.1.3.1. Company Overview
- 10.1.3.2. Products
- 10.1.3.3. Company Financials
- 10.1.3.4. SWOT Analysis
- 10.1.4 ConocoPhillips
- 10.1.4.1. Company Overview
- 10.1.4.2. Products
- 10.1.4.3. Company Financials
- 10.1.4.4. SWOT Analysis
- 10.1.5 Pioneer Natural Resources
- 10.1.5.1. Company Overview
- 10.1.5.2. Products
- 10.1.5.3. Company Financials
- 10.1.5.4. SWOT Analysis
- 10.1.1 ExxonMobil
- 10.2. Market Entropy
- 10.2.1 Company's Key Areas Served
- 10.2.2 Recent Developments
- 10.3. Company Market Share Analysis 2025
- 10.3.1 Top 5 Companies Market Share Analysis
- 10.3.2 Top 3 Companies Market Share Analysis
- 10.4. List of Potential Customers
- 11. Research Methodology
List of Figures
- Figure 1: North America Shale Market Revenue Breakdown (billion, %) by Product 2025 & 2033
- Figure 2: North America Shale Market Share (%) by Company 2025
List of Tables
- Table 1: North America Shale Market Revenue billion Forecast, by Production Analysis 2020 & 2033
- Table 2: North America Shale Market Revenue billion Forecast, by Consumption Analysis 2020 & 2033
- Table 3: North America Shale Market Revenue billion Forecast, by Import Market Analysis (Value & Volume) 2020 & 2033
- Table 4: North America Shale Market Revenue billion Forecast, by Export Market Analysis (Value & Volume) 2020 & 2033
- Table 5: North America Shale Market Revenue billion Forecast, by Price Trend Analysis 2020 & 2033
- Table 6: North America Shale Market Revenue billion Forecast, by Region 2020 & 2033
- Table 7: North America Shale Market Revenue billion Forecast, by Production Analysis 2020 & 2033
- Table 8: North America Shale Market Revenue billion Forecast, by Consumption Analysis 2020 & 2033
- Table 9: North America Shale Market Revenue billion Forecast, by Import Market Analysis (Value & Volume) 2020 & 2033
- Table 10: North America Shale Market Revenue billion Forecast, by Export Market Analysis (Value & Volume) 2020 & 2033
- Table 11: North America Shale Market Revenue billion Forecast, by Price Trend Analysis 2020 & 2033
- Table 12: North America Shale Market Revenue billion Forecast, by Country 2020 & 2033
- Table 13: North America Shale Market Revenue billion Forecast, by Production Analysis 2020 & 2033
- Table 14: North America Shale Market Revenue billion Forecast, by Consumption Analysis 2020 & 2033
- Table 15: North America Shale Market Revenue billion Forecast, by Import Market Analysis (Value & Volume) 2020 & 2033
- Table 16: North America Shale Market Revenue billion Forecast, by Export Market Analysis (Value & Volume) 2020 & 2033
- Table 17: North America Shale Market Revenue billion Forecast, by Price Trend Analysis 2020 & 2033
- Table 18: North America Shale Market Revenue billion Forecast, by Country 2020 & 2033
- Table 19: North America Shale Market Revenue billion Forecast, by Production Analysis 2020 & 2033
- Table 20: North America Shale Market Revenue billion Forecast, by Consumption Analysis 2020 & 2033
- Table 21: North America Shale Market Revenue billion Forecast, by Import Market Analysis (Value & Volume) 2020 & 2033
- Table 22: North America Shale Market Revenue billion Forecast, by Export Market Analysis (Value & Volume) 2020 & 2033
- Table 23: North America Shale Market Revenue billion Forecast, by Price Trend Analysis 2020 & 2033
- Table 24: North America Shale Market Revenue billion Forecast, by Country 2020 & 2033
Frequently Asked Questions
1. What is the projected Compound Annual Growth Rate (CAGR) of the North America Shale Market?
The projected CAGR is approximately 5.9%.
2. Which companies are prominent players in the North America Shale Market?
Key companies in the market include ExxonMobil, Chevron , Marathon Petroleum , ConocoPhillips , Pioneer Natural Resources.
3. What are the main segments of the North America Shale Market?
The market segments include Production Analysis, Consumption Analysis, Import Market Analysis (Value & Volume), Export Market Analysis (Value & Volume), Price Trend Analysis.
4. Can you provide details about the market size?
The market size is estimated to be USD 88.6 billion as of 2022.
5. What are some drivers contributing to market growth?
4.; Increasing Number of Offshore Operations 4.; Demand Coming for Unconventional Energy Sources.
6. What are the notable trends driving market growth?
Shale Gas to Dominate the Market.
7. Are there any restraints impacting market growth?
4.; Demand for Renewable Energy.
8. Can you provide examples of recent developments in the market?
N/A
9. What pricing options are available for accessing the report?
Pricing options include single-user, multi-user, and enterprise licenses priced at USD 4750, USD 5250, and USD 8750 respectively.
10. Is the market size provided in terms of value or volume?
The market size is provided in terms of value, measured in billion.
11. Are there any specific market keywords associated with the report?
Yes, the market keyword associated with the report is "North America Shale Market," which aids in identifying and referencing the specific market segment covered.
12. How do I determine which pricing option suits my needs best?
The pricing options vary based on user requirements and access needs. Individual users may opt for single-user licenses, while businesses requiring broader access may choose multi-user or enterprise licenses for cost-effective access to the report.
13. Are there any additional resources or data provided in the North America Shale Market report?
While the report offers comprehensive insights, it's advisable to review the specific contents or supplementary materials provided to ascertain if additional resources or data are available.
14. How can I stay updated on further developments or reports in the North America Shale Market?
To stay informed about further developments, trends, and reports in the North America Shale Market, consider subscribing to industry newsletters, following relevant companies and organizations, or regularly checking reputable industry news sources and publications.
Methodology
Step 1 - Identification of Relevant Samples Size from Population Database


Step 2 - Approaches for Defining Global Market Size (Value, Volume* & Price*)

Note*: In applicable scenarios
Step 3 - Data Sources
Primary Research
- Web Analytics
- Survey Reports
- Research Institute
- Latest Research Reports
- Opinion Leaders
Secondary Research
- Annual Reports
- White Paper
- Latest Press Release
- Industry Association
- Paid Database
- Investor Presentations

Step 4 - Data Triangulation
Involves using different sources of information in order to increase the validity of a study
These sources are likely to be stakeholders in a program - participants, other researchers, program staff, other community members, and so on.
Then we put all data in single framework & apply various statistical tools to find out the dynamic on the market.
During the analysis stage, feedback from the stakeholder groups would be compared to determine areas of agreement as well as areas of divergence