

Key Insights
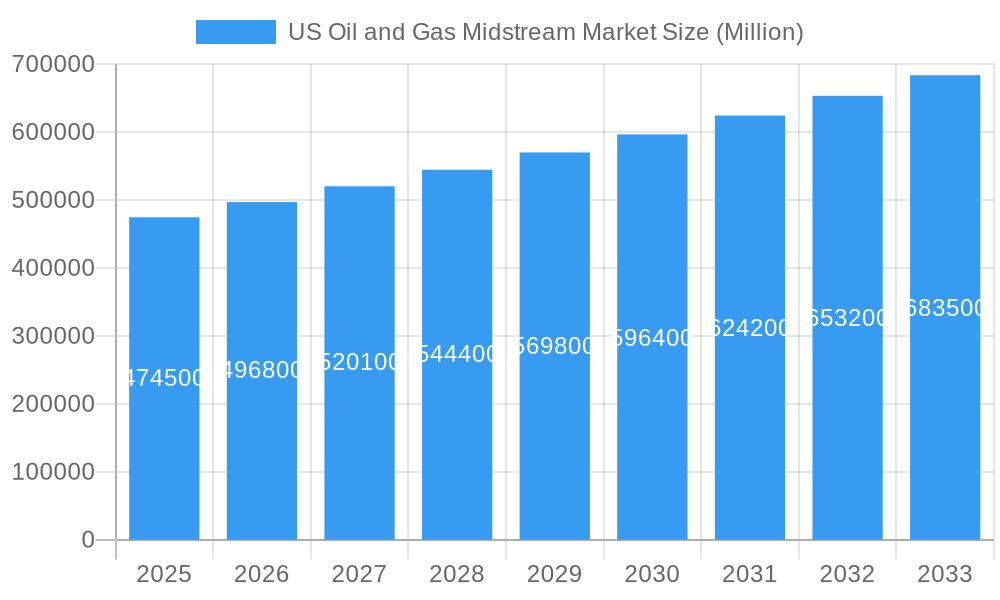
The US oil and gas midstream market is poised for significant expansion, projected to reach $474.5 billion in 2025. This growth is underpinned by a robust CAGR of 4.7% expected from 2025 to 2033. Key drivers fueling this upward trajectory include the increasing demand for natural gas, particularly for power generation and industrial feedstock, coupled with ongoing investments in infrastructure to support domestic production and export capabilities. The logistical network, encompassing transportation pipelines, storage facilities, and LNG terminals, is fundamental to the efficient movement of these resources, and substantial capital is being channeled into modernizing and expanding these critical assets. Furthermore, advancements in technology for leak detection, pipeline integrity, and enhanced operational efficiency are contributing to a more sustainable and reliable midstream sector, attracting further investment.
US Oil and Gas Midstream Market Market Size (In Billion)
The market is segmented across essential components: Transportation, which forms the backbone of the midstream operations; Storage, vital for managing supply-demand fluctuations and ensuring energy security; and LNG Terminals, increasingly crucial for facilitating global trade of liquefied natural gas. While growth is strong, the sector faces certain restraints. These include stringent environmental regulations and permitting processes, which can impact project timelines and costs. Additionally, public perception and concerns regarding pipeline safety and environmental impact necessitate continuous efforts in community engagement and robust safety protocols. Nevertheless, the ongoing energy transition, which still heavily relies on natural gas as a bridge fuel, alongside continued exploration and production activities, ensures a sustained need for a sophisticated and expanding midstream infrastructure across North America, with particular emphasis on the United States.
US Oil and Gas Midstream Market Company Market Share
Gain unparalleled insights into the dynamic US Oil and Gas Midstream Market, a critical sector projected to reach astronomical valuations. This in-depth report provides a holistic overview of market segmentation, growth drivers, industry trends, competitive landscape, and future strategic directions, crucial for stakeholders navigating this complex and evolving industry. With a detailed study period from 2019–2033, a base year of 2025, and a forecast period from 2025–2033, this analysis delivers actionable intelligence for informed decision-making. Discover the impact of key industry developments, understand market concentration, and leverage emerging opportunities in the oil and gas transportation, storage, and LNG terminals sectors.
US Oil and Gas Midstream Market Market Dynamics & Concentration
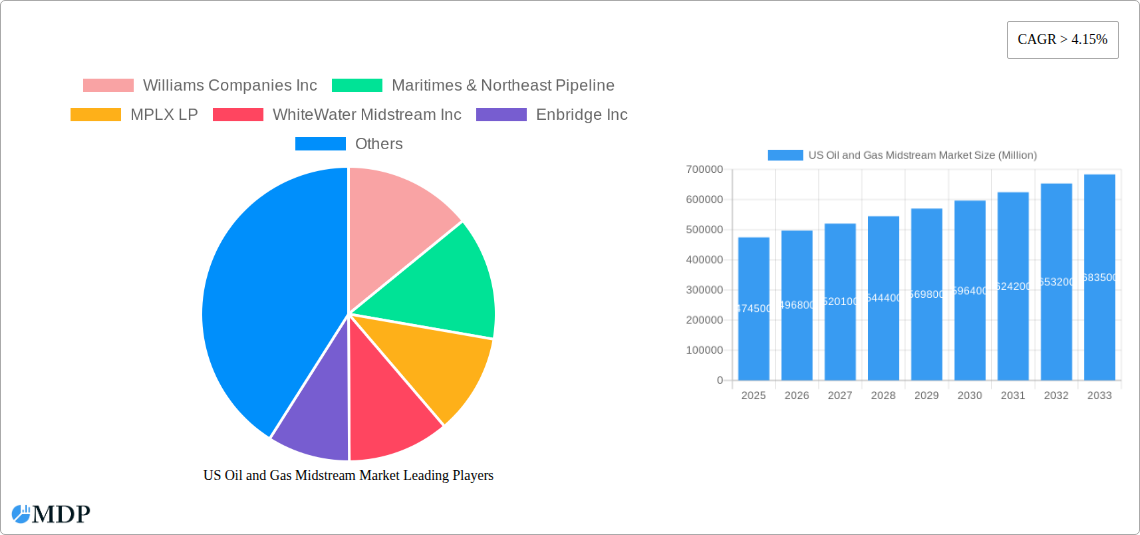
The US oil and gas midstream market is characterized by a moderate concentration of key players, with significant M&A activities shaping its landscape. Major companies like Kinder Morgan Inc., Enterprise Products Partners LP, and Enbridge Inc. hold substantial market share, driving innovation and infrastructure development. Regulatory frameworks, including pipeline safety regulations and environmental policies, play a pivotal role in market dynamics, influencing project approvals and operational costs. Innovation drivers are primarily focused on enhancing efficiency, reducing environmental impact, and expanding network capacity to meet growing energy demands. Product substitutes, though limited in direct pipeline transportation, are explored in the context of alternative energy sources and evolving energy consumption patterns. End-user trends, such as increasing demand for natural gas in power generation and industrial applications, are shaping investment priorities. M&A activities, often driven by strategic consolidation and portfolio optimization, continue to be a significant factor. For instance, the period has witnessed strategic acquisitions aimed at expanding geographic reach and enhancing service offerings. The market share distribution among the top 5 players is estimated to be approximately 65%, with over 50 significant M&A deals recorded throughout the historical period.
US Oil and Gas Midstream Market Industry Trends & Analysis
The US oil and gas midstream market is experiencing robust growth, fueled by escalating domestic energy production and increasing demand for efficient transportation and storage solutions. The projected Compound Annual Growth Rate (CAGR) for the forecast period is approximately 7.5%. Key growth drivers include the shale revolution, which has led to a surge in oil and natural gas extraction, necessitating substantial investment in midstream infrastructure. Technological disruptions are playing a transformative role, with advancements in pipeline monitoring systems, data analytics, and automation enhancing operational safety and efficiency. Consumer preferences are shifting towards cleaner energy sources, driving investment in natural gas infrastructure and LNG export facilities. The competitive dynamics are intense, with established players investing heavily in expanding existing networks and developing new projects to capture market share. Market penetration for advanced pipeline technologies is steadily increasing, contributing to a more resilient and sustainable energy supply chain. The market is witnessing a significant increase in liquefied natural gas (LNG) exports, driven by global demand and the competitive pricing of US natural gas. This trend is spurring the development of new LNG terminals and associated pipeline infrastructure. Furthermore, the growing emphasis on decarbonization and environmental sustainability is prompting midstream companies to explore and invest in carbon capture, utilization, and storage (CCUS) technologies and low-carbon fuel solutions. The integration of digital technologies, such as AI and IoT, is revolutionizing operations, enabling predictive maintenance, real-time monitoring, and optimized logistics.
Leading Markets & Segments in US Oil and Gas Midstream Market
The Transportation segment is the dominant force within the US oil and gas midstream market, commanding an estimated 60% of the total market value. This dominance is propelled by the ever-increasing volumes of crude oil and natural gas produced from prolific shale plays across the nation, requiring extensive pipeline networks for efficient movement to refineries, processing plants, and export terminals. Economic policies supporting domestic energy production and infrastructure development have been instrumental in this segment's growth. The need for reliable and cost-effective transportation of these vast quantities of hydrocarbons is a primary driver.
- Key Drivers for Transportation Dominance:
- Shale Production Boom: Unprecedented levels of crude oil and natural gas extraction necessitate robust pipeline infrastructure.
- Economic Policies: Government incentives and regulatory frameworks encouraging domestic energy production and infrastructure expansion.
- Cost-Effectiveness: Pipelines offer the most economical and efficient mode for transporting large volumes of oil and gas over long distances.
- Growing Export Demand: Increasing global appetite for US-produced oil and natural gas drives the need for pipelines connecting production basins to export facilities.
The Storage segment, estimated to hold approximately 30% of the market share, plays a crucial role in balancing supply and demand, providing flexibility for producers and consumers. Storage facilities, including underground caverns and above-ground tanks, are essential for managing price volatility and ensuring supply security.
- Key Drivers for Storage Growth:
- Market Volatility: The need to store excess production during periods of low demand or price dips.
- Strategic Reserves: Maintaining strategic petroleum reserves for energy security.
- Processing and Distribution Hubs: Storage is integral to hubs where multiple pipelines converge for processing and distribution.
The LNG Terminals segment, while currently representing a smaller but rapidly growing portion of the market (around 10%), is a significant area of investment and strategic importance, particularly for exports. The increasing global demand for liquefied natural gas, driven by energy transition initiatives and the need for reliable gas supplies, is spurring massive investment in liquefaction and regasification terminals.
- Key Drivers for LNG Terminals Expansion:
- Global LNG Demand: Rising international demand for natural gas as a cleaner alternative to coal.
- US Export Competitiveness: Competitive pricing of US natural gas makes it attractive for global markets.
- Energy Security: LNG provides countries with greater energy independence and diversification of supply.
- Strategic Partnerships: Long-term sale and purchase agreements (SPAs) securing export volumes.
US Oil and Gas Midstream Market Product Developments
Recent product developments in the US oil and gas midstream market are centered around enhancing operational efficiency, safety, and environmental sustainability. Innovations in pipeline integrity management, including advanced leak detection technologies and predictive maintenance systems, are gaining traction. The deployment of digital twins and AI-powered analytics is optimizing flow rates and reducing energy consumption. Furthermore, there is a growing focus on developing infrastructure for transporting lower-carbon fuels, such as hydrogen and captured CO2, showcasing a commitment to adapting to evolving energy landscapes and offering competitive advantages in a rapidly changing market.
Key Drivers of US Oil and Gas Midstream Market Growth
The US oil and gas midstream market's growth is propelled by several critical factors. The sustained high levels of domestic crude oil and natural gas production, particularly from shale formations, create an ongoing demand for robust transportation and storage infrastructure. Technological advancements, such as improved drilling techniques and enhanced oil recovery (EOR) methods, continue to unlock new reserves, thereby fueling the need for expanded midstream capacity. Favorable economic policies and government support for energy infrastructure development provide a conducive environment for investment and project execution. Moreover, the increasing global demand for U.S. liquefied natural gas (LNG) is a significant catalyst for the construction and expansion of LNG export terminals and associated pipeline infrastructure.
Challenges in the US Oil and Gas Midstream Market Market
Despite robust growth, the US oil and gas midstream market faces significant challenges. Stringent environmental regulations and permitting processes can lead to project delays and increased costs, impacting the pace of infrastructure development. Public opposition and environmental activism can also create hurdles for new pipeline projects. Supply chain disruptions and labor shortages, exacerbated by geopolitical events and economic fluctuations, can affect project timelines and operational efficiency. Furthermore, the increasing competition from alternative energy sources and the long-term transition towards a lower-carbon economy pose strategic challenges for future investments and business models. The cost of capital for new projects remains a critical factor, influenced by market sentiment and regulatory certainty, estimated at an average of 6-8% for debt financing.
Emerging Opportunities in US Oil and Gas Midstream Market
Emerging opportunities in the US oil and gas midstream market are diverse and significant. The growing global demand for LNG presents a substantial opportunity for expanding liquefaction capacity and associated export infrastructure. The ongoing energy transition is also creating a market for midstream infrastructure capable of transporting and storing low-carbon fuels, such as hydrogen and biofuels. Investments in carbon capture, utilization, and storage (CCUS) technologies offer a pathway for midstream companies to support decarbonization efforts and develop new revenue streams. Furthermore, the modernization and optimization of existing pipeline networks through digital transformation and the implementation of advanced technologies present opportunities for efficiency gains and enhanced safety. Strategic partnerships and joint ventures are crucial for leveraging these opportunities and sharing risks in large-scale projects, with over $50 billion in potential investment in new LNG export capacity over the next decade.
Leading Players in the US Oil and Gas Midstream Market Sector
- Williams Companies Inc
- Maritimes & Northeast Pipeline
- MPLX LP
- WhiteWater Midstream Inc
- Enbridge Inc
- Atlantic Coast Pipeline
- Enterprise Products Partners LP
- Energy Transfer Operating LP
- ONEOK Gas Transportation LLC
- Plains All American Pipeline LP
- Kinder Morgan Inc
Key Milestones in US Oil and Gas Midstream Market Industry
- March 2022: New Fortress Energy Inc. announced the execution of two 20-year sale and purchase agreements (SPA) with Venture Global LNG. Under the agreement, Venture Global will supply 2 million tonnes per annum (MTPA) of LNG on a free on board (FOB) basis from its LNG facilities in Louisiana. This agreement underscores the growing importance of U.S. LNG exports and the continued investment in associated infrastructure.
- November 2020: The Saginaw Trail Pipeline, a Consumer Energy interstate project replacing and expanding pipelines and other infrastructure, entered service with 200 MMcf/d (5.66 MMcm/d) of capacity in the central Michigan counties of Saginaw, Genesse, and Oakland. This project exemplifies the ongoing investment in modernizing and expanding natural gas pipeline networks to meet regional demand and enhance supply reliability.
Strategic Outlook for US Oil and Gas Midstream Market Market
The strategic outlook for the US oil and gas midstream market remains exceptionally strong, driven by sustained domestic energy production and increasing global demand for U.S. hydrocarbons, particularly natural gas. The ongoing expansion of LNG export capacity is a key growth accelerator, positioning the U.S. as a pivotal player in global energy markets. Midstream companies are strategically focused on optimizing existing assets, investing in new pipeline infrastructure to connect burgeoning production basins to demand centers, and diversifying their portfolios to include low-carbon energy solutions. The integration of digital technologies and a continued commitment to environmental, social, and governance (ESG) principles will be crucial for long-term success and stakeholder value creation. The market is projected to see continued capital investment in excess of $100 billion over the forecast period, focusing on infrastructure expansion, modernization, and the development of new energy logistics solutions.
US Oil and Gas Midstream Market Segmentation
- 1. Transportation
- 2. Storage
- 3. LNG Terminals
US Oil and Gas Midstream Market Segmentation By Geography
-
1. North America
- 1.1. United States
- 1.2. Canada
- 1.3. Mexico
-
2. South America
- 2.1. Brazil
- 2.2. Argentina
- 2.3. Rest of South America
-
3. Europe
- 3.1. United Kingdom
- 3.2. Germany
- 3.3. France
- 3.4. Italy
- 3.5. Spain
- 3.6. Russia
- 3.7. Benelux
- 3.8. Nordics
- 3.9. Rest of Europe
-
4. Middle East & Africa
- 4.1. Turkey
- 4.2. Israel
- 4.3. GCC
- 4.4. North Africa
- 4.5. South Africa
- 4.6. Rest of Middle East & Africa
-
5. Asia Pacific
- 5.1. China
- 5.2. India
- 5.3. Japan
- 5.4. South Korea
- 5.5. ASEAN
- 5.6. Oceania
- 5.7. Rest of Asia Pacific
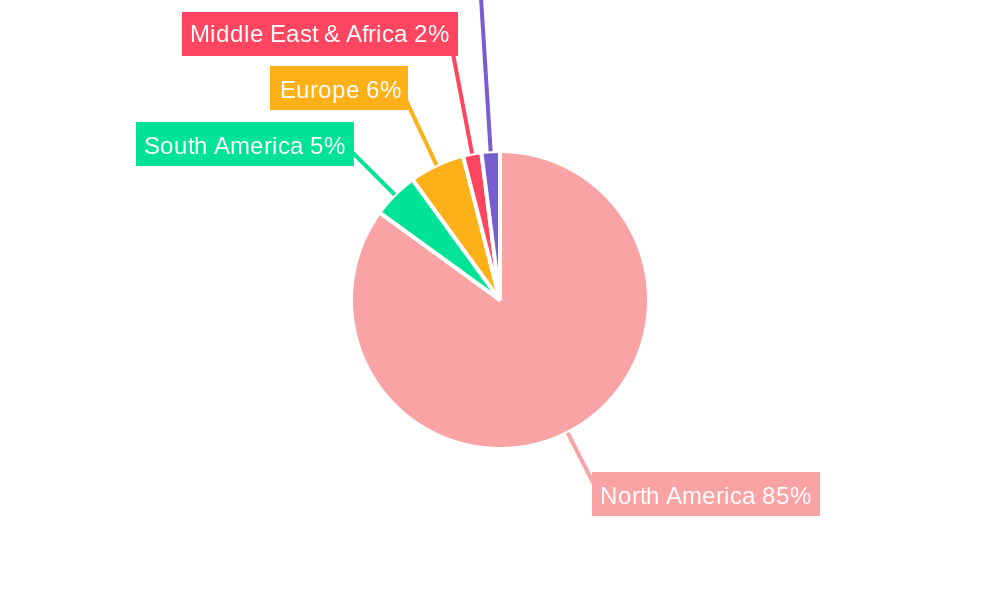
US Oil and Gas Midstream Market Regional Market Share
Geographic Coverage of US Oil and Gas Midstream Market
US Oil and Gas Midstream Market REPORT HIGHLIGHTS
| Aspects | Details |
|---|---|
| Study Period | 2020-2034 |
| Base Year | 2025 |
| Estimated Year | 2026 |
| Forecast Period | 2026-2034 |
| Historical Period | 2020-2025 |
| Growth Rate | CAGR of 3.2% from 2020-2034 |
| Segmentation |
|
Table of Contents
- 1. Introduction
- 1.1. Research Scope
- 1.2. Market Segmentation
- 1.3. Research Objective
- 1.4. Definitions and Assumptions
- 2. Executive Summary
- 2.1. Market Snapshot
- 3. Market Dynamics
- 3.1. Market Drivers
- 3.2. Market Restrains
- 3.3. Market Trends
- 3.4. Market Opportunities
- 4. Market Factor Analysis
- 4.1. Porters Five Forces
- 4.1.1. Bargaining Power of Suppliers
- 4.1.2. Bargaining Power of Buyers
- 4.1.3. Threat of New Entrants
- 4.1.4. Threat of Substitutes
- 4.1.5. Competitive Rivalry
- 4.2. PESTEL analysis
- 4.3. BCG Analysis
- 4.3.1. Stars (High Growth, High Market Share)
- 4.3.2. Cash Cows (Low Growth, High Market Share)
- 4.3.3. Question Mark (High Growth, Low Market Share)
- 4.3.4. Dogs (Low Growth, Low Market Share)
- 4.4. Ansoff Matrix Analysis
- 4.5. Supply Chain Analysis
- 4.6. Regulatory Landscape
- 4.7. Current Market Potential and Opportunity Assessment (TAM–SAM–SOM Framework)
- 4.8. MDP Analyst Note
- 4.1. Porters Five Forces
- 5. Market Analysis, Insights and Forecast 2021-2033
- 5.1. Market Analysis, Insights and Forecast - by Transportation
- 5.2. Market Analysis, Insights and Forecast - by Storage
- 5.3. Market Analysis, Insights and Forecast - by LNG Terminals
- 5.4. Market Analysis, Insights and Forecast - by Region
- 5.4.1. North America
- 5.4.2. South America
- 5.4.3. Europe
- 5.4.4. Middle East & Africa
- 5.4.5. Asia Pacific
- 6. Global US Oil and Gas Midstream Market Analysis, Insights and Forecast, 2021-2033
- 6.1. Market Analysis, Insights and Forecast - by Transportation
- 6.2. Market Analysis, Insights and Forecast - by Storage
- 6.3. Market Analysis, Insights and Forecast - by LNG Terminals
- 7. North America US Oil and Gas Midstream Market Analysis, Insights and Forecast, 2020-2032
- 7.1. Market Analysis, Insights and Forecast - by Transportation
- 7.2. Market Analysis, Insights and Forecast - by Storage
- 7.3. Market Analysis, Insights and Forecast - by LNG Terminals
- 8. South America US Oil and Gas Midstream Market Analysis, Insights and Forecast, 2020-2032
- 8.1. Market Analysis, Insights and Forecast - by Transportation
- 8.2. Market Analysis, Insights and Forecast - by Storage
- 8.3. Market Analysis, Insights and Forecast - by LNG Terminals
- 9. Europe US Oil and Gas Midstream Market Analysis, Insights and Forecast, 2020-2032
- 9.1. Market Analysis, Insights and Forecast - by Transportation
- 9.2. Market Analysis, Insights and Forecast - by Storage
- 9.3. Market Analysis, Insights and Forecast - by LNG Terminals
- 10. Middle East & Africa US Oil and Gas Midstream Market Analysis, Insights and Forecast, 2020-2032
- 10.1. Market Analysis, Insights and Forecast - by Transportation
- 10.2. Market Analysis, Insights and Forecast - by Storage
- 10.3. Market Analysis, Insights and Forecast - by LNG Terminals
- 11. Asia Pacific US Oil and Gas Midstream Market Analysis, Insights and Forecast, 2020-2032
- 11.1. Market Analysis, Insights and Forecast - by Transportation
- 11.2. Market Analysis, Insights and Forecast - by Storage
- 11.3. Market Analysis, Insights and Forecast - by LNG Terminals
- 12. Competitive Analysis
- 12.1. Company Profiles
- 12.1.1 Williams Companies Inc
- 12.1.1.1. Company Overview
- 12.1.1.2. Products
- 12.1.1.3. Company Financials
- 12.1.1.4. SWOT Analysis
- 12.1.2 Maritimes & Northeast Pipeline
- 12.1.2.1. Company Overview
- 12.1.2.2. Products
- 12.1.2.3. Company Financials
- 12.1.2.4. SWOT Analysis
- 12.1.3 MPLX LP
- 12.1.3.1. Company Overview
- 12.1.3.2. Products
- 12.1.3.3. Company Financials
- 12.1.3.4. SWOT Analysis
- 12.1.4 WhiteWater Midstream Inc
- 12.1.4.1. Company Overview
- 12.1.4.2. Products
- 12.1.4.3. Company Financials
- 12.1.4.4. SWOT Analysis
- 12.1.5 Enbridge Inc
- 12.1.5.1. Company Overview
- 12.1.5.2. Products
- 12.1.5.3. Company Financials
- 12.1.5.4. SWOT Analysis
- 12.1.6 Atlantic Coast Pipeline
- 12.1.6.1. Company Overview
- 12.1.6.2. Products
- 12.1.6.3. Company Financials
- 12.1.6.4. SWOT Analysis
- 12.1.7 Enterprise Products Partners LP
- 12.1.7.1. Company Overview
- 12.1.7.2. Products
- 12.1.7.3. Company Financials
- 12.1.7.4. SWOT Analysis
- 12.1.8 Energy Transfer Operating LP
- 12.1.8.1. Company Overview
- 12.1.8.2. Products
- 12.1.8.3. Company Financials
- 12.1.8.4. SWOT Analysis
- 12.1.9 ONEOK Gas Transportation LLC
- 12.1.9.1. Company Overview
- 12.1.9.2. Products
- 12.1.9.3. Company Financials
- 12.1.9.4. SWOT Analysis
- 12.1.10 Plains All American Pipeline LP
- 12.1.10.1. Company Overview
- 12.1.10.2. Products
- 12.1.10.3. Company Financials
- 12.1.10.4. SWOT Analysis
- 12.1.11 Kinder Morgan Inc
- 12.1.11.1. Company Overview
- 12.1.11.2. Products
- 12.1.11.3. Company Financials
- 12.1.11.4. SWOT Analysis
- 12.1.1 Williams Companies Inc
- 12.2. Market Entropy
- 12.2.1 Company's Key Areas Served
- 12.2.2 Recent Developments
- 12.3. Company Market Share Analysis 2025
- 12.3.1 Top 5 Companies Market Share Analysis
- 12.3.2 Top 3 Companies Market Share Analysis
- 12.4. List of Potential Customers
- 13. Research Methodology
List of Figures
- Figure 1: Global US Oil and Gas Midstream Market Revenue Breakdown (billion, %) by Region 2025 & 2033
- Figure 2: North America US Oil and Gas Midstream Market Revenue (billion), by Transportation 2025 & 2033
- Figure 3: North America US Oil and Gas Midstream Market Revenue Share (%), by Transportation 2025 & 2033
- Figure 4: North America US Oil and Gas Midstream Market Revenue (billion), by Storage 2025 & 2033
- Figure 5: North America US Oil and Gas Midstream Market Revenue Share (%), by Storage 2025 & 2033
- Figure 6: North America US Oil and Gas Midstream Market Revenue (billion), by LNG Terminals 2025 & 2033
- Figure 7: North America US Oil and Gas Midstream Market Revenue Share (%), by LNG Terminals 2025 & 2033
- Figure 8: North America US Oil and Gas Midstream Market Revenue (billion), by Country 2025 & 2033
- Figure 9: North America US Oil and Gas Midstream Market Revenue Share (%), by Country 2025 & 2033
- Figure 10: South America US Oil and Gas Midstream Market Revenue (billion), by Transportation 2025 & 2033
- Figure 11: South America US Oil and Gas Midstream Market Revenue Share (%), by Transportation 2025 & 2033
- Figure 12: South America US Oil and Gas Midstream Market Revenue (billion), by Storage 2025 & 2033
- Figure 13: South America US Oil and Gas Midstream Market Revenue Share (%), by Storage 2025 & 2033
- Figure 14: South America US Oil and Gas Midstream Market Revenue (billion), by LNG Terminals 2025 & 2033
- Figure 15: South America US Oil and Gas Midstream Market Revenue Share (%), by LNG Terminals 2025 & 2033
- Figure 16: South America US Oil and Gas Midstream Market Revenue (billion), by Country 2025 & 2033
- Figure 17: South America US Oil and Gas Midstream Market Revenue Share (%), by Country 2025 & 2033
- Figure 18: Europe US Oil and Gas Midstream Market Revenue (billion), by Transportation 2025 & 2033
- Figure 19: Europe US Oil and Gas Midstream Market Revenue Share (%), by Transportation 2025 & 2033
- Figure 20: Europe US Oil and Gas Midstream Market Revenue (billion), by Storage 2025 & 2033
- Figure 21: Europe US Oil and Gas Midstream Market Revenue Share (%), by Storage 2025 & 2033
- Figure 22: Europe US Oil and Gas Midstream Market Revenue (billion), by LNG Terminals 2025 & 2033
- Figure 23: Europe US Oil and Gas Midstream Market Revenue Share (%), by LNG Terminals 2025 & 2033
- Figure 24: Europe US Oil and Gas Midstream Market Revenue (billion), by Country 2025 & 2033
- Figure 25: Europe US Oil and Gas Midstream Market Revenue Share (%), by Country 2025 & 2033
- Figure 26: Middle East & Africa US Oil and Gas Midstream Market Revenue (billion), by Transportation 2025 & 2033
- Figure 27: Middle East & Africa US Oil and Gas Midstream Market Revenue Share (%), by Transportation 2025 & 2033
- Figure 28: Middle East & Africa US Oil and Gas Midstream Market Revenue (billion), by Storage 2025 & 2033
- Figure 29: Middle East & Africa US Oil and Gas Midstream Market Revenue Share (%), by Storage 2025 & 2033
- Figure 30: Middle East & Africa US Oil and Gas Midstream Market Revenue (billion), by LNG Terminals 2025 & 2033
- Figure 31: Middle East & Africa US Oil and Gas Midstream Market Revenue Share (%), by LNG Terminals 2025 & 2033
- Figure 32: Middle East & Africa US Oil and Gas Midstream Market Revenue (billion), by Country 2025 & 2033
- Figure 33: Middle East & Africa US Oil and Gas Midstream Market Revenue Share (%), by Country 2025 & 2033
- Figure 34: Asia Pacific US Oil and Gas Midstream Market Revenue (billion), by Transportation 2025 & 2033
- Figure 35: Asia Pacific US Oil and Gas Midstream Market Revenue Share (%), by Transportation 2025 & 2033
- Figure 36: Asia Pacific US Oil and Gas Midstream Market Revenue (billion), by Storage 2025 & 2033
- Figure 37: Asia Pacific US Oil and Gas Midstream Market Revenue Share (%), by Storage 2025 & 2033
- Figure 38: Asia Pacific US Oil and Gas Midstream Market Revenue (billion), by LNG Terminals 2025 & 2033
- Figure 39: Asia Pacific US Oil and Gas Midstream Market Revenue Share (%), by LNG Terminals 2025 & 2033
- Figure 40: Asia Pacific US Oil and Gas Midstream Market Revenue (billion), by Country 2025 & 2033
- Figure 41: Asia Pacific US Oil and Gas Midstream Market Revenue Share (%), by Country 2025 & 2033
List of Tables
- Table 1: Global US Oil and Gas Midstream Market Revenue billion Forecast, by Transportation 2020 & 2033
- Table 2: Global US Oil and Gas Midstream Market Revenue billion Forecast, by Storage 2020 & 2033
- Table 3: Global US Oil and Gas Midstream Market Revenue billion Forecast, by LNG Terminals 2020 & 2033
- Table 4: Global US Oil and Gas Midstream Market Revenue billion Forecast, by Region 2020 & 2033
- Table 5: Global US Oil and Gas Midstream Market Revenue billion Forecast, by Transportation 2020 & 2033
- Table 6: Global US Oil and Gas Midstream Market Revenue billion Forecast, by Storage 2020 & 2033
- Table 7: Global US Oil and Gas Midstream Market Revenue billion Forecast, by LNG Terminals 2020 & 2033
- Table 8: Global US Oil and Gas Midstream Market Revenue billion Forecast, by Country 2020 & 2033
- Table 9: United States US Oil and Gas Midstream Market Revenue (billion) Forecast, by Application 2020 & 2033
- Table 10: Canada US Oil and Gas Midstream Market Revenue (billion) Forecast, by Application 2020 & 2033
- Table 11: Mexico US Oil and Gas Midstream Market Revenue (billion) Forecast, by Application 2020 & 2033
- Table 12: Global US Oil and Gas Midstream Market Revenue billion Forecast, by Transportation 2020 & 2033
- Table 13: Global US Oil and Gas Midstream Market Revenue billion Forecast, by Storage 2020 & 2033
- Table 14: Global US Oil and Gas Midstream Market Revenue billion Forecast, by LNG Terminals 2020 & 2033
- Table 15: Global US Oil and Gas Midstream Market Revenue billion Forecast, by Country 2020 & 2033
- Table 16: Brazil US Oil and Gas Midstream Market Revenue (billion) Forecast, by Application 2020 & 2033
- Table 17: Argentina US Oil and Gas Midstream Market Revenue (billion) Forecast, by Application 2020 & 2033
- Table 18: Rest of South America US Oil and Gas Midstream Market Revenue (billion) Forecast, by Application 2020 & 2033
- Table 19: Global US Oil and Gas Midstream Market Revenue billion Forecast, by Transportation 2020 & 2033
- Table 20: Global US Oil and Gas Midstream Market Revenue billion Forecast, by Storage 2020 & 2033
- Table 21: Global US Oil and Gas Midstream Market Revenue billion Forecast, by LNG Terminals 2020 & 2033
- Table 22: Global US Oil and Gas Midstream Market Revenue billion Forecast, by Country 2020 & 2033
- Table 23: United Kingdom US Oil and Gas Midstream Market Revenue (billion) Forecast, by Application 2020 & 2033
- Table 24: Germany US Oil and Gas Midstream Market Revenue (billion) Forecast, by Application 2020 & 2033
- Table 25: France US Oil and Gas Midstream Market Revenue (billion) Forecast, by Application 2020 & 2033
- Table 26: Italy US Oil and Gas Midstream Market Revenue (billion) Forecast, by Application 2020 & 2033
- Table 27: Spain US Oil and Gas Midstream Market Revenue (billion) Forecast, by Application 2020 & 2033
- Table 28: Russia US Oil and Gas Midstream Market Revenue (billion) Forecast, by Application 2020 & 2033
- Table 29: Benelux US Oil and Gas Midstream Market Revenue (billion) Forecast, by Application 2020 & 2033
- Table 30: Nordics US Oil and Gas Midstream Market Revenue (billion) Forecast, by Application 2020 & 2033
- Table 31: Rest of Europe US Oil and Gas Midstream Market Revenue (billion) Forecast, by Application 2020 & 2033
- Table 32: Global US Oil and Gas Midstream Market Revenue billion Forecast, by Transportation 2020 & 2033
- Table 33: Global US Oil and Gas Midstream Market Revenue billion Forecast, by Storage 2020 & 2033
- Table 34: Global US Oil and Gas Midstream Market Revenue billion Forecast, by LNG Terminals 2020 & 2033
- Table 35: Global US Oil and Gas Midstream Market Revenue billion Forecast, by Country 2020 & 2033
- Table 36: Turkey US Oil and Gas Midstream Market Revenue (billion) Forecast, by Application 2020 & 2033
- Table 37: Israel US Oil and Gas Midstream Market Revenue (billion) Forecast, by Application 2020 & 2033
- Table 38: GCC US Oil and Gas Midstream Market Revenue (billion) Forecast, by Application 2020 & 2033
- Table 39: North Africa US Oil and Gas Midstream Market Revenue (billion) Forecast, by Application 2020 & 2033
- Table 40: South Africa US Oil and Gas Midstream Market Revenue (billion) Forecast, by Application 2020 & 2033
- Table 41: Rest of Middle East & Africa US Oil and Gas Midstream Market Revenue (billion) Forecast, by Application 2020 & 2033
- Table 42: Global US Oil and Gas Midstream Market Revenue billion Forecast, by Transportation 2020 & 2033
- Table 43: Global US Oil and Gas Midstream Market Revenue billion Forecast, by Storage 2020 & 2033
- Table 44: Global US Oil and Gas Midstream Market Revenue billion Forecast, by LNG Terminals 2020 & 2033
- Table 45: Global US Oil and Gas Midstream Market Revenue billion Forecast, by Country 2020 & 2033
- Table 46: China US Oil and Gas Midstream Market Revenue (billion) Forecast, by Application 2020 & 2033
- Table 47: India US Oil and Gas Midstream Market Revenue (billion) Forecast, by Application 2020 & 2033
- Table 48: Japan US Oil and Gas Midstream Market Revenue (billion) Forecast, by Application 2020 & 2033
- Table 49: South Korea US Oil and Gas Midstream Market Revenue (billion) Forecast, by Application 2020 & 2033
- Table 50: ASEAN US Oil and Gas Midstream Market Revenue (billion) Forecast, by Application 2020 & 2033
- Table 51: Oceania US Oil and Gas Midstream Market Revenue (billion) Forecast, by Application 2020 & 2033
- Table 52: Rest of Asia Pacific US Oil and Gas Midstream Market Revenue (billion) Forecast, by Application 2020 & 2033
Frequently Asked Questions
1. What is the projected Compound Annual Growth Rate (CAGR) of the US Oil and Gas Midstream Market?
The projected CAGR is approximately 3.2%.
2. Which companies are prominent players in the US Oil and Gas Midstream Market?
Key companies in the market include Williams Companies Inc, Maritimes & Northeast Pipeline, MPLX LP, WhiteWater Midstream Inc, Enbridge Inc, Atlantic Coast Pipeline, Enterprise Products Partners LP, Energy Transfer Operating LP, ONEOK Gas Transportation LLC, Plains All American Pipeline LP, Kinder Morgan Inc.
3. What are the main segments of the US Oil and Gas Midstream Market?
The market segments include Transportation, Storage, LNG Terminals.
4. Can you provide details about the market size?
The market size is estimated to be USD 34 billion as of 2022.
5. What are some drivers contributing to market growth?
An Increase in the Use of LNG as an Energy Source.
6. What are the notable trends driving market growth?
The Transportation Segment Expected to Dominate the Market.
7. Are there any restraints impacting market growth?
Increasing Adoption of Solar and Wind Energy.
8. Can you provide examples of recent developments in the market?
In March 2022, New Fortress Energy Inc. announced the execution of two 20-year sale and purchase agreements (SPA) with Venture Global LNG. Under the agreement, Venture Global will supply 2 million tonnes per annum (MTPA) of LNG on a free on board (FOB) basis from its LNG facilities in Louisiana.
9. What pricing options are available for accessing the report?
Pricing options include single-user, multi-user, and enterprise licenses priced at USD 3800, USD 4500, and USD 5800 respectively.
10. Is the market size provided in terms of value or volume?
The market size is provided in terms of value, measured in billion.
11. Are there any specific market keywords associated with the report?
Yes, the market keyword associated with the report is "US Oil and Gas Midstream Market," which aids in identifying and referencing the specific market segment covered.
12. How do I determine which pricing option suits my needs best?
The pricing options vary based on user requirements and access needs. Individual users may opt for single-user licenses, while businesses requiring broader access may choose multi-user or enterprise licenses for cost-effective access to the report.
13. Are there any additional resources or data provided in the US Oil and Gas Midstream Market report?
While the report offers comprehensive insights, it's advisable to review the specific contents or supplementary materials provided to ascertain if additional resources or data are available.
14. How can I stay updated on further developments or reports in the US Oil and Gas Midstream Market?
To stay informed about further developments, trends, and reports in the US Oil and Gas Midstream Market, consider subscribing to industry newsletters, following relevant companies and organizations, or regularly checking reputable industry news sources and publications.
Methodology
Step 1 - Identification of Relevant Samples Size from Population Database


Step 2 - Approaches for Defining Global Market Size (Value, Volume* & Price*)

Note*: In applicable scenarios
Step 3 - Data Sources
Primary Research
- Web Analytics
- Survey Reports
- Research Institute
- Latest Research Reports
- Opinion Leaders
Secondary Research
- Annual Reports
- White Paper
- Latest Press Release
- Industry Association
- Paid Database
- Investor Presentations

Step 4 - Data Triangulation
Involves using different sources of information in order to increase the validity of a study
These sources are likely to be stakeholders in a program - participants, other researchers, program staff, other community members, and so on.
Then we put all data in single framework & apply various statistical tools to find out the dynamic on the market.
During the analysis stage, feedback from the stakeholder groups would be compared to determine areas of agreement as well as areas of divergence