

Key Insights
The global Polycrystalline Diamond Compact (PDC) drill bits market is projected to reach $972.74 million by 2025, expanding at a CAGR of 5.62%. This growth is propelled by increasing global energy demand and advancements in drilling technologies, enhancing the efficiency and durability of PDC bits. Their superior performance in diverse geological formations minimizes drilling time and operational costs, making them essential for onshore and offshore operations. Continued exploration in challenging environments and innovations in bit design further support market expansion.
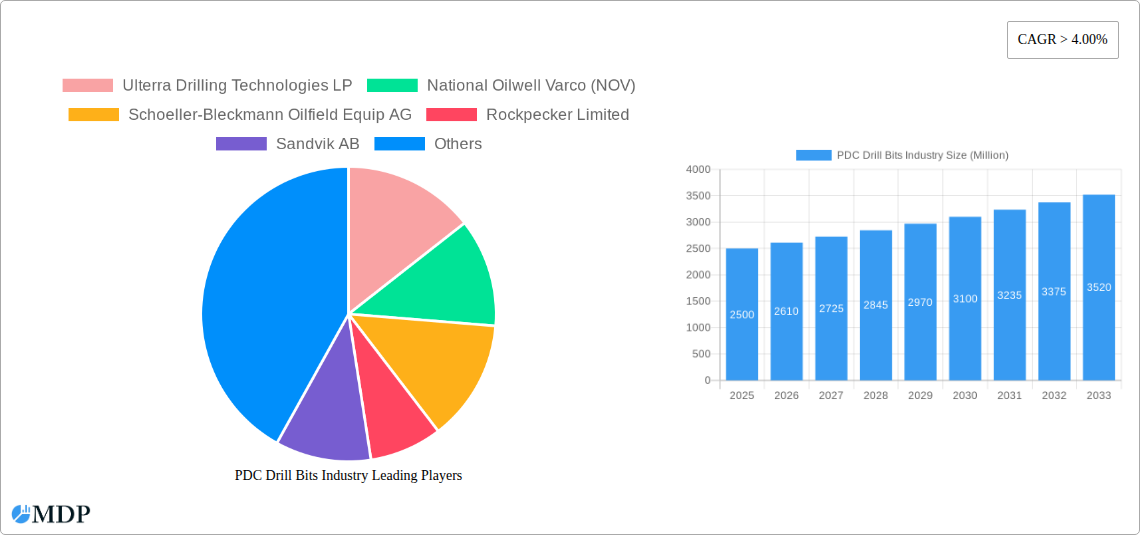
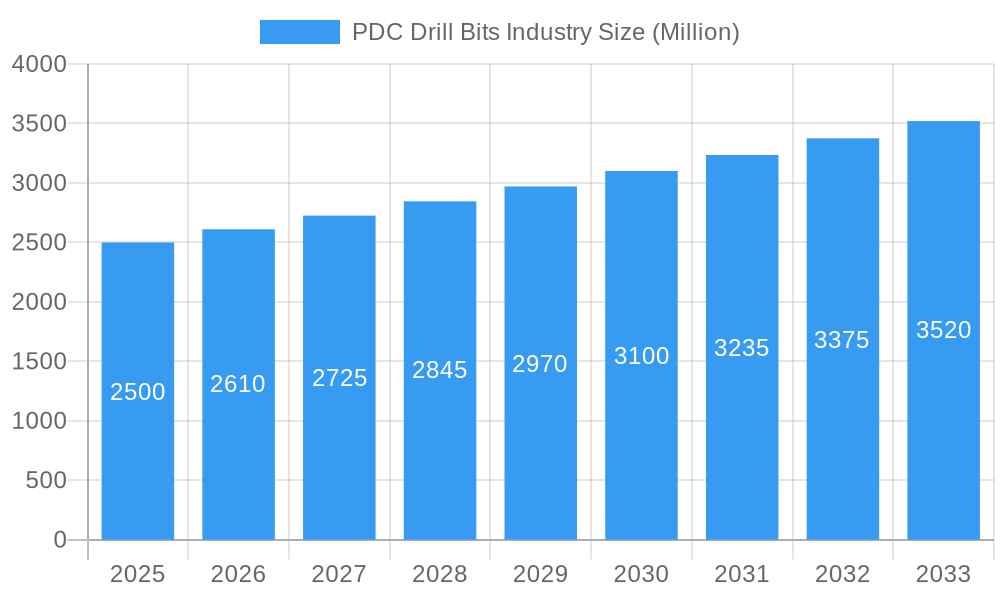
PDC Drill Bits Industry Market Size (In Million)
Key market drivers include the demand for efficient, cost-effective drilling solutions. While oil price volatility and geopolitical factors may present challenges, the inherent abrasion resistance and thermal stability of PDC drill bits ensure their continued market leadership. Major segments are Matrix Body and Steel Body types. Geographically, North America leads due to substantial oil and gas reserves and advanced infrastructure, with the Middle East and Asia Pacific regions showing significant growth from increased exploration. Industry leaders like Halliburton Company, Schlumberger Limited, and Baker Hughes Company are investing in R&D for next-generation PDC drill bits.
PDC Drill Bits Industry Company Market Share
PDC Drill Bits Industry: Market Analysis and Growth Forecast (2019-2033)
This comprehensive report offers an in-depth analysis of the global Polycrystalline Diamond Compact (PDC) Drill Bits industry. Spanning the historical period of 2019–2024, the base year of 2025, and a robust forecast period extending to 2033, this study provides critical insights for industry stakeholders, including manufacturers, suppliers, investors, and end-users. We delve into market dynamics, segment-specific growth, technological advancements, key players, and strategic opportunities, all designed to equip you with actionable intelligence for navigating this dynamic sector.
PDC Drill Bits Industry Market Dynamics & Concentration
The PDC Drill Bits industry exhibits a moderate to high market concentration, with a significant portion of the market share held by a few prominent global players. Key innovation drivers include the relentless pursuit of enhanced drilling efficiency, increased durability, and reduced operational costs in challenging geological formations. Regulatory frameworks, particularly concerning environmental impact and safety standards in oil and gas exploration, influence product development and market entry. Product substitutes, while existing, face limitations in matching the performance and cost-effectiveness of PDC bits in many high-demand applications. End-user trends are increasingly focused on digital integration for real-time performance monitoring and predictive maintenance, driving demand for "smart" drill bits. Mergers and acquisitions (M&A) activities have been a consistent feature, aimed at consolidating market position, acquiring advanced technologies, and expanding geographic reach. For instance, during the historical period, an estimated 5 major M&A deals were observed, with deal values potentially reaching hundreds of millions of dollars, indicating strategic consolidation. Market share analysis reveals that the top 3 companies collectively command over 60% of the global market.
PDC Drill Bits Industry Industry Trends & Analysis
The PDC Drill Bits industry is poised for significant growth, driven by an anticipated Compound Annual Growth Rate (CAGR) of approximately 6.5% from 2025 to 2033. This upward trajectory is propelled by several key market growth drivers. The continued global demand for oil and gas, despite the energy transition, necessitates efficient extraction methods, making PDC drill bits indispensable. Technological disruptions are at the forefront, with advancements in diamond synthesis, substrate materials, and bit design leading to improved performance metrics such as higher Rate of Penetration (ROP) and extended bit life. Consumer preferences are evolving towards solutions that offer greater reliability, reduced downtime, and enhanced safety, pushing manufacturers to invest heavily in research and development. Competitive dynamics are characterized by intense innovation, price sensitivity in certain market segments, and a growing emphasis on customized solutions for specific well conditions. Market penetration is high in established oil and gas regions, with emerging markets offering substantial untapped potential. For example, advancements in bit geometry and cutter technology have led to a projected increase in average bit lifespan by 15% over the forecast period, directly impacting operational costs for exploration companies. The increasing complexity of drilling operations, including deepwater and unconventional resource extraction, further fuels the demand for high-performance PDC drill bits.
Leading Markets & Segments in PDC Drill Bits Industry
North America currently stands as the dominant region in the PDC Drill Bits industry, driven by its extensive onshore oil and gas production activities, particularly in shale formations. The United States, specifically, represents a significant market due to its mature and technologically advanced exploration and production sector.
Dominant Segment by Type: The Steel Body PDC drill bit segment is projected to maintain its lead due to its robustness and widespread application in various drilling environments.
- Key Drivers: Cost-effectiveness, established manufacturing infrastructure, and proven performance in a wide range of formations are critical factors supporting the dominance of steel body bits.
- Detailed Dominance Analysis: Steel body bits offer a balance of strength and affordability, making them the go-to choice for many conventional drilling operations. Their manufacturing process is well-established, ensuring consistent quality and supply. The integration of advanced cutter technology onto steel bodies further enhances their performance, allowing them to compete effectively even in more demanding applications.
Dominant Segment by Location of Deployment: Onshore drilling continues to be the primary driver for PDC drill bit consumption.
- Key Drivers: The sheer volume of onshore exploration and production activities globally, coupled with the economic viability of onshore operations, makes this segment the largest.
- Detailed Dominance Analysis: Onshore drilling encompasses a vast array of geological conditions and operational scales, from shallow wells to deep, complex formations. The extensive network of oil and gas fields on land, particularly in regions like North America, the Middle East, and parts of Asia, necessitates a continuous supply of PDC drill bits. Advancements in directional drilling and hydraulic fracturing technologies further amplify the demand for specialized onshore PDC bits.
PDC Drill Bits Industry Product Developments
Recent product developments in the PDC drill bits industry are focused on enhancing bit durability, ROP, and precision in complex drilling environments. Innovations include advanced cutter geometries, optimized diamond-polycrystalline matrices for improved wear resistance, and integrated sensors for real-time data acquisition and analysis, leading to "smart" drill bits. These advancements aim to reduce non-productive time (NPT) and lower overall drilling costs for operators. The competitive advantage lies in offering tailored solutions for specific geological challenges and drilling parameters, pushing the boundaries of drilling efficiency and safety.
Key Drivers of PDC Drill Bits Industry Growth
The PDC drill bits industry's growth is primarily fueled by several interconnected factors. Technological advancements in diamond synthesis and bit engineering are continuously improving performance metrics like rate of penetration and bit longevity. The economic imperative for efficient and cost-effective oil and gas extraction, driven by global energy demand, remains a strong underlying driver. Furthermore, increasing exploration activities in both mature and frontier regions, coupled with the exploitation of unconventional resources, create sustained demand. Favorable regulatory environments in certain key producing nations, while also imposing safety standards, facilitate market access and innovation.
Challenges in the PDC Drill Bits Industry Market
Despite robust growth prospects, the PDC drill bits industry faces several challenges. Volatile commodity prices, particularly for crude oil, can impact exploration budgets and, consequently, demand for drill bits. Intense competition among manufacturers leads to price pressures and necessitates continuous innovation to maintain market share. Supply chain disruptions, as witnessed in recent years, can affect raw material availability and lead times. Stringent environmental regulations in some regions can increase operational costs and compliance burdens. Furthermore, the limited availability of skilled labor in specialized drilling operations can indirectly affect demand for advanced drilling solutions.
Emerging Opportunities in PDC Drill Bits Industry
Emerging opportunities in the PDC Drill Bits industry are primarily centered around technological innovation and market expansion. The increasing demand for high-performance bits capable of drilling through ultra-hard formations and in extreme environments presents significant growth potential. Strategic partnerships between drill bit manufacturers and exploration companies to develop customized solutions and pilot new technologies are becoming more prevalent. Furthermore, the exploration of new energy frontiers, including geothermal energy and advanced resource extraction techniques, opens up novel applications for PDC drill bit technology. The development of "smart" drill bits with integrated sensing and communication capabilities represents a transformative opportunity for data-driven drilling optimization.
Leading Players in the PDC Drill Bits Industry Sector
- Ulterra Drilling Technologies LP
- National Oilwell Varco (NOV)
- Schoeller-Bleckmann Oilfield Equip AG
- Rockpecker Limited
- Sandvik AB
- Landrill Oil Tools Co Ltd
- Baker Hughes Company
- Halliburton Company
- Weatherford International PLC
- Schlumberger Limited
Key Milestones in PDC Drill Bits Industry Industry
- 2019: Introduction of advanced cutter designs incorporating novel diamond structures for enhanced wear resistance.
- 2020: Increased adoption of simulation and AI-driven design tools for faster product development cycles.
- 2021: Significant investment in R&D for PDC bits capable of withstanding higher temperatures and pressures in deep wells.
- 2022: Growing emphasis on sustainability and the development of more durable drill bits to reduce waste and operational footprint.
- 2023: Expansion of manufacturing capabilities by key players to meet rising global demand.
- Early 2024: Launch of new "smart" drill bit prototypes with integrated sensor technology for real-time performance monitoring.
Strategic Outlook for PDC Drill Bits Industry Market
The strategic outlook for the PDC Drill Bits industry market is characterized by sustained growth driven by technological innovation and evolving energy demands. Key accelerators include the continued focus on improving drilling efficiency and reducing costs in oil and gas extraction, alongside the expansion into new energy sectors like geothermal. Strategic opportunities lie in developing specialized bits for increasingly complex geological conditions, embracing digital transformation through "smart" drill bits, and forging collaborative partnerships across the value chain. Companies that can offer reliable, high-performance, and cost-effective drilling solutions tailored to specific market needs will be best positioned for long-term success. The market is expected to see ongoing consolidation and a heightened emphasis on R&D to maintain a competitive edge.
PDC Drill Bits Industry Segmentation
-
1. Type
- 1.1. Matrix Body
- 1.2. Steel Body
-
2. Location of Deployment
- 2.1. Onshore
- 2.2. Offshore
PDC Drill Bits Industry Segmentation By Geography
- 1. North America
- 2. Europe
- 3. Asia Pacific
- 4. South America
- 5. Middle East
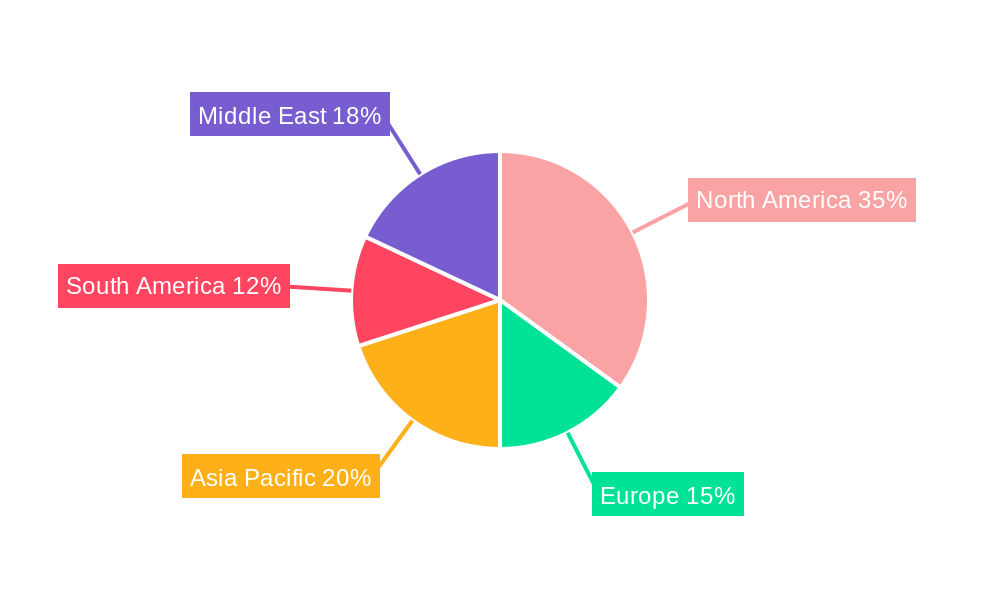
PDC Drill Bits Industry Regional Market Share
Geographic Coverage of PDC Drill Bits Industry
PDC Drill Bits Industry REPORT HIGHLIGHTS
| Aspects | Details |
|---|---|
| Study Period | 2020-2034 |
| Base Year | 2025 |
| Estimated Year | 2026 |
| Forecast Period | 2026-2034 |
| Historical Period | 2020-2025 |
| Growth Rate | CAGR of 5.62% from 2020-2034 |
| Segmentation |
|
Table of Contents
- 1. Introduction
- 1.1. Research Scope
- 1.2. Market Segmentation
- 1.3. Research Objective
- 1.4. Definitions and Assumptions
- 2. Executive Summary
- 2.1. Market Snapshot
- 3. Market Dynamics
- 3.1. Market Drivers
- 3.2. Market Restrains
- 3.3. Market Trends
- 3.4. Market Opportunities
- 4. Market Factor Analysis
- 4.1. Porters Five Forces
- 4.1.1. Bargaining Power of Suppliers
- 4.1.2. Bargaining Power of Buyers
- 4.1.3. Threat of New Entrants
- 4.1.4. Threat of Substitutes
- 4.1.5. Competitive Rivalry
- 4.2. PESTEL analysis
- 4.3. BCG Analysis
- 4.3.1. Stars (High Growth, High Market Share)
- 4.3.2. Cash Cows (Low Growth, High Market Share)
- 4.3.3. Question Mark (High Growth, Low Market Share)
- 4.3.4. Dogs (Low Growth, Low Market Share)
- 4.4. Ansoff Matrix Analysis
- 4.5. Supply Chain Analysis
- 4.6. Regulatory Landscape
- 4.7. Current Market Potential and Opportunity Assessment (TAM–SAM–SOM Framework)
- 4.8. MDP Analyst Note
- 4.1. Porters Five Forces
- 5. Market Analysis, Insights and Forecast 2021-2033
- 5.1. Market Analysis, Insights and Forecast - by Type
- 5.1.1. Matrix Body
- 5.1.2. Steel Body
- 5.2. Market Analysis, Insights and Forecast - by Location of Deployment
- 5.2.1. Onshore
- 5.2.2. Offshore
- 5.3. Market Analysis, Insights and Forecast - by Region
- 5.3.1. North America
- 5.3.2. Europe
- 5.3.3. Asia Pacific
- 5.3.4. South America
- 5.3.5. Middle East
- 5.1. Market Analysis, Insights and Forecast - by Type
- 6. Global PDC Drill Bits Industry Analysis, Insights and Forecast, 2021-2033
- 6.1. Market Analysis, Insights and Forecast - by Type
- 6.1.1. Matrix Body
- 6.1.2. Steel Body
- 6.2. Market Analysis, Insights and Forecast - by Location of Deployment
- 6.2.1. Onshore
- 6.2.2. Offshore
- 6.1. Market Analysis, Insights and Forecast - by Type
- 7. North America PDC Drill Bits Industry Analysis, Insights and Forecast, 2020-2032
- 7.1. Market Analysis, Insights and Forecast - by Type
- 7.1.1. Matrix Body
- 7.1.2. Steel Body
- 7.2. Market Analysis, Insights and Forecast - by Location of Deployment
- 7.2.1. Onshore
- 7.2.2. Offshore
- 7.1. Market Analysis, Insights and Forecast - by Type
- 8. Europe PDC Drill Bits Industry Analysis, Insights and Forecast, 2020-2032
- 8.1. Market Analysis, Insights and Forecast - by Type
- 8.1.1. Matrix Body
- 8.1.2. Steel Body
- 8.2. Market Analysis, Insights and Forecast - by Location of Deployment
- 8.2.1. Onshore
- 8.2.2. Offshore
- 8.1. Market Analysis, Insights and Forecast - by Type
- 9. Asia Pacific PDC Drill Bits Industry Analysis, Insights and Forecast, 2020-2032
- 9.1. Market Analysis, Insights and Forecast - by Type
- 9.1.1. Matrix Body
- 9.1.2. Steel Body
- 9.2. Market Analysis, Insights and Forecast - by Location of Deployment
- 9.2.1. Onshore
- 9.2.2. Offshore
- 9.1. Market Analysis, Insights and Forecast - by Type
- 10. South America PDC Drill Bits Industry Analysis, Insights and Forecast, 2020-2032
- 10.1. Market Analysis, Insights and Forecast - by Type
- 10.1.1. Matrix Body
- 10.1.2. Steel Body
- 10.2. Market Analysis, Insights and Forecast - by Location of Deployment
- 10.2.1. Onshore
- 10.2.2. Offshore
- 10.1. Market Analysis, Insights and Forecast - by Type
- 11. Middle East PDC Drill Bits Industry Analysis, Insights and Forecast, 2020-2032
- 11.1. Market Analysis, Insights and Forecast - by Type
- 11.1.1. Matrix Body
- 11.1.2. Steel Body
- 11.2. Market Analysis, Insights and Forecast - by Location of Deployment
- 11.2.1. Onshore
- 11.2.2. Offshore
- 11.1. Market Analysis, Insights and Forecast - by Type
- 12. Competitive Analysis
- 12.1. Company Profiles
- 12.1.1 Ulterra Drilling Technologies LP
- 12.1.1.1. Company Overview
- 12.1.1.2. Products
- 12.1.1.3. Company Financials
- 12.1.1.4. SWOT Analysis
- 12.1.2 National Oilwell Varco (NOV)
- 12.1.2.1. Company Overview
- 12.1.2.2. Products
- 12.1.2.3. Company Financials
- 12.1.2.4. SWOT Analysis
- 12.1.3 Schoeller-Bleckmann Oilfield Equip AG
- 12.1.3.1. Company Overview
- 12.1.3.2. Products
- 12.1.3.3. Company Financials
- 12.1.3.4. SWOT Analysis
- 12.1.4 Rockpecker Limited
- 12.1.4.1. Company Overview
- 12.1.4.2. Products
- 12.1.4.3. Company Financials
- 12.1.4.4. SWOT Analysis
- 12.1.5 Sandvik AB
- 12.1.5.1. Company Overview
- 12.1.5.2. Products
- 12.1.5.3. Company Financials
- 12.1.5.4. SWOT Analysis
- 12.1.6 Landrill Oil Tools Co Ltd
- 12.1.6.1. Company Overview
- 12.1.6.2. Products
- 12.1.6.3. Company Financials
- 12.1.6.4. SWOT Analysis
- 12.1.7 Baker Hughes Company
- 12.1.7.1. Company Overview
- 12.1.7.2. Products
- 12.1.7.3. Company Financials
- 12.1.7.4. SWOT Analysis
- 12.1.8 Halliburton Company
- 12.1.8.1. Company Overview
- 12.1.8.2. Products
- 12.1.8.3. Company Financials
- 12.1.8.4. SWOT Analysis
- 12.1.9 Weatherford International PLC*List Not Exhaustive
- 12.1.9.1. Company Overview
- 12.1.9.2. Products
- 12.1.9.3. Company Financials
- 12.1.9.4. SWOT Analysis
- 12.1.10 Schlumberger Limited
- 12.1.10.1. Company Overview
- 12.1.10.2. Products
- 12.1.10.3. Company Financials
- 12.1.10.4. SWOT Analysis
- 12.1.1 Ulterra Drilling Technologies LP
- 12.2. Market Entropy
- 12.2.1 Company's Key Areas Served
- 12.2.2 Recent Developments
- 12.3. Company Market Share Analysis 2025
- 12.3.1 Top 5 Companies Market Share Analysis
- 12.3.2 Top 3 Companies Market Share Analysis
- 12.4. List of Potential Customers
- 13. Research Methodology
List of Figures
- Figure 1: Global PDC Drill Bits Industry Revenue Breakdown (million, %) by Region 2025 & 2033
- Figure 2: Global PDC Drill Bits Industry Volume Breakdown (K Units, %) by Region 2025 & 2033
- Figure 3: North America PDC Drill Bits Industry Revenue (million), by Type 2025 & 2033
- Figure 4: North America PDC Drill Bits Industry Volume (K Units), by Type 2025 & 2033
- Figure 5: North America PDC Drill Bits Industry Revenue Share (%), by Type 2025 & 2033
- Figure 6: North America PDC Drill Bits Industry Volume Share (%), by Type 2025 & 2033
- Figure 7: North America PDC Drill Bits Industry Revenue (million), by Location of Deployment 2025 & 2033
- Figure 8: North America PDC Drill Bits Industry Volume (K Units), by Location of Deployment 2025 & 2033
- Figure 9: North America PDC Drill Bits Industry Revenue Share (%), by Location of Deployment 2025 & 2033
- Figure 10: North America PDC Drill Bits Industry Volume Share (%), by Location of Deployment 2025 & 2033
- Figure 11: North America PDC Drill Bits Industry Revenue (million), by Country 2025 & 2033
- Figure 12: North America PDC Drill Bits Industry Volume (K Units), by Country 2025 & 2033
- Figure 13: North America PDC Drill Bits Industry Revenue Share (%), by Country 2025 & 2033
- Figure 14: North America PDC Drill Bits Industry Volume Share (%), by Country 2025 & 2033
- Figure 15: Europe PDC Drill Bits Industry Revenue (million), by Type 2025 & 2033
- Figure 16: Europe PDC Drill Bits Industry Volume (K Units), by Type 2025 & 2033
- Figure 17: Europe PDC Drill Bits Industry Revenue Share (%), by Type 2025 & 2033
- Figure 18: Europe PDC Drill Bits Industry Volume Share (%), by Type 2025 & 2033
- Figure 19: Europe PDC Drill Bits Industry Revenue (million), by Location of Deployment 2025 & 2033
- Figure 20: Europe PDC Drill Bits Industry Volume (K Units), by Location of Deployment 2025 & 2033
- Figure 21: Europe PDC Drill Bits Industry Revenue Share (%), by Location of Deployment 2025 & 2033
- Figure 22: Europe PDC Drill Bits Industry Volume Share (%), by Location of Deployment 2025 & 2033
- Figure 23: Europe PDC Drill Bits Industry Revenue (million), by Country 2025 & 2033
- Figure 24: Europe PDC Drill Bits Industry Volume (K Units), by Country 2025 & 2033
- Figure 25: Europe PDC Drill Bits Industry Revenue Share (%), by Country 2025 & 2033
- Figure 26: Europe PDC Drill Bits Industry Volume Share (%), by Country 2025 & 2033
- Figure 27: Asia Pacific PDC Drill Bits Industry Revenue (million), by Type 2025 & 2033
- Figure 28: Asia Pacific PDC Drill Bits Industry Volume (K Units), by Type 2025 & 2033
- Figure 29: Asia Pacific PDC Drill Bits Industry Revenue Share (%), by Type 2025 & 2033
- Figure 30: Asia Pacific PDC Drill Bits Industry Volume Share (%), by Type 2025 & 2033
- Figure 31: Asia Pacific PDC Drill Bits Industry Revenue (million), by Location of Deployment 2025 & 2033
- Figure 32: Asia Pacific PDC Drill Bits Industry Volume (K Units), by Location of Deployment 2025 & 2033
- Figure 33: Asia Pacific PDC Drill Bits Industry Revenue Share (%), by Location of Deployment 2025 & 2033
- Figure 34: Asia Pacific PDC Drill Bits Industry Volume Share (%), by Location of Deployment 2025 & 2033
- Figure 35: Asia Pacific PDC Drill Bits Industry Revenue (million), by Country 2025 & 2033
- Figure 36: Asia Pacific PDC Drill Bits Industry Volume (K Units), by Country 2025 & 2033
- Figure 37: Asia Pacific PDC Drill Bits Industry Revenue Share (%), by Country 2025 & 2033
- Figure 38: Asia Pacific PDC Drill Bits Industry Volume Share (%), by Country 2025 & 2033
- Figure 39: South America PDC Drill Bits Industry Revenue (million), by Type 2025 & 2033
- Figure 40: South America PDC Drill Bits Industry Volume (K Units), by Type 2025 & 2033
- Figure 41: South America PDC Drill Bits Industry Revenue Share (%), by Type 2025 & 2033
- Figure 42: South America PDC Drill Bits Industry Volume Share (%), by Type 2025 & 2033
- Figure 43: South America PDC Drill Bits Industry Revenue (million), by Location of Deployment 2025 & 2033
- Figure 44: South America PDC Drill Bits Industry Volume (K Units), by Location of Deployment 2025 & 2033
- Figure 45: South America PDC Drill Bits Industry Revenue Share (%), by Location of Deployment 2025 & 2033
- Figure 46: South America PDC Drill Bits Industry Volume Share (%), by Location of Deployment 2025 & 2033
- Figure 47: South America PDC Drill Bits Industry Revenue (million), by Country 2025 & 2033
- Figure 48: South America PDC Drill Bits Industry Volume (K Units), by Country 2025 & 2033
- Figure 49: South America PDC Drill Bits Industry Revenue Share (%), by Country 2025 & 2033
- Figure 50: South America PDC Drill Bits Industry Volume Share (%), by Country 2025 & 2033
- Figure 51: Middle East PDC Drill Bits Industry Revenue (million), by Type 2025 & 2033
- Figure 52: Middle East PDC Drill Bits Industry Volume (K Units), by Type 2025 & 2033
- Figure 53: Middle East PDC Drill Bits Industry Revenue Share (%), by Type 2025 & 2033
- Figure 54: Middle East PDC Drill Bits Industry Volume Share (%), by Type 2025 & 2033
- Figure 55: Middle East PDC Drill Bits Industry Revenue (million), by Location of Deployment 2025 & 2033
- Figure 56: Middle East PDC Drill Bits Industry Volume (K Units), by Location of Deployment 2025 & 2033
- Figure 57: Middle East PDC Drill Bits Industry Revenue Share (%), by Location of Deployment 2025 & 2033
- Figure 58: Middle East PDC Drill Bits Industry Volume Share (%), by Location of Deployment 2025 & 2033
- Figure 59: Middle East PDC Drill Bits Industry Revenue (million), by Country 2025 & 2033
- Figure 60: Middle East PDC Drill Bits Industry Volume (K Units), by Country 2025 & 2033
- Figure 61: Middle East PDC Drill Bits Industry Revenue Share (%), by Country 2025 & 2033
- Figure 62: Middle East PDC Drill Bits Industry Volume Share (%), by Country 2025 & 2033
List of Tables
- Table 1: Global PDC Drill Bits Industry Revenue million Forecast, by Type 2020 & 2033
- Table 2: Global PDC Drill Bits Industry Volume K Units Forecast, by Type 2020 & 2033
- Table 3: Global PDC Drill Bits Industry Revenue million Forecast, by Location of Deployment 2020 & 2033
- Table 4: Global PDC Drill Bits Industry Volume K Units Forecast, by Location of Deployment 2020 & 2033
- Table 5: Global PDC Drill Bits Industry Revenue million Forecast, by Region 2020 & 2033
- Table 6: Global PDC Drill Bits Industry Volume K Units Forecast, by Region 2020 & 2033
- Table 7: Global PDC Drill Bits Industry Revenue million Forecast, by Type 2020 & 2033
- Table 8: Global PDC Drill Bits Industry Volume K Units Forecast, by Type 2020 & 2033
- Table 9: Global PDC Drill Bits Industry Revenue million Forecast, by Location of Deployment 2020 & 2033
- Table 10: Global PDC Drill Bits Industry Volume K Units Forecast, by Location of Deployment 2020 & 2033
- Table 11: Global PDC Drill Bits Industry Revenue million Forecast, by Country 2020 & 2033
- Table 12: Global PDC Drill Bits Industry Volume K Units Forecast, by Country 2020 & 2033
- Table 13: Global PDC Drill Bits Industry Revenue million Forecast, by Type 2020 & 2033
- Table 14: Global PDC Drill Bits Industry Volume K Units Forecast, by Type 2020 & 2033
- Table 15: Global PDC Drill Bits Industry Revenue million Forecast, by Location of Deployment 2020 & 2033
- Table 16: Global PDC Drill Bits Industry Volume K Units Forecast, by Location of Deployment 2020 & 2033
- Table 17: Global PDC Drill Bits Industry Revenue million Forecast, by Country 2020 & 2033
- Table 18: Global PDC Drill Bits Industry Volume K Units Forecast, by Country 2020 & 2033
- Table 19: Global PDC Drill Bits Industry Revenue million Forecast, by Type 2020 & 2033
- Table 20: Global PDC Drill Bits Industry Volume K Units Forecast, by Type 2020 & 2033
- Table 21: Global PDC Drill Bits Industry Revenue million Forecast, by Location of Deployment 2020 & 2033
- Table 22: Global PDC Drill Bits Industry Volume K Units Forecast, by Location of Deployment 2020 & 2033
- Table 23: Global PDC Drill Bits Industry Revenue million Forecast, by Country 2020 & 2033
- Table 24: Global PDC Drill Bits Industry Volume K Units Forecast, by Country 2020 & 2033
- Table 25: Global PDC Drill Bits Industry Revenue million Forecast, by Type 2020 & 2033
- Table 26: Global PDC Drill Bits Industry Volume K Units Forecast, by Type 2020 & 2033
- Table 27: Global PDC Drill Bits Industry Revenue million Forecast, by Location of Deployment 2020 & 2033
- Table 28: Global PDC Drill Bits Industry Volume K Units Forecast, by Location of Deployment 2020 & 2033
- Table 29: Global PDC Drill Bits Industry Revenue million Forecast, by Country 2020 & 2033
- Table 30: Global PDC Drill Bits Industry Volume K Units Forecast, by Country 2020 & 2033
- Table 31: Global PDC Drill Bits Industry Revenue million Forecast, by Type 2020 & 2033
- Table 32: Global PDC Drill Bits Industry Volume K Units Forecast, by Type 2020 & 2033
- Table 33: Global PDC Drill Bits Industry Revenue million Forecast, by Location of Deployment 2020 & 2033
- Table 34: Global PDC Drill Bits Industry Volume K Units Forecast, by Location of Deployment 2020 & 2033
- Table 35: Global PDC Drill Bits Industry Revenue million Forecast, by Country 2020 & 2033
- Table 36: Global PDC Drill Bits Industry Volume K Units Forecast, by Country 2020 & 2033
Frequently Asked Questions
1. What is the projected Compound Annual Growth Rate (CAGR) of the PDC Drill Bits Industry?
The projected CAGR is approximately 5.62%.
2. Which companies are prominent players in the PDC Drill Bits Industry?
Key companies in the market include Ulterra Drilling Technologies LP, National Oilwell Varco (NOV), Schoeller-Bleckmann Oilfield Equip AG, Rockpecker Limited, Sandvik AB, Landrill Oil Tools Co Ltd, Baker Hughes Company, Halliburton Company, Weatherford International PLC*List Not Exhaustive, Schlumberger Limited.
3. What are the main segments of the PDC Drill Bits Industry?
The market segments include Type, Location of Deployment.
4. Can you provide details about the market size?
The market size is estimated to be USD 972.74 million as of 2022.
5. What are some drivers contributing to market growth?
Growing demand for natural gas and developing gas infrastructure.; Increasing offshore oil and Gas Exploration Activities.
6. What are the notable trends driving market growth?
The Onshore Segment to Dominate the Market.
7. Are there any restraints impacting market growth?
Adoption of Cleaner Alternatives.
8. Can you provide examples of recent developments in the market?
N/A
9. What pricing options are available for accessing the report?
Pricing options include single-user, multi-user, and enterprise licenses priced at USD 4750, USD 5250, and USD 8750 respectively.
10. Is the market size provided in terms of value or volume?
The market size is provided in terms of value, measured in million and volume, measured in K Units.
11. Are there any specific market keywords associated with the report?
Yes, the market keyword associated with the report is "PDC Drill Bits Industry," which aids in identifying and referencing the specific market segment covered.
12. How do I determine which pricing option suits my needs best?
The pricing options vary based on user requirements and access needs. Individual users may opt for single-user licenses, while businesses requiring broader access may choose multi-user or enterprise licenses for cost-effective access to the report.
13. Are there any additional resources or data provided in the PDC Drill Bits Industry report?
While the report offers comprehensive insights, it's advisable to review the specific contents or supplementary materials provided to ascertain if additional resources or data are available.
14. How can I stay updated on further developments or reports in the PDC Drill Bits Industry?
To stay informed about further developments, trends, and reports in the PDC Drill Bits Industry, consider subscribing to industry newsletters, following relevant companies and organizations, or regularly checking reputable industry news sources and publications.
Methodology
Step 1 - Identification of Relevant Samples Size from Population Database


Step 2 - Approaches for Defining Global Market Size (Value, Volume* & Price*)

Note*: In applicable scenarios
Step 3 - Data Sources
Primary Research
- Web Analytics
- Survey Reports
- Research Institute
- Latest Research Reports
- Opinion Leaders
Secondary Research
- Annual Reports
- White Paper
- Latest Press Release
- Industry Association
- Paid Database
- Investor Presentations

Step 4 - Data Triangulation
Involves using different sources of information in order to increase the validity of a study
These sources are likely to be stakeholders in a program - participants, other researchers, program staff, other community members, and so on.
Then we put all data in single framework & apply various statistical tools to find out the dynamic on the market.
During the analysis stage, feedback from the stakeholder groups would be compared to determine areas of agreement as well as areas of divergence