

Key Insights
The global Vapor Recovery Units (VRU) market is projected for substantial growth, reaching an estimated $0.94 billion by 2025, with a robust Compound Annual Growth Rate (CAGR) of 6.11% through 2033. This expansion is driven by stringent environmental regulations mandating VOC emission reduction, particularly in the Oil & Gas and Chemical & Petrochemical sectors. VRUs enhance operational safety and economic efficiency by recovering valuable hydrocarbons. The increasing focus on sustainability and circular economy principles further fuels demand for advanced VRU technologies.
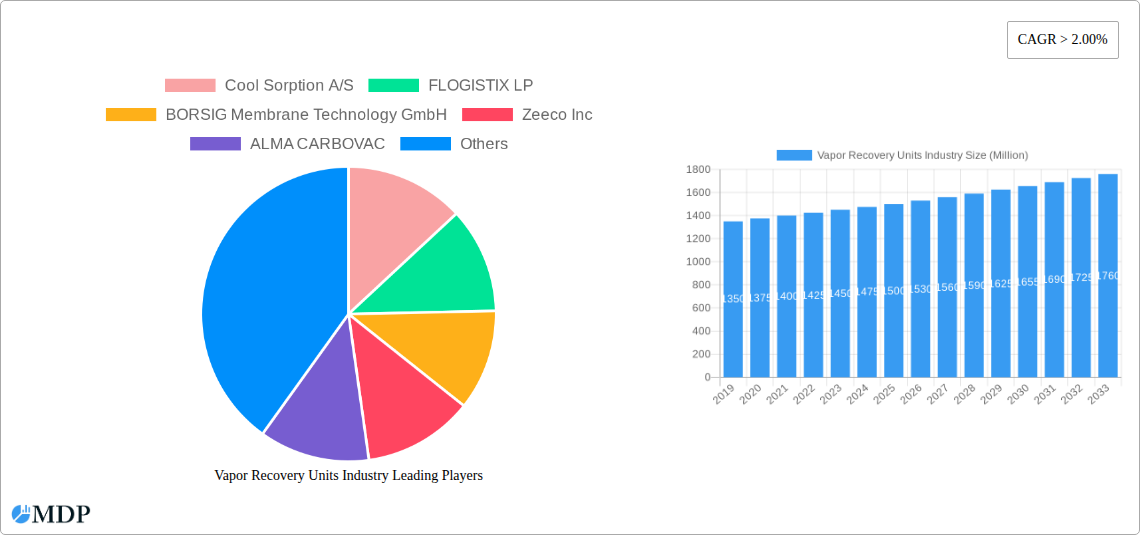
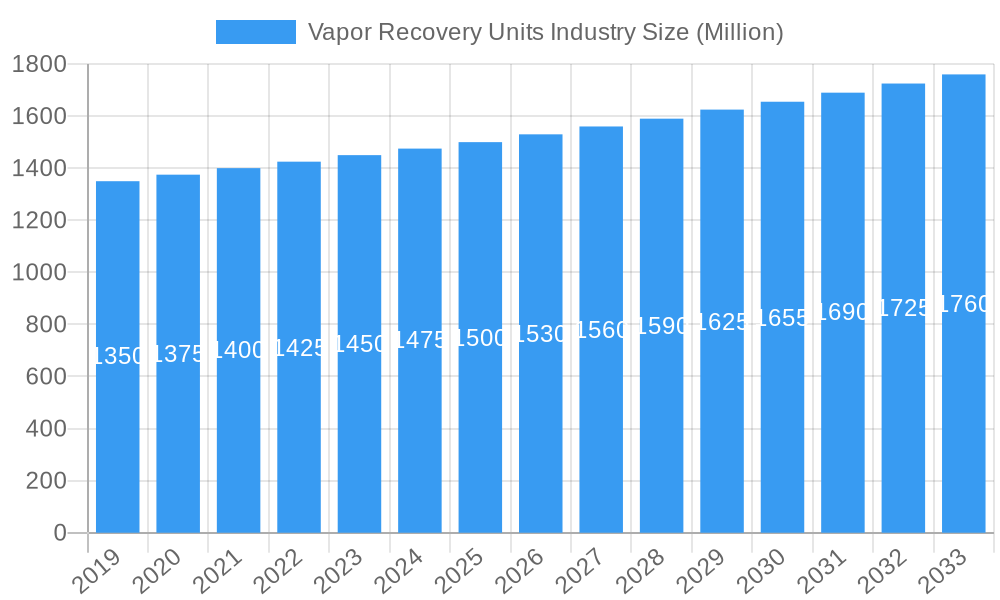
Vapor Recovery Units Industry Market Size (In Million)
Technological advancements, including more efficient and compact units, improved control systems, and tailored solutions for hydrocarbon processing, storage, and transportation, are propelling market growth. Key industry players are investing in R&D to provide customized VRU solutions. While high initial capital investment and integration complexities present challenges, the long-term economic benefits, including reduced product loss and compliance with environmental standards, are expected to sustain market expansion.
Vapor Recovery Units Industry Company Market Share
This comprehensive report offers a detailed analysis of the global Vapor Recovery Units (VRU) market, a vital technology for VOC emission control. Covering the period from 2019 to 2033, with a base year of 2025, the report examines market dynamics, technological progress, regulatory environments, and key growth drivers. The VRU industry is set for significant expansion, driven by environmental mandates and the growing need for sustainable industrial practices. This report provides actionable insights for stakeholders in the Oil & Gas, Chemical & Petrochemical, and other relevant sectors, identifying critical opportunities and challenges.
Vapor Recovery Units Industry Market Dynamics & Concentration
The Vapor Recovery Units (VRU) market exhibits a moderate to high concentration, with key players investing heavily in research and development to meet evolving regulatory demands. Innovation drivers include the need for more efficient and cost-effective VOC emission control, advancements in membrane technology, and the integration of smart monitoring systems. Regulatory frameworks, particularly stringent environmental protection laws globally, are a primary catalyst for VRU adoption. Product substitutes, such as thermal oxidizers, exist but often present higher operational costs. End-user trends lean towards integrated solutions that offer both recovery and reuse capabilities, maximizing economic benefits. Mergers and acquisitions (M&A) are strategically employed by leading companies to expand market reach and technological portfolios. Over the historical period (2019-2024), an estimated XX M&A deals were recorded, signaling consolidation and strategic growth. Market share is fragmented, with the top five companies holding approximately XX% of the total market.
- Innovation Drivers: Enhanced efficiency, lower energy consumption, advanced material science for membranes, IoT integration for remote monitoring and predictive maintenance.
- Regulatory Frameworks: Growing stringency of EPA, REACH, and other regional VOC emission standards.
- Product Substitutes: Thermal oxidizers, catalytic oxidizers, flares – analyzed for cost-effectiveness and applicability.
- End-User Trends: Demand for turnkey solutions, carbon credit generation through recovered vapors, and integration with existing plant infrastructure.
- M&A Activities: Focus on acquiring niche technologies, expanding geographical presence, and consolidating market leadership.
Vapor Recovery Units Industry Industry Trends & Analysis
The Vapor Recovery Units (VRU) market is experiencing robust growth, projected to achieve a Compound Annual Growth Rate (CAGR) of XX% from 2025 to 2033. This expansion is fueled by several interconnected trends. The increasing global awareness and governmental enforcement of environmental protection policies, particularly those targeting volatile organic compound (VOC) emissions, are paramount. Industries such as Oil & Gas and Chemical & Petrochemical are under immense pressure to reduce their environmental footprint, making VRUs an essential investment. Technological disruptions are transforming the VRU landscape, with the advancement of membrane separation technology offering higher recovery rates and lower energy consumption compared to traditional methods. Furthermore, the integration of digital technologies, including AI and IoT, allows for real-time performance monitoring, predictive maintenance, and optimization of VRU operations, leading to enhanced efficiency and reduced downtime. Consumer preferences are shifting towards solutions that not only ensure compliance but also offer economic benefits through the recovery and potential reuse of valuable hydrocarbons. This creates a dual incentive for VRU adoption. Competitive dynamics are characterized by innovation and strategic partnerships, as companies strive to differentiate themselves through superior technology, comprehensive service offerings, and competitive pricing. Market penetration is expected to deepen significantly in developing economies as environmental regulations become more standardized. The increasing focus on sustainability and the circular economy further bolsters the demand for VRU systems, as recovered vapors can be reprocessed or sold, generating additional revenue streams and reducing reliance on virgin resources. The global market size for VRUs is estimated to reach XX Million in 2025, with projections indicating a substantial rise to XX Million by 2033.
Leading Markets & Segments in Vapor Recovery Units Industry
The Oil & Gas sector currently dominates the Vapor Recovery Units (VRU) market, driven by the inherent nature of its operations involving the handling of large volumes of volatile hydrocarbons. Within this sector, the Storage application segment exhibits the highest market share due to stringent regulations governing emissions from storage tanks at refineries, terminals, and production facilities. Countries with extensive oil and gas reserves and robust refining capacities, such as the United States, China, and Middle Eastern nations, represent the leading geographical markets.
- Dominant Application: Storage segment, crucial for compliance with emission standards at tank farms and terminals. Key drivers include:
- Strict environmental regulations (e.g., EPA Tier standards, API guidelines).
- The need to prevent significant hydrocarbon losses during storage.
- The economic benefit of recovering valuable vapors.
- Dominant End-User: Oil & Gas industry, encompassing upstream, midstream, and downstream operations. Dominance is attributed to:
- High volume of VOC emissions associated with crude oil and refined product handling.
- Significant capital investment capabilities for environmental compliance technologies.
- The presence of established infrastructure requiring continuous emission monitoring and control.
- Leading Geographical Markets:
- North America (especially the USA): Driven by stringent EPA regulations and a large refining and petrochemical industry.
- Asia-Pacific (especially China): Rapid industrial growth, increasing environmental awareness, and significant investments in the oil and gas sector.
- Middle East: Vast oil and gas production and refining capacity, coupled with a growing focus on environmental sustainability.
- Key Drivers of Segment Dominance:
- Regulatory Compliance: Mandates to reduce VOC emissions are the primary impetus for VRU adoption in storage applications within the oil and gas sector.
- Economic Viability: The recovery of valuable hydrocarbons from vapors presents a clear return on investment, making VRUs an attractive solution.
- Technological Maturity: Well-established VRU technologies are readily available and proven for large-scale oil and gas operations.
Vapor Recovery Units Industry Product Developments
Product developments in the Vapor Recovery Units (VRU) industry are increasingly focused on enhancing efficiency, reducing operational costs, and improving environmental performance. Innovations include the development of advanced membrane materials for higher selectivity and permeability, leading to more effective separation of VOCs from air. Furthermore, the integration of smart technologies, such as IoT sensors and AI-powered analytics, allows for real-time performance monitoring, predictive maintenance, and optimized operation of VRU systems. These advancements result in higher recovery rates, reduced energy consumption, and extended equipment lifespan, offering significant competitive advantages to manufacturers and end-users alike. The market is also witnessing the development of modular and compact VRU designs to cater to smaller facilities and remote locations.
Key Drivers of Vapor Recovery Units Industry Growth
The Vapor Recovery Units (VRU) industry's growth is primarily propelled by a confluence of critical factors. Stringent environmental regulations worldwide, aimed at curbing VOC emissions and improving air quality, are the most significant driver. The Oil & Gas and Chemical & Petrochemical sectors, facing mounting pressure for sustainable operations, are actively investing in VRU technology to ensure compliance. Technological advancements, particularly in membrane separation and adsorption technologies, are enhancing VRU efficiency and cost-effectiveness. Growing awareness of the economic benefits derived from recovering valuable hydrocarbons from process vents and storage tanks also fuels demand.
Challenges in the Vapor Recovery Units Industry Market
Despite robust growth, the Vapor Recovery Units (VRU) market faces certain challenges. The initial capital investment required for VRU systems can be a barrier, especially for smaller enterprises or in regions with less stringent regulations. Fluctuations in the price of recovered hydrocarbons can impact the perceived economic viability of VRU installations. Furthermore, the complexity of integrating VRUs with existing infrastructure and ensuring their reliable operation in harsh industrial environments requires specialized expertise. Supply chain disruptions for critical components and the availability of skilled technicians for installation and maintenance can also pose challenges.
Emerging Opportunities in Vapor Recovery Units Industry
Emerging opportunities in the Vapor Recovery Units (VRU) industry are ripe for exploration, driven by evolving environmental concerns and technological advancements. The increasing focus on the circular economy presents a significant avenue, as recovered vapors can be reprocessed and reintegrated into production cycles, creating a closed-loop system. The development of highly specialized VRU solutions for niche applications within industries like pharmaceuticals and food processing, which also deal with volatile compounds, offers untapped market potential. Strategic partnerships between VRU manufacturers and industrial automation companies can lead to the creation of integrated, intelligent emission control systems. Furthermore, the growing demand for carbon capture and utilization (CCU) technologies may see VRUs playing a crucial role in pre-treatment or capture processes.
Leading Players in the Vapor Recovery Units Industry Sector
- Cool Sorption A/S
- FLOGISTIX LP
- BORSIG Membrane Technology GmbH
- Zeeco Inc
- ALMA CARBOVAC
- Kappa GI
- John Zink Company LLC
- Kilburn Engineering Ltd
- AEREON
- Symex GmbH & Co KG
- Hy-Bon Engineering Company Inc
- VOCZero Ltd
Key Milestones in Vapor Recovery Units Industry Industry
- 2019: Increased regulatory enforcement of VOC emission standards globally, spurring VRU adoption.
- 2020: Advancements in membrane technology leading to higher recovery efficiency and lower energy consumption in VRUs.
- 2021: Growing adoption of digital technologies (IoT, AI) for remote monitoring and predictive maintenance of VRU systems.
- 2022: Several key players in the Oil & Gas sector announce significant investments in emission reduction technologies, including VRUs.
- 2023: Launch of new, modular VRU designs catering to smaller industrial facilities and remote locations.
- 2024: Increased focus on the economic benefits of vapor recovery, with companies exploring value creation from recovered hydrocarbons.
Strategic Outlook for Vapor Recovery Units Industry Market
The strategic outlook for the Vapor Recovery Units (VRU) market is exceptionally positive, driven by a sustained demand for environmental compliance and operational efficiency. Future growth will likely be fueled by continued innovation in membrane technology, adsorption processes, and digital integration, leading to more sophisticated and cost-effective solutions. Companies that can offer comprehensive, turnkey VRU solutions, coupled with robust after-sales support and a clear demonstration of ROI, will be well-positioned for success. The increasing global emphasis on sustainability and the circular economy will further solidify the importance of VRUs, not just as emission control devices but as integral components of resource management strategies. Strategic partnerships and potential market consolidation are expected to shape the competitive landscape.
Vapor Recovery Units Industry Segmentation
-
1. Application
- 1.1. Processing
- 1.2. Storage
- 1.3. Transportation
-
2. End-User
- 2.1. Oil & Gas
- 2.2. Chemical & Petrochemical
- 2.3. Others
Vapor Recovery Units Industry Segmentation By Geography
- 1. North America
- 2. Europe
- 3. Asia Pacific
- 4. South America
- 5. Middle East and Africa
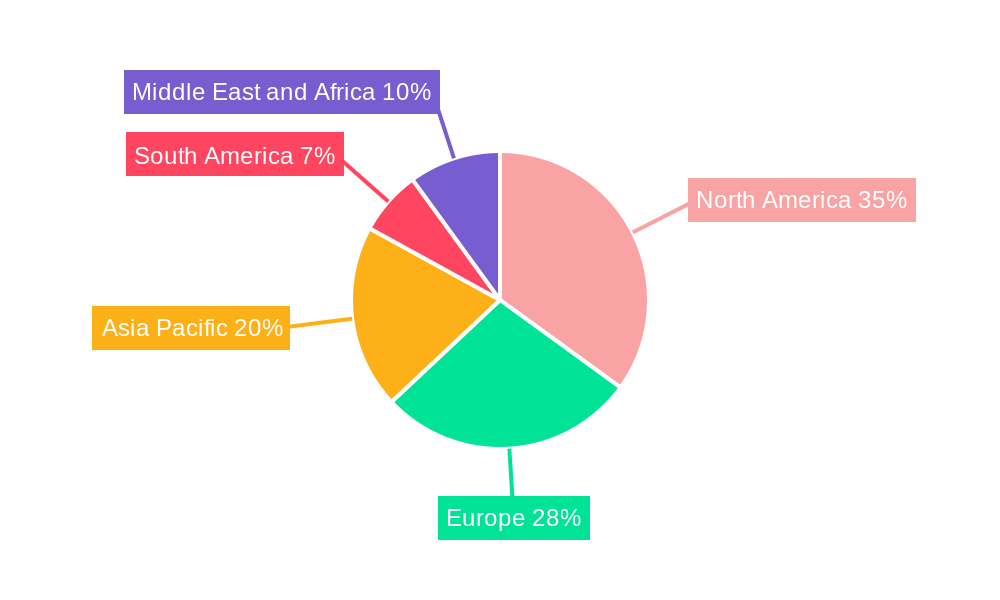
Vapor Recovery Units Industry Regional Market Share
Geographic Coverage of Vapor Recovery Units Industry
Vapor Recovery Units Industry REPORT HIGHLIGHTS
| Aspects | Details |
|---|---|
| Study Period | 2020-2034 |
| Base Year | 2025 |
| Estimated Year | 2026 |
| Forecast Period | 2026-2034 |
| Historical Period | 2020-2025 |
| Growth Rate | CAGR of 6.11% from 2020-2034 |
| Segmentation |
|
Table of Contents
- 1. Introduction
- 1.1. Research Scope
- 1.2. Market Segmentation
- 1.3. Research Objective
- 1.4. Definitions and Assumptions
- 2. Executive Summary
- 2.1. Market Snapshot
- 3. Market Dynamics
- 3.1. Market Drivers
- 3.2. Market Restrains
- 3.3. Market Trends
- 3.4. Market Opportunities
- 4. Market Factor Analysis
- 4.1. Porters Five Forces
- 4.1.1. Bargaining Power of Suppliers
- 4.1.2. Bargaining Power of Buyers
- 4.1.3. Threat of New Entrants
- 4.1.4. Threat of Substitutes
- 4.1.5. Competitive Rivalry
- 4.2. PESTEL analysis
- 4.3. BCG Analysis
- 4.3.1. Stars (High Growth, High Market Share)
- 4.3.2. Cash Cows (Low Growth, High Market Share)
- 4.3.3. Question Mark (High Growth, Low Market Share)
- 4.3.4. Dogs (Low Growth, Low Market Share)
- 4.4. Ansoff Matrix Analysis
- 4.5. Supply Chain Analysis
- 4.6. Regulatory Landscape
- 4.7. Current Market Potential and Opportunity Assessment (TAM–SAM–SOM Framework)
- 4.8. MDP Analyst Note
- 4.1. Porters Five Forces
- 5. Market Analysis, Insights and Forecast 2021-2033
- 5.1. Market Analysis, Insights and Forecast - by Application
- 5.1.1. Processing
- 5.1.2. Storage
- 5.1.3. Transportation
- 5.2. Market Analysis, Insights and Forecast - by End-User
- 5.2.1. Oil & Gas
- 5.2.2. Chemical & Petrochemical
- 5.2.3. Others
- 5.3. Market Analysis, Insights and Forecast - by Region
- 5.3.1. North America
- 5.3.2. Europe
- 5.3.3. Asia Pacific
- 5.3.4. South America
- 5.3.5. Middle East and Africa
- 5.1. Market Analysis, Insights and Forecast - by Application
- 6. Global Vapor Recovery Units Industry Analysis, Insights and Forecast, 2021-2033
- 6.1. Market Analysis, Insights and Forecast - by Application
- 6.1.1. Processing
- 6.1.2. Storage
- 6.1.3. Transportation
- 6.2. Market Analysis, Insights and Forecast - by End-User
- 6.2.1. Oil & Gas
- 6.2.2. Chemical & Petrochemical
- 6.2.3. Others
- 6.1. Market Analysis, Insights and Forecast - by Application
- 7. North America Vapor Recovery Units Industry Analysis, Insights and Forecast, 2020-2032
- 7.1. Market Analysis, Insights and Forecast - by Application
- 7.1.1. Processing
- 7.1.2. Storage
- 7.1.3. Transportation
- 7.2. Market Analysis, Insights and Forecast - by End-User
- 7.2.1. Oil & Gas
- 7.2.2. Chemical & Petrochemical
- 7.2.3. Others
- 7.1. Market Analysis, Insights and Forecast - by Application
- 8. Europe Vapor Recovery Units Industry Analysis, Insights and Forecast, 2020-2032
- 8.1. Market Analysis, Insights and Forecast - by Application
- 8.1.1. Processing
- 8.1.2. Storage
- 8.1.3. Transportation
- 8.2. Market Analysis, Insights and Forecast - by End-User
- 8.2.1. Oil & Gas
- 8.2.2. Chemical & Petrochemical
- 8.2.3. Others
- 8.1. Market Analysis, Insights and Forecast - by Application
- 9. Asia Pacific Vapor Recovery Units Industry Analysis, Insights and Forecast, 2020-2032
- 9.1. Market Analysis, Insights and Forecast - by Application
- 9.1.1. Processing
- 9.1.2. Storage
- 9.1.3. Transportation
- 9.2. Market Analysis, Insights and Forecast - by End-User
- 9.2.1. Oil & Gas
- 9.2.2. Chemical & Petrochemical
- 9.2.3. Others
- 9.1. Market Analysis, Insights and Forecast - by Application
- 10. South America Vapor Recovery Units Industry Analysis, Insights and Forecast, 2020-2032
- 10.1. Market Analysis, Insights and Forecast - by Application
- 10.1.1. Processing
- 10.1.2. Storage
- 10.1.3. Transportation
- 10.2. Market Analysis, Insights and Forecast - by End-User
- 10.2.1. Oil & Gas
- 10.2.2. Chemical & Petrochemical
- 10.2.3. Others
- 10.1. Market Analysis, Insights and Forecast - by Application
- 11. Middle East and Africa Vapor Recovery Units Industry Analysis, Insights and Forecast, 2020-2032
- 11.1. Market Analysis, Insights and Forecast - by Application
- 11.1.1. Processing
- 11.1.2. Storage
- 11.1.3. Transportation
- 11.2. Market Analysis, Insights and Forecast - by End-User
- 11.2.1. Oil & Gas
- 11.2.2. Chemical & Petrochemical
- 11.2.3. Others
- 11.1. Market Analysis, Insights and Forecast - by Application
- 12. Competitive Analysis
- 12.1. Company Profiles
- 12.1.1 Cool Sorption A/S
- 12.1.1.1. Company Overview
- 12.1.1.2. Products
- 12.1.1.3. Company Financials
- 12.1.1.4. SWOT Analysis
- 12.1.2 FLOGISTIX LP
- 12.1.2.1. Company Overview
- 12.1.2.2. Products
- 12.1.2.3. Company Financials
- 12.1.2.4. SWOT Analysis
- 12.1.3 BORSIG Membrane Technology GmbH
- 12.1.3.1. Company Overview
- 12.1.3.2. Products
- 12.1.3.3. Company Financials
- 12.1.3.4. SWOT Analysis
- 12.1.4 Zeeco Inc
- 12.1.4.1. Company Overview
- 12.1.4.2. Products
- 12.1.4.3. Company Financials
- 12.1.4.4. SWOT Analysis
- 12.1.5 ALMA CARBOVAC
- 12.1.5.1. Company Overview
- 12.1.5.2. Products
- 12.1.5.3. Company Financials
- 12.1.5.4. SWOT Analysis
- 12.1.6 Kappa GI
- 12.1.6.1. Company Overview
- 12.1.6.2. Products
- 12.1.6.3. Company Financials
- 12.1.6.4. SWOT Analysis
- 12.1.7 John Zink Company LLC
- 12.1.7.1. Company Overview
- 12.1.7.2. Products
- 12.1.7.3. Company Financials
- 12.1.7.4. SWOT Analysis
- 12.1.8 Kilburn Engineering Ltd*List Not Exhaustive
- 12.1.8.1. Company Overview
- 12.1.8.2. Products
- 12.1.8.3. Company Financials
- 12.1.8.4. SWOT Analysis
- 12.1.9 AEREON
- 12.1.9.1. Company Overview
- 12.1.9.2. Products
- 12.1.9.3. Company Financials
- 12.1.9.4. SWOT Analysis
- 12.1.10 Symex GmbH & Co KG
- 12.1.10.1. Company Overview
- 12.1.10.2. Products
- 12.1.10.3. Company Financials
- 12.1.10.4. SWOT Analysis
- 12.1.11 Hy-Bon Engineering Company Inc
- 12.1.11.1. Company Overview
- 12.1.11.2. Products
- 12.1.11.3. Company Financials
- 12.1.11.4. SWOT Analysis
- 12.1.12 VOCZero Ltd
- 12.1.12.1. Company Overview
- 12.1.12.2. Products
- 12.1.12.3. Company Financials
- 12.1.12.4. SWOT Analysis
- 12.1.1 Cool Sorption A/S
- 12.2. Market Entropy
- 12.2.1 Company's Key Areas Served
- 12.2.2 Recent Developments
- 12.3. Company Market Share Analysis 2025
- 12.3.1 Top 5 Companies Market Share Analysis
- 12.3.2 Top 3 Companies Market Share Analysis
- 12.4. List of Potential Customers
- 13. Research Methodology
List of Figures
- Figure 1: Global Vapor Recovery Units Industry Revenue Breakdown (billion, %) by Region 2025 & 2033
- Figure 2: North America Vapor Recovery Units Industry Revenue (billion), by Application 2025 & 2033
- Figure 3: North America Vapor Recovery Units Industry Revenue Share (%), by Application 2025 & 2033
- Figure 4: North America Vapor Recovery Units Industry Revenue (billion), by End-User 2025 & 2033
- Figure 5: North America Vapor Recovery Units Industry Revenue Share (%), by End-User 2025 & 2033
- Figure 6: North America Vapor Recovery Units Industry Revenue (billion), by Country 2025 & 2033
- Figure 7: North America Vapor Recovery Units Industry Revenue Share (%), by Country 2025 & 2033
- Figure 8: Europe Vapor Recovery Units Industry Revenue (billion), by Application 2025 & 2033
- Figure 9: Europe Vapor Recovery Units Industry Revenue Share (%), by Application 2025 & 2033
- Figure 10: Europe Vapor Recovery Units Industry Revenue (billion), by End-User 2025 & 2033
- Figure 11: Europe Vapor Recovery Units Industry Revenue Share (%), by End-User 2025 & 2033
- Figure 12: Europe Vapor Recovery Units Industry Revenue (billion), by Country 2025 & 2033
- Figure 13: Europe Vapor Recovery Units Industry Revenue Share (%), by Country 2025 & 2033
- Figure 14: Asia Pacific Vapor Recovery Units Industry Revenue (billion), by Application 2025 & 2033
- Figure 15: Asia Pacific Vapor Recovery Units Industry Revenue Share (%), by Application 2025 & 2033
- Figure 16: Asia Pacific Vapor Recovery Units Industry Revenue (billion), by End-User 2025 & 2033
- Figure 17: Asia Pacific Vapor Recovery Units Industry Revenue Share (%), by End-User 2025 & 2033
- Figure 18: Asia Pacific Vapor Recovery Units Industry Revenue (billion), by Country 2025 & 2033
- Figure 19: Asia Pacific Vapor Recovery Units Industry Revenue Share (%), by Country 2025 & 2033
- Figure 20: South America Vapor Recovery Units Industry Revenue (billion), by Application 2025 & 2033
- Figure 21: South America Vapor Recovery Units Industry Revenue Share (%), by Application 2025 & 2033
- Figure 22: South America Vapor Recovery Units Industry Revenue (billion), by End-User 2025 & 2033
- Figure 23: South America Vapor Recovery Units Industry Revenue Share (%), by End-User 2025 & 2033
- Figure 24: South America Vapor Recovery Units Industry Revenue (billion), by Country 2025 & 2033
- Figure 25: South America Vapor Recovery Units Industry Revenue Share (%), by Country 2025 & 2033
- Figure 26: Middle East and Africa Vapor Recovery Units Industry Revenue (billion), by Application 2025 & 2033
- Figure 27: Middle East and Africa Vapor Recovery Units Industry Revenue Share (%), by Application 2025 & 2033
- Figure 28: Middle East and Africa Vapor Recovery Units Industry Revenue (billion), by End-User 2025 & 2033
- Figure 29: Middle East and Africa Vapor Recovery Units Industry Revenue Share (%), by End-User 2025 & 2033
- Figure 30: Middle East and Africa Vapor Recovery Units Industry Revenue (billion), by Country 2025 & 2033
- Figure 31: Middle East and Africa Vapor Recovery Units Industry Revenue Share (%), by Country 2025 & 2033
List of Tables
- Table 1: Global Vapor Recovery Units Industry Revenue billion Forecast, by Application 2020 & 2033
- Table 2: Global Vapor Recovery Units Industry Revenue billion Forecast, by End-User 2020 & 2033
- Table 3: Global Vapor Recovery Units Industry Revenue billion Forecast, by Region 2020 & 2033
- Table 4: Global Vapor Recovery Units Industry Revenue billion Forecast, by Application 2020 & 2033
- Table 5: Global Vapor Recovery Units Industry Revenue billion Forecast, by End-User 2020 & 2033
- Table 6: Global Vapor Recovery Units Industry Revenue billion Forecast, by Country 2020 & 2033
- Table 7: Global Vapor Recovery Units Industry Revenue billion Forecast, by Application 2020 & 2033
- Table 8: Global Vapor Recovery Units Industry Revenue billion Forecast, by End-User 2020 & 2033
- Table 9: Global Vapor Recovery Units Industry Revenue billion Forecast, by Country 2020 & 2033
- Table 10: Global Vapor Recovery Units Industry Revenue billion Forecast, by Application 2020 & 2033
- Table 11: Global Vapor Recovery Units Industry Revenue billion Forecast, by End-User 2020 & 2033
- Table 12: Global Vapor Recovery Units Industry Revenue billion Forecast, by Country 2020 & 2033
- Table 13: Global Vapor Recovery Units Industry Revenue billion Forecast, by Application 2020 & 2033
- Table 14: Global Vapor Recovery Units Industry Revenue billion Forecast, by End-User 2020 & 2033
- Table 15: Global Vapor Recovery Units Industry Revenue billion Forecast, by Country 2020 & 2033
- Table 16: Global Vapor Recovery Units Industry Revenue billion Forecast, by Application 2020 & 2033
- Table 17: Global Vapor Recovery Units Industry Revenue billion Forecast, by End-User 2020 & 2033
- Table 18: Global Vapor Recovery Units Industry Revenue billion Forecast, by Country 2020 & 2033
Frequently Asked Questions
1. What is the projected Compound Annual Growth Rate (CAGR) of the Vapor Recovery Units Industry?
The projected CAGR is approximately 6.11%.
2. Which companies are prominent players in the Vapor Recovery Units Industry?
Key companies in the market include Cool Sorption A/S, FLOGISTIX LP, BORSIG Membrane Technology GmbH, Zeeco Inc, ALMA CARBOVAC, Kappa GI, John Zink Company LLC, Kilburn Engineering Ltd*List Not Exhaustive, AEREON, Symex GmbH & Co KG, Hy-Bon Engineering Company Inc, VOCZero Ltd.
3. What are the main segments of the Vapor Recovery Units Industry?
The market segments include Application, End-User.
4. Can you provide details about the market size?
The market size is estimated to be USD 0.94 billion as of 2022.
5. What are some drivers contributing to market growth?
4.; Rising Environmental Concerns and Energy Security in the Country4.; Increasing Focus on Renewable Energy.
6. What are the notable trends driving market growth?
Oil & gas Sector to Dominate the Market.
7. Are there any restraints impacting market growth?
4.; Availability of Abundance Natural Fossil Fuel Reserves.
8. Can you provide examples of recent developments in the market?
N/A
9. What pricing options are available for accessing the report?
Pricing options include single-user, multi-user, and enterprise licenses priced at USD 4750, USD 5250, and USD 8750 respectively.
10. Is the market size provided in terms of value or volume?
The market size is provided in terms of value, measured in billion.
11. Are there any specific market keywords associated with the report?
Yes, the market keyword associated with the report is "Vapor Recovery Units Industry," which aids in identifying and referencing the specific market segment covered.
12. How do I determine which pricing option suits my needs best?
The pricing options vary based on user requirements and access needs. Individual users may opt for single-user licenses, while businesses requiring broader access may choose multi-user or enterprise licenses for cost-effective access to the report.
13. Are there any additional resources or data provided in the Vapor Recovery Units Industry report?
While the report offers comprehensive insights, it's advisable to review the specific contents or supplementary materials provided to ascertain if additional resources or data are available.
14. How can I stay updated on further developments or reports in the Vapor Recovery Units Industry?
To stay informed about further developments, trends, and reports in the Vapor Recovery Units Industry, consider subscribing to industry newsletters, following relevant companies and organizations, or regularly checking reputable industry news sources and publications.
Methodology
Step 1 - Identification of Relevant Samples Size from Population Database


Step 2 - Approaches for Defining Global Market Size (Value, Volume* & Price*)

Note*: In applicable scenarios
Step 3 - Data Sources
Primary Research
- Web Analytics
- Survey Reports
- Research Institute
- Latest Research Reports
- Opinion Leaders
Secondary Research
- Annual Reports
- White Paper
- Latest Press Release
- Industry Association
- Paid Database
- Investor Presentations

Step 4 - Data Triangulation
Involves using different sources of information in order to increase the validity of a study
These sources are likely to be stakeholders in a program - participants, other researchers, program staff, other community members, and so on.
Then we put all data in single framework & apply various statistical tools to find out the dynamic on the market.
During the analysis stage, feedback from the stakeholder groups would be compared to determine areas of agreement as well as areas of divergence