

Key Insights
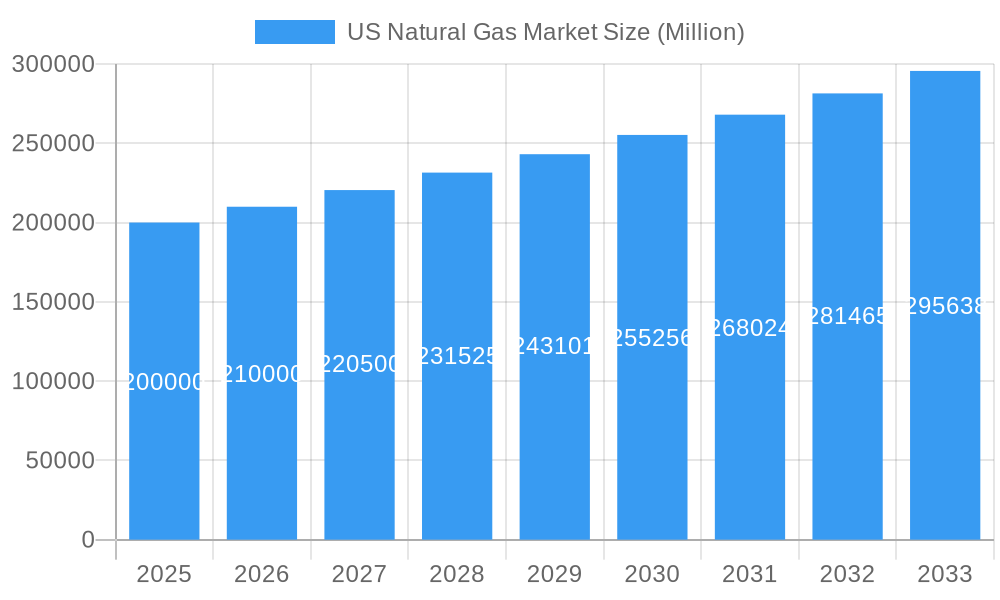
The U.S. natural gas market is projected for substantial growth, with a Compound Annual Growth Rate (CAGR) of 3.5% from 2025 to 2033. The market size is estimated at $473.4 billion in the base year 2025. Key drivers of this expansion include increased demand from the power generation sector, driven by the shift from coal and the requirement for dependable electricity. The growing adoption of Compressed Natural Gas (CNG) vehicles in the automotive industry, alongside consistent residential and industrial consumption, further fuels market expansion. Technological progress in natural gas extraction and infrastructure development is vital for efficient supply and distribution.
US Natural Gas Market Market Size (In Billion)
Challenges include environmental concerns regarding methane emissions and natural gas price volatility. While the Northeast, Southeast, Midwest, Southwest, and West regions are significant contributors, regional demand and infrastructure will shape growth. Leading companies such as Occidental Petroleum, Shell, and ExxonMobil are actively influencing the market through investments and operational enhancements. Market segmentation highlights contributions from both wet and dry natural gas, with power generation as the primary end-use sector. The 2025-2033 forecast period offers opportunities for growth and innovation, emphasizing energy security and cleaner energy solutions. Addressing environmental impacts and price fluctuations is crucial for sustained market development.
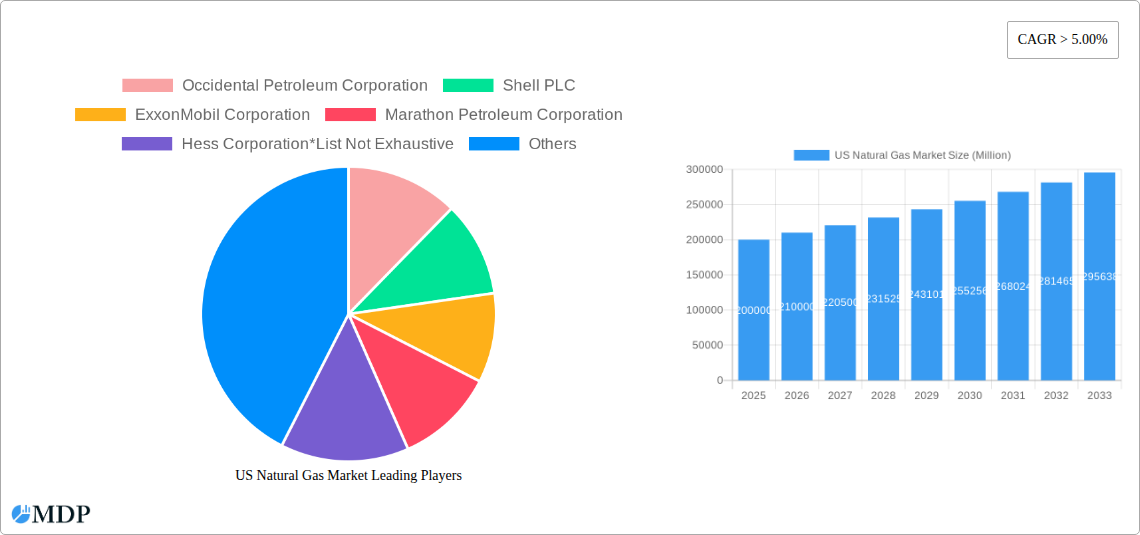
US Natural Gas Market Company Market Share
US Natural Gas Market Report: 2019-2033 Forecast
This comprehensive report provides an in-depth analysis of the US Natural Gas Market, covering historical data (2019-2024), the base year (2025), and a detailed forecast from 2025-2033. It offers actionable insights for industry stakeholders, investors, and businesses operating within this dynamic sector. Maximize your understanding of market trends, competitive landscapes, and future growth potential. This report leverages key data points and incorporates recent industry developments to provide a clear, concise, and highly relevant overview. Download now to gain a competitive edge.
US Natural Gas Market Dynamics & Concentration
The US natural gas market exhibits a moderately concentrated structure, with key players like Occidental Petroleum Corporation, Shell PLC, ExxonMobil Corporation, Marathon Petroleum Corporation, Hess Corporation, ConocoPhillips, Chevron Corporation, TotalEnergies SE, Phillips 66, EOG Resources Inc and others holding significant market share. Market concentration is influenced by factors such as economies of scale, access to resources, and technological capabilities. The market has witnessed considerable M&A activity in recent years, with xx deals recorded between 2019 and 2024, driven by a desire for consolidation and expansion. Innovation in extraction technologies, pipeline infrastructure, and LNG export capabilities continues to shape the market. Stringent environmental regulations and the increasing demand for cleaner energy sources are key regulatory influences. Competition from renewable energy sources, such as solar and wind power, presents a significant challenge. End-user trends are shifting towards increased adoption of natural gas in power generation and industrial applications.
- Market Share: The top five players collectively hold approximately xx% of the market share.
- M&A Activity: xx deals completed between 2019 and 2024, primarily driven by consolidation and expansion.
- Innovation Drivers: Technological advancements in extraction, processing, and transportation.
- Regulatory Framework: Environmental regulations impacting extraction and transportation.
US Natural Gas Market Industry Trends & Analysis
The US natural gas market is projected to experience a Compound Annual Growth Rate (CAGR) of xx% during the forecast period (2025-2033). This growth is fueled by several factors, including increasing demand from the power generation sector, the growing adoption of natural gas vehicles, and the robust industrial demand. Technological disruptions, such as the advancement of hydraulic fracturing and horizontal drilling techniques, have significantly increased natural gas production. Consumer preferences are shifting towards cleaner energy options, with natural gas being perceived as a transition fuel. However, competitive dynamics are intense, with increasing competition from renewable energy sources and ongoing price volatility influencing market growth. Market penetration is steadily increasing in both residential and commercial sectors, further contributing to the overall market growth. The increasing adoption of natural gas in industrial processes, particularly in the chemical and manufacturing industries, is also a significant growth driver. The overall competitiveness of the market is maintained by continuous technological advancements, price fluctuations, and government policies.
Leading Markets & Segments in US Natural Gas Market
The power generation sector accounts for the largest share of natural gas consumption, making it the dominant end-use segment. Dry natural gas constitutes the larger portion of the type segment. The leading regions for natural gas production and consumption are concentrated in the south central and Appalachian basins.
Key Drivers for Dominant Segments:
- Power Generation: High demand for reliable and relatively affordable power generation.
- Dry Natural Gas: Lower processing costs and suitability for various applications.
- South Central Region: Abundant reserves and well-established infrastructure.
Dominance Analysis: The South Central region's dominance is attributed to large-scale reserves and a mature pipeline infrastructure facilitating efficient transportation and distribution. The power generation sector's leadership reflects its significant reliance on natural gas as a fuel source for electricity production.
US Natural Gas Market Product Developments
Recent product developments focus on improving efficiency and sustainability within the natural gas value chain. This includes advancements in drilling and extraction techniques (improving yield & lowering costs), enhanced processing technologies (producing cleaner natural gas), and the development of more efficient pipeline infrastructure (reducing transportation losses). These innovations provide competitive advantages by optimizing resource utilization, reducing environmental impact, and ensuring a reliable supply. The market is witnessing a shift towards cleaner gas technologies to reduce emissions.
Key Drivers of US Natural Gas Market Growth
Several factors contribute to the growth of the US natural gas market. Technological advancements in shale gas extraction techniques (such as hydraulic fracturing) have significantly increased production capacity. Economic growth and rising energy demand, particularly in the industrial and power generation sectors, fuel continued consumption. Government policies supporting domestic natural gas production and infrastructure development further encourage market expansion. Furthermore, the relatively lower carbon footprint compared to other fossil fuels positions natural gas favorably in the energy transition.
Challenges in the US Natural Gas Market
The US natural gas market faces challenges such as price volatility due to supply and demand fluctuations. Regulatory hurdles related to environmental concerns and pipeline infrastructure development often slow growth and create uncertainty. Supply chain disruptions can impact production and distribution, causing market instability. Increased competition from renewable energy sources also poses a significant challenge, requiring ongoing adaptation and innovation within the industry. These factors impose quantifiable impacts, such as increased production costs and reduced market profitability.
Emerging Opportunities in US Natural Gas Market
Long-term growth is supported by several emerging opportunities. Technological breakthroughs in carbon capture and storage technologies offer avenues for mitigating environmental concerns and expanding the use of natural gas. Strategic partnerships between natural gas producers, infrastructure developers, and technology providers create collaborative opportunities for market expansion. Developing international trade and export capacities can further unlock new growth potential by tapping into global demand.
Leading Players in the US Natural Gas Market Sector
- Occidental Petroleum Corporation
- Shell PLC
- ExxonMobil Corporation
- Marathon Petroleum Corporation
- Hess Corporation
- ConocoPhillips
- Chevron Corporation
- TotalEnergies SE
- Phillips 66
- EOG Resources Inc
Key Milestones in US Natural Gas Market Industry
- May 2022: FERC approves three projects to increase US natural gas export capacity via pipeline and LNG, including the Evangeline Pass Expansion Project (1.1 Billion cubic feet).
- April 2022: TotalEnergies announces Cameron LNG expansion, adding a fourth train with 6.75 Million metric tons per annum capacity and increasing existing production by 5%.
Strategic Outlook for US Natural Gas Market Market
The US natural gas market is poised for continued growth, driven by consistent demand from various sectors and ongoing technological advancements. Strategic opportunities lie in focusing on efficient and sustainable practices, technological innovation, and strategic partnerships to enhance market position and capture future growth potential. Focusing on cleaner energy technologies and infrastructure development will be crucial for long-term market success.
US Natural Gas Market Segmentation
-
1. Type
- 1.1. Wet Natural Gas
- 1.2. Dry Natural Gas
-
2. End Use
- 2.1. Power Generation
- 2.2. Automotive
- 2.3. Residential
- 2.4. Industries
US Natural Gas Market Segmentation By Geography
-
1. North America
- 1.1. United States
- 1.2. Canada
- 1.3. Mexico
-
2. South America
- 2.1. Brazil
- 2.2. Argentina
- 2.3. Rest of South America
-
3. Europe
- 3.1. United Kingdom
- 3.2. Germany
- 3.3. France
- 3.4. Italy
- 3.5. Spain
- 3.6. Russia
- 3.7. Benelux
- 3.8. Nordics
- 3.9. Rest of Europe
-
4. Middle East & Africa
- 4.1. Turkey
- 4.2. Israel
- 4.3. GCC
- 4.4. North Africa
- 4.5. South Africa
- 4.6. Rest of Middle East & Africa
-
5. Asia Pacific
- 5.1. China
- 5.2. India
- 5.3. Japan
- 5.4. South Korea
- 5.5. ASEAN
- 5.6. Oceania
- 5.7. Rest of Asia Pacific
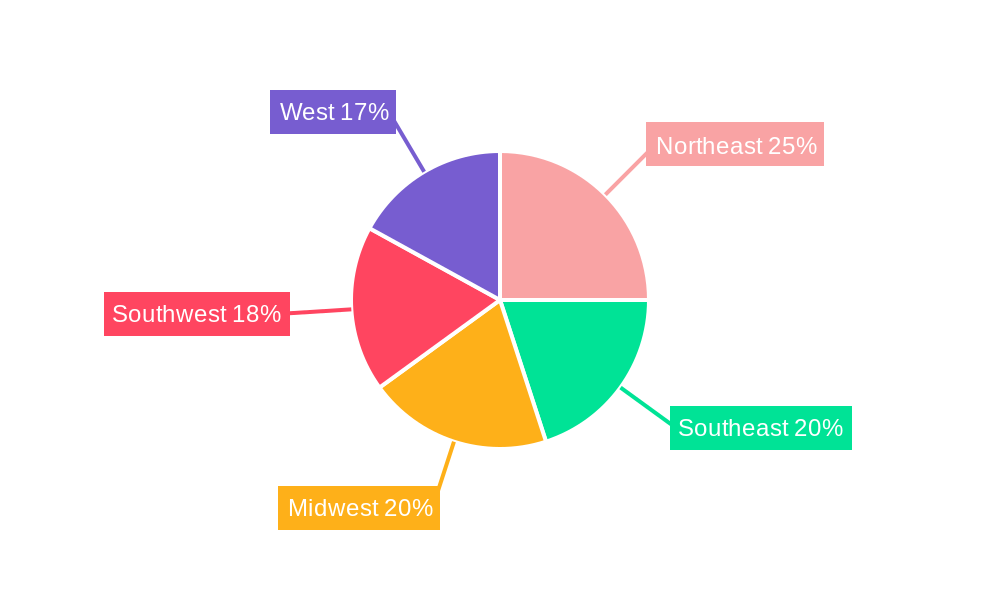
US Natural Gas Market Regional Market Share
Geographic Coverage of US Natural Gas Market
US Natural Gas Market REPORT HIGHLIGHTS
| Aspects | Details |
|---|---|
| Study Period | 2020-2034 |
| Base Year | 2025 |
| Estimated Year | 2026 |
| Forecast Period | 2026-2034 |
| Historical Period | 2020-2025 |
| Growth Rate | CAGR of 3.5% from 2020-2034 |
| Segmentation |
|
Table of Contents
- 1. Introduction
- 1.1. Research Scope
- 1.2. Market Segmentation
- 1.3. Research Objective
- 1.4. Definitions and Assumptions
- 2. Executive Summary
- 2.1. Market Snapshot
- 3. Market Dynamics
- 3.1. Market Drivers
- 3.2. Market Restrains
- 3.3. Market Trends
- 3.4. Market Opportunities
- 4. Market Factor Analysis
- 4.1. Porters Five Forces
- 4.1.1. Bargaining Power of Suppliers
- 4.1.2. Bargaining Power of Buyers
- 4.1.3. Threat of New Entrants
- 4.1.4. Threat of Substitutes
- 4.1.5. Competitive Rivalry
- 4.2. PESTEL analysis
- 4.3. BCG Analysis
- 4.3.1. Stars (High Growth, High Market Share)
- 4.3.2. Cash Cows (Low Growth, High Market Share)
- 4.3.3. Question Mark (High Growth, Low Market Share)
- 4.3.4. Dogs (Low Growth, Low Market Share)
- 4.4. Ansoff Matrix Analysis
- 4.5. Supply Chain Analysis
- 4.6. Regulatory Landscape
- 4.7. Current Market Potential and Opportunity Assessment (TAM–SAM–SOM Framework)
- 4.8. MDP Analyst Note
- 4.1. Porters Five Forces
- 5. Market Analysis, Insights and Forecast 2021-2033
- 5.1. Market Analysis, Insights and Forecast - by Type
- 5.1.1. Wet Natural Gas
- 5.1.2. Dry Natural Gas
- 5.2. Market Analysis, Insights and Forecast - by End Use
- 5.2.1. Power Generation
- 5.2.2. Automotive
- 5.2.3. Residential
- 5.2.4. Industries
- 5.3. Market Analysis, Insights and Forecast - by Region
- 5.3.1. North America
- 5.3.2. South America
- 5.3.3. Europe
- 5.3.4. Middle East & Africa
- 5.3.5. Asia Pacific
- 5.1. Market Analysis, Insights and Forecast - by Type
- 6. Global US Natural Gas Market Analysis, Insights and Forecast, 2021-2033
- 6.1. Market Analysis, Insights and Forecast - by Type
- 6.1.1. Wet Natural Gas
- 6.1.2. Dry Natural Gas
- 6.2. Market Analysis, Insights and Forecast - by End Use
- 6.2.1. Power Generation
- 6.2.2. Automotive
- 6.2.3. Residential
- 6.2.4. Industries
- 6.1. Market Analysis, Insights and Forecast - by Type
- 7. North America US Natural Gas Market Analysis, Insights and Forecast, 2020-2032
- 7.1. Market Analysis, Insights and Forecast - by Type
- 7.1.1. Wet Natural Gas
- 7.1.2. Dry Natural Gas
- 7.2. Market Analysis, Insights and Forecast - by End Use
- 7.2.1. Power Generation
- 7.2.2. Automotive
- 7.2.3. Residential
- 7.2.4. Industries
- 7.1. Market Analysis, Insights and Forecast - by Type
- 8. South America US Natural Gas Market Analysis, Insights and Forecast, 2020-2032
- 8.1. Market Analysis, Insights and Forecast - by Type
- 8.1.1. Wet Natural Gas
- 8.1.2. Dry Natural Gas
- 8.2. Market Analysis, Insights and Forecast - by End Use
- 8.2.1. Power Generation
- 8.2.2. Automotive
- 8.2.3. Residential
- 8.2.4. Industries
- 8.1. Market Analysis, Insights and Forecast - by Type
- 9. Europe US Natural Gas Market Analysis, Insights and Forecast, 2020-2032
- 9.1. Market Analysis, Insights and Forecast - by Type
- 9.1.1. Wet Natural Gas
- 9.1.2. Dry Natural Gas
- 9.2. Market Analysis, Insights and Forecast - by End Use
- 9.2.1. Power Generation
- 9.2.2. Automotive
- 9.2.3. Residential
- 9.2.4. Industries
- 9.1. Market Analysis, Insights and Forecast - by Type
- 10. Middle East & Africa US Natural Gas Market Analysis, Insights and Forecast, 2020-2032
- 10.1. Market Analysis, Insights and Forecast - by Type
- 10.1.1. Wet Natural Gas
- 10.1.2. Dry Natural Gas
- 10.2. Market Analysis, Insights and Forecast - by End Use
- 10.2.1. Power Generation
- 10.2.2. Automotive
- 10.2.3. Residential
- 10.2.4. Industries
- 10.1. Market Analysis, Insights and Forecast - by Type
- 11. Asia Pacific US Natural Gas Market Analysis, Insights and Forecast, 2020-2032
- 11.1. Market Analysis, Insights and Forecast - by Type
- 11.1.1. Wet Natural Gas
- 11.1.2. Dry Natural Gas
- 11.2. Market Analysis, Insights and Forecast - by End Use
- 11.2.1. Power Generation
- 11.2.2. Automotive
- 11.2.3. Residential
- 11.2.4. Industries
- 11.1. Market Analysis, Insights and Forecast - by Type
- 12. Competitive Analysis
- 12.1. Company Profiles
- 12.1.1 Occidental Petroleum Corporation
- 12.1.1.1. Company Overview
- 12.1.1.2. Products
- 12.1.1.3. Company Financials
- 12.1.1.4. SWOT Analysis
- 12.1.2 Shell PLC
- 12.1.2.1. Company Overview
- 12.1.2.2. Products
- 12.1.2.3. Company Financials
- 12.1.2.4. SWOT Analysis
- 12.1.3 ExxonMobil Corporation
- 12.1.3.1. Company Overview
- 12.1.3.2. Products
- 12.1.3.3. Company Financials
- 12.1.3.4. SWOT Analysis
- 12.1.4 Marathon Petroleum Corporation
- 12.1.4.1. Company Overview
- 12.1.4.2. Products
- 12.1.4.3. Company Financials
- 12.1.4.4. SWOT Analysis
- 12.1.5 Hess Corporation*List Not Exhaustive
- 12.1.5.1. Company Overview
- 12.1.5.2. Products
- 12.1.5.3. Company Financials
- 12.1.5.4. SWOT Analysis
- 12.1.6 ConocoPhillips
- 12.1.6.1. Company Overview
- 12.1.6.2. Products
- 12.1.6.3. Company Financials
- 12.1.6.4. SWOT Analysis
- 12.1.7 Chevron Corporation
- 12.1.7.1. Company Overview
- 12.1.7.2. Products
- 12.1.7.3. Company Financials
- 12.1.7.4. SWOT Analysis
- 12.1.8 TotalEnergies SE
- 12.1.8.1. Company Overview
- 12.1.8.2. Products
- 12.1.8.3. Company Financials
- 12.1.8.4. SWOT Analysis
- 12.1.9 Phillips
- 12.1.9.1. Company Overview
- 12.1.9.2. Products
- 12.1.9.3. Company Financials
- 12.1.9.4. SWOT Analysis
- 12.1.10 EOG Resources Inc
- 12.1.10.1. Company Overview
- 12.1.10.2. Products
- 12.1.10.3. Company Financials
- 12.1.10.4. SWOT Analysis
- 12.1.1 Occidental Petroleum Corporation
- 12.2. Market Entropy
- 12.2.1 Company's Key Areas Served
- 12.2.2 Recent Developments
- 12.3. Company Market Share Analysis 2025
- 12.3.1 Top 5 Companies Market Share Analysis
- 12.3.2 Top 3 Companies Market Share Analysis
- 12.4. List of Potential Customers
- 13. Research Methodology
List of Figures
- Figure 1: Global US Natural Gas Market Revenue Breakdown (billion, %) by Region 2025 & 2033
- Figure 2: Global US Natural Gas Market Volume Breakdown (Tonnes, %) by Region 2025 & 2033
- Figure 3: North America US Natural Gas Market Revenue (billion), by Type 2025 & 2033
- Figure 4: North America US Natural Gas Market Volume (Tonnes), by Type 2025 & 2033
- Figure 5: North America US Natural Gas Market Revenue Share (%), by Type 2025 & 2033
- Figure 6: North America US Natural Gas Market Volume Share (%), by Type 2025 & 2033
- Figure 7: North America US Natural Gas Market Revenue (billion), by End Use 2025 & 2033
- Figure 8: North America US Natural Gas Market Volume (Tonnes), by End Use 2025 & 2033
- Figure 9: North America US Natural Gas Market Revenue Share (%), by End Use 2025 & 2033
- Figure 10: North America US Natural Gas Market Volume Share (%), by End Use 2025 & 2033
- Figure 11: North America US Natural Gas Market Revenue (billion), by Country 2025 & 2033
- Figure 12: North America US Natural Gas Market Volume (Tonnes), by Country 2025 & 2033
- Figure 13: North America US Natural Gas Market Revenue Share (%), by Country 2025 & 2033
- Figure 14: North America US Natural Gas Market Volume Share (%), by Country 2025 & 2033
- Figure 15: South America US Natural Gas Market Revenue (billion), by Type 2025 & 2033
- Figure 16: South America US Natural Gas Market Volume (Tonnes), by Type 2025 & 2033
- Figure 17: South America US Natural Gas Market Revenue Share (%), by Type 2025 & 2033
- Figure 18: South America US Natural Gas Market Volume Share (%), by Type 2025 & 2033
- Figure 19: South America US Natural Gas Market Revenue (billion), by End Use 2025 & 2033
- Figure 20: South America US Natural Gas Market Volume (Tonnes), by End Use 2025 & 2033
- Figure 21: South America US Natural Gas Market Revenue Share (%), by End Use 2025 & 2033
- Figure 22: South America US Natural Gas Market Volume Share (%), by End Use 2025 & 2033
- Figure 23: South America US Natural Gas Market Revenue (billion), by Country 2025 & 2033
- Figure 24: South America US Natural Gas Market Volume (Tonnes), by Country 2025 & 2033
- Figure 25: South America US Natural Gas Market Revenue Share (%), by Country 2025 & 2033
- Figure 26: South America US Natural Gas Market Volume Share (%), by Country 2025 & 2033
- Figure 27: Europe US Natural Gas Market Revenue (billion), by Type 2025 & 2033
- Figure 28: Europe US Natural Gas Market Volume (Tonnes), by Type 2025 & 2033
- Figure 29: Europe US Natural Gas Market Revenue Share (%), by Type 2025 & 2033
- Figure 30: Europe US Natural Gas Market Volume Share (%), by Type 2025 & 2033
- Figure 31: Europe US Natural Gas Market Revenue (billion), by End Use 2025 & 2033
- Figure 32: Europe US Natural Gas Market Volume (Tonnes), by End Use 2025 & 2033
- Figure 33: Europe US Natural Gas Market Revenue Share (%), by End Use 2025 & 2033
- Figure 34: Europe US Natural Gas Market Volume Share (%), by End Use 2025 & 2033
- Figure 35: Europe US Natural Gas Market Revenue (billion), by Country 2025 & 2033
- Figure 36: Europe US Natural Gas Market Volume (Tonnes), by Country 2025 & 2033
- Figure 37: Europe US Natural Gas Market Revenue Share (%), by Country 2025 & 2033
- Figure 38: Europe US Natural Gas Market Volume Share (%), by Country 2025 & 2033
- Figure 39: Middle East & Africa US Natural Gas Market Revenue (billion), by Type 2025 & 2033
- Figure 40: Middle East & Africa US Natural Gas Market Volume (Tonnes), by Type 2025 & 2033
- Figure 41: Middle East & Africa US Natural Gas Market Revenue Share (%), by Type 2025 & 2033
- Figure 42: Middle East & Africa US Natural Gas Market Volume Share (%), by Type 2025 & 2033
- Figure 43: Middle East & Africa US Natural Gas Market Revenue (billion), by End Use 2025 & 2033
- Figure 44: Middle East & Africa US Natural Gas Market Volume (Tonnes), by End Use 2025 & 2033
- Figure 45: Middle East & Africa US Natural Gas Market Revenue Share (%), by End Use 2025 & 2033
- Figure 46: Middle East & Africa US Natural Gas Market Volume Share (%), by End Use 2025 & 2033
- Figure 47: Middle East & Africa US Natural Gas Market Revenue (billion), by Country 2025 & 2033
- Figure 48: Middle East & Africa US Natural Gas Market Volume (Tonnes), by Country 2025 & 2033
- Figure 49: Middle East & Africa US Natural Gas Market Revenue Share (%), by Country 2025 & 2033
- Figure 50: Middle East & Africa US Natural Gas Market Volume Share (%), by Country 2025 & 2033
- Figure 51: Asia Pacific US Natural Gas Market Revenue (billion), by Type 2025 & 2033
- Figure 52: Asia Pacific US Natural Gas Market Volume (Tonnes), by Type 2025 & 2033
- Figure 53: Asia Pacific US Natural Gas Market Revenue Share (%), by Type 2025 & 2033
- Figure 54: Asia Pacific US Natural Gas Market Volume Share (%), by Type 2025 & 2033
- Figure 55: Asia Pacific US Natural Gas Market Revenue (billion), by End Use 2025 & 2033
- Figure 56: Asia Pacific US Natural Gas Market Volume (Tonnes), by End Use 2025 & 2033
- Figure 57: Asia Pacific US Natural Gas Market Revenue Share (%), by End Use 2025 & 2033
- Figure 58: Asia Pacific US Natural Gas Market Volume Share (%), by End Use 2025 & 2033
- Figure 59: Asia Pacific US Natural Gas Market Revenue (billion), by Country 2025 & 2033
- Figure 60: Asia Pacific US Natural Gas Market Volume (Tonnes), by Country 2025 & 2033
- Figure 61: Asia Pacific US Natural Gas Market Revenue Share (%), by Country 2025 & 2033
- Figure 62: Asia Pacific US Natural Gas Market Volume Share (%), by Country 2025 & 2033
List of Tables
- Table 1: Global US Natural Gas Market Revenue billion Forecast, by Type 2020 & 2033
- Table 2: Global US Natural Gas Market Volume Tonnes Forecast, by Type 2020 & 2033
- Table 3: Global US Natural Gas Market Revenue billion Forecast, by End Use 2020 & 2033
- Table 4: Global US Natural Gas Market Volume Tonnes Forecast, by End Use 2020 & 2033
- Table 5: Global US Natural Gas Market Revenue billion Forecast, by Region 2020 & 2033
- Table 6: Global US Natural Gas Market Volume Tonnes Forecast, by Region 2020 & 2033
- Table 7: Global US Natural Gas Market Revenue billion Forecast, by Type 2020 & 2033
- Table 8: Global US Natural Gas Market Volume Tonnes Forecast, by Type 2020 & 2033
- Table 9: Global US Natural Gas Market Revenue billion Forecast, by End Use 2020 & 2033
- Table 10: Global US Natural Gas Market Volume Tonnes Forecast, by End Use 2020 & 2033
- Table 11: Global US Natural Gas Market Revenue billion Forecast, by Country 2020 & 2033
- Table 12: Global US Natural Gas Market Volume Tonnes Forecast, by Country 2020 & 2033
- Table 13: United States US Natural Gas Market Revenue (billion) Forecast, by Application 2020 & 2033
- Table 14: United States US Natural Gas Market Volume (Tonnes) Forecast, by Application 2020 & 2033
- Table 15: Canada US Natural Gas Market Revenue (billion) Forecast, by Application 2020 & 2033
- Table 16: Canada US Natural Gas Market Volume (Tonnes) Forecast, by Application 2020 & 2033
- Table 17: Mexico US Natural Gas Market Revenue (billion) Forecast, by Application 2020 & 2033
- Table 18: Mexico US Natural Gas Market Volume (Tonnes) Forecast, by Application 2020 & 2033
- Table 19: Global US Natural Gas Market Revenue billion Forecast, by Type 2020 & 2033
- Table 20: Global US Natural Gas Market Volume Tonnes Forecast, by Type 2020 & 2033
- Table 21: Global US Natural Gas Market Revenue billion Forecast, by End Use 2020 & 2033
- Table 22: Global US Natural Gas Market Volume Tonnes Forecast, by End Use 2020 & 2033
- Table 23: Global US Natural Gas Market Revenue billion Forecast, by Country 2020 & 2033
- Table 24: Global US Natural Gas Market Volume Tonnes Forecast, by Country 2020 & 2033
- Table 25: Brazil US Natural Gas Market Revenue (billion) Forecast, by Application 2020 & 2033
- Table 26: Brazil US Natural Gas Market Volume (Tonnes) Forecast, by Application 2020 & 2033
- Table 27: Argentina US Natural Gas Market Revenue (billion) Forecast, by Application 2020 & 2033
- Table 28: Argentina US Natural Gas Market Volume (Tonnes) Forecast, by Application 2020 & 2033
- Table 29: Rest of South America US Natural Gas Market Revenue (billion) Forecast, by Application 2020 & 2033
- Table 30: Rest of South America US Natural Gas Market Volume (Tonnes) Forecast, by Application 2020 & 2033
- Table 31: Global US Natural Gas Market Revenue billion Forecast, by Type 2020 & 2033
- Table 32: Global US Natural Gas Market Volume Tonnes Forecast, by Type 2020 & 2033
- Table 33: Global US Natural Gas Market Revenue billion Forecast, by End Use 2020 & 2033
- Table 34: Global US Natural Gas Market Volume Tonnes Forecast, by End Use 2020 & 2033
- Table 35: Global US Natural Gas Market Revenue billion Forecast, by Country 2020 & 2033
- Table 36: Global US Natural Gas Market Volume Tonnes Forecast, by Country 2020 & 2033
- Table 37: United Kingdom US Natural Gas Market Revenue (billion) Forecast, by Application 2020 & 2033
- Table 38: United Kingdom US Natural Gas Market Volume (Tonnes) Forecast, by Application 2020 & 2033
- Table 39: Germany US Natural Gas Market Revenue (billion) Forecast, by Application 2020 & 2033
- Table 40: Germany US Natural Gas Market Volume (Tonnes) Forecast, by Application 2020 & 2033
- Table 41: France US Natural Gas Market Revenue (billion) Forecast, by Application 2020 & 2033
- Table 42: France US Natural Gas Market Volume (Tonnes) Forecast, by Application 2020 & 2033
- Table 43: Italy US Natural Gas Market Revenue (billion) Forecast, by Application 2020 & 2033
- Table 44: Italy US Natural Gas Market Volume (Tonnes) Forecast, by Application 2020 & 2033
- Table 45: Spain US Natural Gas Market Revenue (billion) Forecast, by Application 2020 & 2033
- Table 46: Spain US Natural Gas Market Volume (Tonnes) Forecast, by Application 2020 & 2033
- Table 47: Russia US Natural Gas Market Revenue (billion) Forecast, by Application 2020 & 2033
- Table 48: Russia US Natural Gas Market Volume (Tonnes) Forecast, by Application 2020 & 2033
- Table 49: Benelux US Natural Gas Market Revenue (billion) Forecast, by Application 2020 & 2033
- Table 50: Benelux US Natural Gas Market Volume (Tonnes) Forecast, by Application 2020 & 2033
- Table 51: Nordics US Natural Gas Market Revenue (billion) Forecast, by Application 2020 & 2033
- Table 52: Nordics US Natural Gas Market Volume (Tonnes) Forecast, by Application 2020 & 2033
- Table 53: Rest of Europe US Natural Gas Market Revenue (billion) Forecast, by Application 2020 & 2033
- Table 54: Rest of Europe US Natural Gas Market Volume (Tonnes) Forecast, by Application 2020 & 2033
- Table 55: Global US Natural Gas Market Revenue billion Forecast, by Type 2020 & 2033
- Table 56: Global US Natural Gas Market Volume Tonnes Forecast, by Type 2020 & 2033
- Table 57: Global US Natural Gas Market Revenue billion Forecast, by End Use 2020 & 2033
- Table 58: Global US Natural Gas Market Volume Tonnes Forecast, by End Use 2020 & 2033
- Table 59: Global US Natural Gas Market Revenue billion Forecast, by Country 2020 & 2033
- Table 60: Global US Natural Gas Market Volume Tonnes Forecast, by Country 2020 & 2033
- Table 61: Turkey US Natural Gas Market Revenue (billion) Forecast, by Application 2020 & 2033
- Table 62: Turkey US Natural Gas Market Volume (Tonnes) Forecast, by Application 2020 & 2033
- Table 63: Israel US Natural Gas Market Revenue (billion) Forecast, by Application 2020 & 2033
- Table 64: Israel US Natural Gas Market Volume (Tonnes) Forecast, by Application 2020 & 2033
- Table 65: GCC US Natural Gas Market Revenue (billion) Forecast, by Application 2020 & 2033
- Table 66: GCC US Natural Gas Market Volume (Tonnes) Forecast, by Application 2020 & 2033
- Table 67: North Africa US Natural Gas Market Revenue (billion) Forecast, by Application 2020 & 2033
- Table 68: North Africa US Natural Gas Market Volume (Tonnes) Forecast, by Application 2020 & 2033
- Table 69: South Africa US Natural Gas Market Revenue (billion) Forecast, by Application 2020 & 2033
- Table 70: South Africa US Natural Gas Market Volume (Tonnes) Forecast, by Application 2020 & 2033
- Table 71: Rest of Middle East & Africa US Natural Gas Market Revenue (billion) Forecast, by Application 2020 & 2033
- Table 72: Rest of Middle East & Africa US Natural Gas Market Volume (Tonnes) Forecast, by Application 2020 & 2033
- Table 73: Global US Natural Gas Market Revenue billion Forecast, by Type 2020 & 2033
- Table 74: Global US Natural Gas Market Volume Tonnes Forecast, by Type 2020 & 2033
- Table 75: Global US Natural Gas Market Revenue billion Forecast, by End Use 2020 & 2033
- Table 76: Global US Natural Gas Market Volume Tonnes Forecast, by End Use 2020 & 2033
- Table 77: Global US Natural Gas Market Revenue billion Forecast, by Country 2020 & 2033
- Table 78: Global US Natural Gas Market Volume Tonnes Forecast, by Country 2020 & 2033
- Table 79: China US Natural Gas Market Revenue (billion) Forecast, by Application 2020 & 2033
- Table 80: China US Natural Gas Market Volume (Tonnes) Forecast, by Application 2020 & 2033
- Table 81: India US Natural Gas Market Revenue (billion) Forecast, by Application 2020 & 2033
- Table 82: India US Natural Gas Market Volume (Tonnes) Forecast, by Application 2020 & 2033
- Table 83: Japan US Natural Gas Market Revenue (billion) Forecast, by Application 2020 & 2033
- Table 84: Japan US Natural Gas Market Volume (Tonnes) Forecast, by Application 2020 & 2033
- Table 85: South Korea US Natural Gas Market Revenue (billion) Forecast, by Application 2020 & 2033
- Table 86: South Korea US Natural Gas Market Volume (Tonnes) Forecast, by Application 2020 & 2033
- Table 87: ASEAN US Natural Gas Market Revenue (billion) Forecast, by Application 2020 & 2033
- Table 88: ASEAN US Natural Gas Market Volume (Tonnes) Forecast, by Application 2020 & 2033
- Table 89: Oceania US Natural Gas Market Revenue (billion) Forecast, by Application 2020 & 2033
- Table 90: Oceania US Natural Gas Market Volume (Tonnes) Forecast, by Application 2020 & 2033
- Table 91: Rest of Asia Pacific US Natural Gas Market Revenue (billion) Forecast, by Application 2020 & 2033
- Table 92: Rest of Asia Pacific US Natural Gas Market Volume (Tonnes) Forecast, by Application 2020 & 2033
Frequently Asked Questions
1. What is the projected Compound Annual Growth Rate (CAGR) of the US Natural Gas Market?
The projected CAGR is approximately 3.5%.
2. Which companies are prominent players in the US Natural Gas Market?
Key companies in the market include Occidental Petroleum Corporation, Shell PLC, ExxonMobil Corporation, Marathon Petroleum Corporation, Hess Corporation*List Not Exhaustive, ConocoPhillips, Chevron Corporation, TotalEnergies SE, Phillips, EOG Resources Inc.
3. What are the main segments of the US Natural Gas Market?
The market segments include Type, End Use.
4. Can you provide details about the market size?
The market size is estimated to be USD 473.4 billion as of 2022.
5. What are some drivers contributing to market growth?
Increasing Global Demand for Refined Petroleum Products4.; Economic Growth and Industrialization.
6. What are the notable trends driving market growth?
Power Generation Segment to Dominate the Market.
7. Are there any restraints impacting market growth?
Environmental Concerns and Regulations.
8. Can you provide examples of recent developments in the market?
May 2022: According to the US Energy Information Administration, the Natural Gas Pipeline Project Tracker was updated with recent approvals and completions of pipeline projects. As of the end of the first quarter of 2022, the Federal Energy Regulatory Commission (FERC) approved three projects to increase the export of US natural gas by pipeline and LNG. FERC approved two projects connecting LNG terminals in Louisiana. The Evangeline Pass Expansion Project, owned by Tennessee Gas Pipeline Company, is 1.1 billion cubic feet in size. It is intended that the proposed Plaquemines LNG Project in Plaquemines Parish, Louisiana, be supplied with natural gas by constructing 13.1 miles of new pipeline and two new compressor stations.
9. What pricing options are available for accessing the report?
Pricing options include single-user, multi-user, and enterprise licenses priced at USD 3800, USD 4500, and USD 5800 respectively.
10. Is the market size provided in terms of value or volume?
The market size is provided in terms of value, measured in billion and volume, measured in Tonnes.
11. Are there any specific market keywords associated with the report?
Yes, the market keyword associated with the report is "US Natural Gas Market," which aids in identifying and referencing the specific market segment covered.
12. How do I determine which pricing option suits my needs best?
The pricing options vary based on user requirements and access needs. Individual users may opt for single-user licenses, while businesses requiring broader access may choose multi-user or enterprise licenses for cost-effective access to the report.
13. Are there any additional resources or data provided in the US Natural Gas Market report?
While the report offers comprehensive insights, it's advisable to review the specific contents or supplementary materials provided to ascertain if additional resources or data are available.
14. How can I stay updated on further developments or reports in the US Natural Gas Market?
To stay informed about further developments, trends, and reports in the US Natural Gas Market, consider subscribing to industry newsletters, following relevant companies and organizations, or regularly checking reputable industry news sources and publications.
Methodology
Step 1 - Identification of Relevant Samples Size from Population Database


Step 2 - Approaches for Defining Global Market Size (Value, Volume* & Price*)

Note*: In applicable scenarios
Step 3 - Data Sources
Primary Research
- Web Analytics
- Survey Reports
- Research Institute
- Latest Research Reports
- Opinion Leaders
Secondary Research
- Annual Reports
- White Paper
- Latest Press Release
- Industry Association
- Paid Database
- Investor Presentations

Step 4 - Data Triangulation
Involves using different sources of information in order to increase the validity of a study
These sources are likely to be stakeholders in a program - participants, other researchers, program staff, other community members, and so on.
Then we put all data in single framework & apply various statistical tools to find out the dynamic on the market.
During the analysis stage, feedback from the stakeholder groups would be compared to determine areas of agreement as well as areas of divergence