

Key Insights
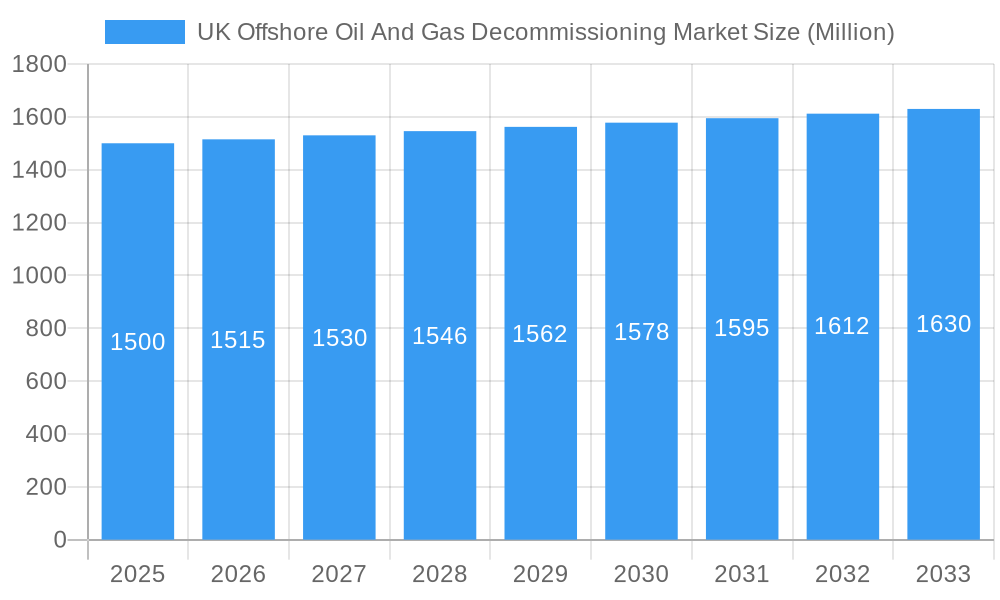
The UK offshore oil and gas decommissioning market is a significant and expanding sector, driven by the natural depletion of offshore fields and escalating regulatory demands for responsible infrastructure retirement. This market, valued at approximately £11.1 billion in 2025, is forecast to grow at a Compound Annual Growth Rate (CAGR) of 6.5%. This expansion is propelled by a substantial pipeline of decommissioning projects and a heightened emphasis on environmental stewardship. Key market segments include well plugging and abandonment (P&A), which dominates due to the sheer volume of wells requiring closure, and pipeline decommissioning, a segment experiencing increased demand owing to its inherent complexity and cost. Leading entities such as Veolia Environnement S.A., John Lawrie Group Ltd., AF Gruppen ASA, Ramboll Group A/S, Perenco SA, and Derrick Services (UK) Ltd are actively engaged, applying their specialized expertise in subsea engineering, waste management, and rig removal. Market growth is predominantly concentrated across England, Scotland, Wales, and Northern Ireland, reflecting the significant presence of offshore oil and gas assets within UK territorial waters. Despite challenges including volatile oil prices and the technical intricacies of deepwater decommissioning, the long-term outlook remains robust, supported by government backing for eco-friendly practices and the ongoing necessity for safe asset retirement.
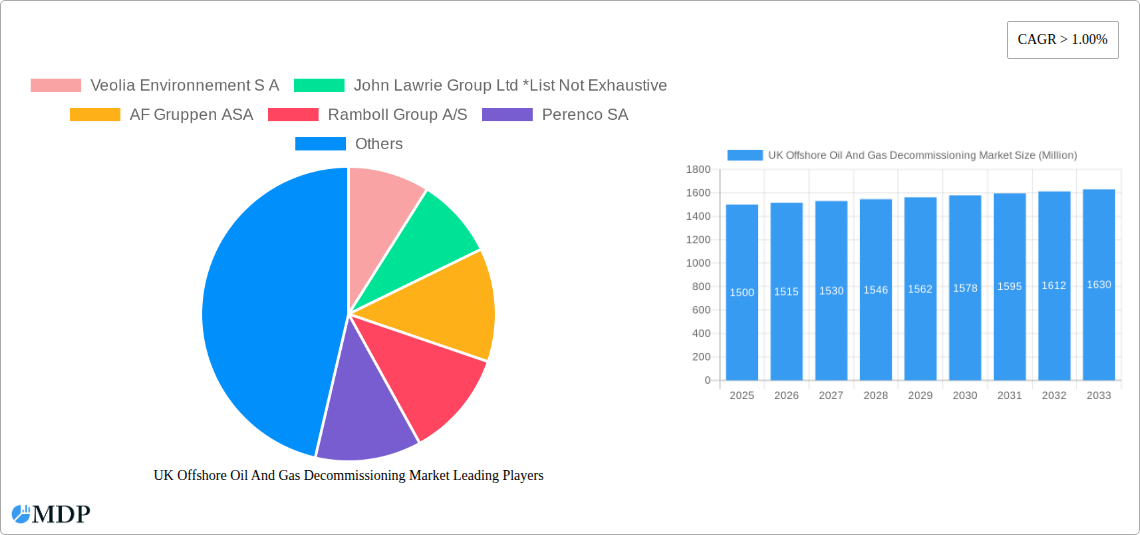
UK Offshore Oil And Gas Decommissioning Market Market Size (In Billion)
The projected growth trajectory over the next decade is supported by several critical factors. Firstly, a substantial number of aging offshore platforms and pipelines nearing the end of their operational lifespans will necessitate significant investment in decommissioning. Secondly, the UK government's stringent environmental regulations for offshore decommissioning and waste management are actively encouraging investment in sustainable and efficient solutions. Thirdly, continuous technological advancements, particularly in subsea decommissioning, are enhancing cost-effectiveness and safety protocols. This confluence of factors positions the UK offshore oil and gas decommissioning market as an attractive arena for investment and innovation, indicating a sustained period of steady growth beyond 2025. The considerable expertise cultivated within the UK sector also establishes it as a potential global leader in decommissioning operations, further stimulating growth and opportunity.
UK Offshore Oil And Gas Decommissioning Market Company Market Share
UK Offshore Oil & Gas Decommissioning Market: A Comprehensive Report (2019-2033)
This in-depth report provides a comprehensive analysis of the UK Offshore Oil & Gas Decommissioning market, offering invaluable insights for stakeholders across the energy sector. With a forecast period spanning 2025-2033 and a base year of 2025, this study covers historical data from 2019-2024, examining market dynamics, leading players, and future growth opportunities. The report reveals a market poised for significant expansion, driven by a substantial backlog of decommissioning projects and evolving technological advancements. Expect detailed breakdowns of market segments, key players, and crucial industry developments that will shape the future of this dynamic sector.
UK Offshore Oil And Gas Decommissioning Market Market Dynamics & Concentration
The UK offshore oil and gas decommissioning market is characterized by a moderate level of concentration, with several major players competing alongside numerous smaller specialized firms. Market share is currently distributed among these players, with the largest holding approximately xx% and the remaining xx% shared amongst other significant companies. Innovation in decommissioning technologies, particularly in areas like robotics and remotely operated vehicles (ROVs), is a major driver, while stringent regulatory frameworks, including those from the Oil and Gas Authority (OGA), shape operational practices and environmental compliance. The market witnesses continuous M&A activity, with xx major deals recorded between 2019 and 2024. These mergers and acquisitions primarily aim to consolidate expertise, resources, and market share within the sector. The substitution of traditional decommissioning methods with more efficient and environmentally friendly technologies is an ongoing process impacting market dynamics. End-user trends favor environmentally sustainable approaches, while increased regulatory scrutiny influences investment decisions.
- Market Concentration: Moderate, with a few key players holding significant shares.
- Innovation Drivers: Robotics, ROVs, and environmentally friendly technologies.
- Regulatory Framework: Stringent OGA regulations drive operational practices.
- Product Substitutes: Efficient and sustainable technologies gradually replacing traditional methods.
- End-User Trends: Growing emphasis on environmental sustainability.
- M&A Activity: xx major deals recorded between 2019 and 2024.
UK Offshore Oil And Gas Decommissioning Market Industry Trends & Analysis
The UK offshore oil and gas decommissioning market is experiencing robust growth, fueled by a substantial backlog of ageing infrastructure requiring decommissioning. The market is projected to witness a Compound Annual Growth Rate (CAGR) of xx% during the forecast period (2025-2033). This growth is primarily driven by increasing government mandates for environmental remediation, a surge in aging offshore assets necessitating decommissioning, and advancements in decommissioning technologies that make the process more efficient and cost-effective. Market penetration of new technologies, such as advanced robotics and AI-driven solutions, is steadily increasing. The rising demand for skilled labor continues to be a critical challenge. Competitive dynamics are characterized by fierce rivalry among established companies and the emergence of innovative startups, leading to continuous technological advancements and service diversification. The market is also influenced by fluctuating oil and gas prices and global economic conditions.
Leading Markets & Segments in UK Offshore Oil And Gas Decommissioning Market
The North Sea region dominates the UK offshore oil and gas decommissioning market. This is largely attributed to the high concentration of aging oil and gas infrastructure in the area.
Key Drivers for North Sea Dominance:
- High Density of Aging Assets: A significant number of mature and decommissioning-ready oil and gas installations.
- Government Policies: Regulatory frameworks and incentives supporting decommissioning initiatives.
- Established Infrastructure: Well-developed port facilities and logistical support systems facilitate decommissioning operations.
Segment Analysis:
- Plugging and Abandonment (P&A): This segment accounts for the largest share of the market due to its necessity in every decommissioning project, representing xx Million. Technological advancements in P&A techniques contribute to its expansion.
- Pipeline Decommissioning: This segment is also witnessing significant growth, reaching xx Million in 2025, propelled by the increasing length of pipelines requiring decommissioning.
- End-User: Both the Oil and Gas industries are key drivers of market growth, with the Oil Industry currently contributing xx Million and the Gas industry contributing xx Million in 2025.
UK Offshore Oil And Gas Decommissioning Market Product Developments
Recent innovations include the development of advanced robotics and automated systems for decommissioning tasks, including remotely operated vehicles (ROVs) and autonomous underwater vehicles (AUVs). These technologies improve efficiency, safety, and reduce environmental impact. Furthermore, new techniques for pipeline decommissioning, such as in-situ repurposing, are gaining traction. The market is also witnessing the adoption of advanced data analytics and simulation tools to optimize decommissioning plans and manage associated risks. This focus on efficiency, safety, and environmental responsibility is driving product development and market competition.
Key Drivers of UK Offshore Oil And Gas Decommissioning Market Growth
Several factors contribute to the market’s growth. Stringent environmental regulations mandate responsible decommissioning practices. The substantial number of aging offshore assets needing decommissioning creates immense demand for services and technologies. Technological advancements, including the use of robotics and AI, enhance efficiency and reduce costs. Government initiatives, such as tax incentives, further accelerate the decommissioning process. The increasing focus on environmental sustainability drives the demand for environmentally sound decommissioning solutions.
Challenges in the UK Offshore Oil And Gas Decommissioning Market Market
Significant challenges exist, including the high cost of decommissioning, particularly for complex platforms. Supply chain constraints, especially in sourcing specialized equipment and skilled labor, can impact project timelines and budgets. Intense competition among service providers leads to price pressure and reduced profit margins. Regulatory uncertainties and changes in environmental standards pose additional complexities for operators. The overall cost of decommissioning projects is estimated to surpass xx Million by 2033.
Emerging Opportunities in UK Offshore Oil And Gas Decommissioning Market
The market presents several lucrative opportunities. Technological breakthroughs, such as improved robotics and AI-driven solutions, enhance efficiency and safety, opening up new markets. Strategic partnerships between operators, service providers, and technology developers are fostering innovation. Expanding into international markets and applying established decommissioning expertise to different industries (like nuclear) will provide new growth avenues. The market is expected to see innovation in materials recycling and repurposing of decommissioned assets, further enhancing its sustainability credentials.
Leading Players in the UK Offshore Oil And Gas Decommissioning Market Sector
- Veolia Environnement S A
- John Lawrie Group Ltd
- AF Gruppen ASA
- Ramboll Group A/S
- Perenco SA
- Derrick Services (UK) Ltd
Key Milestones in UK Offshore Oil And Gas Decommissioning Market Industry
- November 2022: Over 2,000 abandoned oil and gas wells in the North Sea highlight the scale of the decommissioning challenge, with EUR 20 billion worth of operations expected to be decommissioned. This announcement from Offshore Energies UK (OEUK) significantly impacted market outlook and investment decisions.
- September 2022: A three-year collaborative research agreement between the UK's Nuclear Decommissioning Authority (NDA) and National Decommissioning Centre (NDC) marked a crucial step towards knowledge sharing and innovation between nuclear and oil & gas decommissioning sectors, indicating potential future synergies.
Strategic Outlook for UK Offshore Oil And Gas Decommissioning Market Market
The UK offshore oil and gas decommissioning market is poised for sustained growth, driven by a significant backlog of projects and continuous technological advancements. Strategic partnerships and investment in innovative technologies will be key factors in maximizing market potential. Companies focusing on sustainable practices and efficient solutions will gain a competitive edge. The market's future depends on navigating regulatory complexities, addressing supply chain challenges, and capitalizing on emerging opportunities in areas like asset repurposing and international expansion. This translates into a positive long-term forecast, with significant market expansion anticipated across all segments.
UK Offshore Oil And Gas Decommissioning Market Segmentation
- 1. Shallow Water
- 2. Deepwater and Ultra-Deep Water
UK Offshore Oil And Gas Decommissioning Market Segmentation By Geography
-
1. North America
- 1.1. United States
- 1.2. Canada
- 1.3. Mexico
-
2. South America
- 2.1. Brazil
- 2.2. Argentina
- 2.3. Rest of South America
-
3. Europe
- 3.1. United Kingdom
- 3.2. Germany
- 3.3. France
- 3.4. Italy
- 3.5. Spain
- 3.6. Russia
- 3.7. Benelux
- 3.8. Nordics
- 3.9. Rest of Europe
-
4. Middle East & Africa
- 4.1. Turkey
- 4.2. Israel
- 4.3. GCC
- 4.4. North Africa
- 4.5. South Africa
- 4.6. Rest of Middle East & Africa
-
5. Asia Pacific
- 5.1. China
- 5.2. India
- 5.3. Japan
- 5.4. South Korea
- 5.5. ASEAN
- 5.6. Oceania
- 5.7. Rest of Asia Pacific
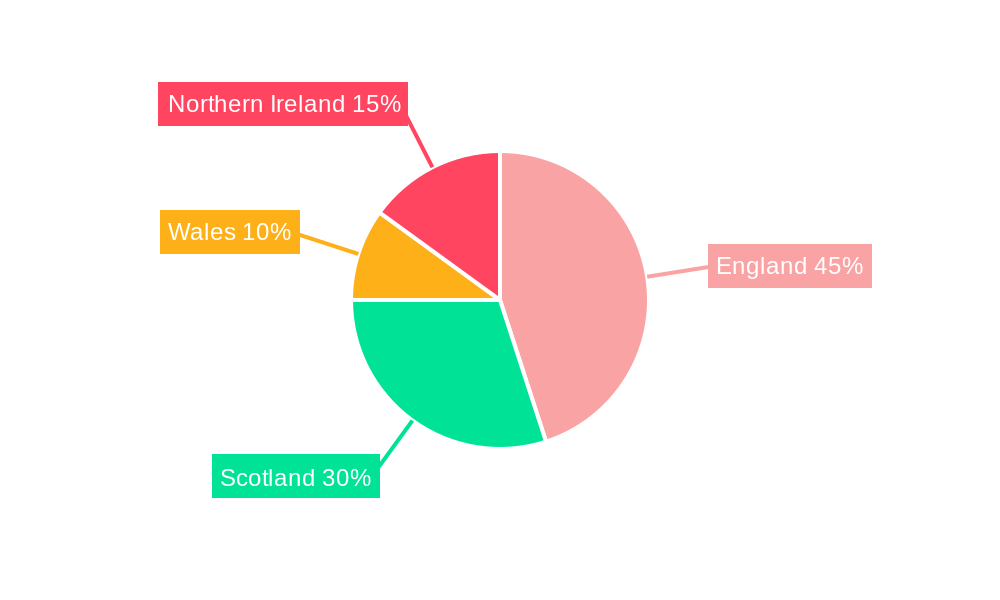
UK Offshore Oil And Gas Decommissioning Market Regional Market Share
Geographic Coverage of UK Offshore Oil And Gas Decommissioning Market
UK Offshore Oil And Gas Decommissioning Market REPORT HIGHLIGHTS
| Aspects | Details |
|---|---|
| Study Period | 2020-2034 |
| Base Year | 2025 |
| Estimated Year | 2026 |
| Forecast Period | 2026-2034 |
| Historical Period | 2020-2025 |
| Growth Rate | CAGR of 6.5% from 2020-2034 |
| Segmentation |
|
Table of Contents
- 1. Introduction
- 1.1. Research Scope
- 1.2. Market Segmentation
- 1.3. Research Objective
- 1.4. Definitions and Assumptions
- 2. Executive Summary
- 2.1. Market Snapshot
- 3. Market Dynamics
- 3.1. Market Drivers
- 3.2. Market Restrains
- 3.3. Market Trends
- 3.4. Market Opportunities
- 4. Market Factor Analysis
- 4.1. Porters Five Forces
- 4.1.1. Bargaining Power of Suppliers
- 4.1.2. Bargaining Power of Buyers
- 4.1.3. Threat of New Entrants
- 4.1.4. Threat of Substitutes
- 4.1.5. Competitive Rivalry
- 4.2. PESTEL analysis
- 4.3. BCG Analysis
- 4.3.1. Stars (High Growth, High Market Share)
- 4.3.2. Cash Cows (Low Growth, High Market Share)
- 4.3.3. Question Mark (High Growth, Low Market Share)
- 4.3.4. Dogs (Low Growth, Low Market Share)
- 4.4. Ansoff Matrix Analysis
- 4.5. Supply Chain Analysis
- 4.6. Regulatory Landscape
- 4.7. Current Market Potential and Opportunity Assessment (TAM–SAM–SOM Framework)
- 4.8. MDP Analyst Note
- 4.1. Porters Five Forces
- 5. Market Analysis, Insights and Forecast 2021-2033
- 5.1. Market Analysis, Insights and Forecast - by Shallow Water
- 5.2. Market Analysis, Insights and Forecast - by Deepwater and Ultra-Deep Water
- 5.3. Market Analysis, Insights and Forecast - by Region
- 5.3.1. North America
- 5.3.2. South America
- 5.3.3. Europe
- 5.3.4. Middle East & Africa
- 5.3.5. Asia Pacific
- 6. Global UK Offshore Oil And Gas Decommissioning Market Analysis, Insights and Forecast, 2021-2033
- 6.1. Market Analysis, Insights and Forecast - by Shallow Water
- 6.2. Market Analysis, Insights and Forecast - by Deepwater and Ultra-Deep Water
- 7. North America UK Offshore Oil And Gas Decommissioning Market Analysis, Insights and Forecast, 2020-2032
- 7.1. Market Analysis, Insights and Forecast - by Shallow Water
- 7.2. Market Analysis, Insights and Forecast - by Deepwater and Ultra-Deep Water
- 8. South America UK Offshore Oil And Gas Decommissioning Market Analysis, Insights and Forecast, 2020-2032
- 8.1. Market Analysis, Insights and Forecast - by Shallow Water
- 8.2. Market Analysis, Insights and Forecast - by Deepwater and Ultra-Deep Water
- 9. Europe UK Offshore Oil And Gas Decommissioning Market Analysis, Insights and Forecast, 2020-2032
- 9.1. Market Analysis, Insights and Forecast - by Shallow Water
- 9.2. Market Analysis, Insights and Forecast - by Deepwater and Ultra-Deep Water
- 10. Middle East & Africa UK Offshore Oil And Gas Decommissioning Market Analysis, Insights and Forecast, 2020-2032
- 10.1. Market Analysis, Insights and Forecast - by Shallow Water
- 10.2. Market Analysis, Insights and Forecast - by Deepwater and Ultra-Deep Water
- 11. Asia Pacific UK Offshore Oil And Gas Decommissioning Market Analysis, Insights and Forecast, 2020-2032
- 11.1. Market Analysis, Insights and Forecast - by Shallow Water
- 11.2. Market Analysis, Insights and Forecast - by Deepwater and Ultra-Deep Water
- 12. Competitive Analysis
- 12.1. Company Profiles
- 12.1.1 Veolia Environnement S A
- 12.1.1.1. Company Overview
- 12.1.1.2. Products
- 12.1.1.3. Company Financials
- 12.1.1.4. SWOT Analysis
- 12.1.2 John Lawrie Group Ltd *List Not Exhaustive
- 12.1.2.1. Company Overview
- 12.1.2.2. Products
- 12.1.2.3. Company Financials
- 12.1.2.4. SWOT Analysis
- 12.1.3 AF Gruppen ASA
- 12.1.3.1. Company Overview
- 12.1.3.2. Products
- 12.1.3.3. Company Financials
- 12.1.3.4. SWOT Analysis
- 12.1.4 Ramboll Group A/S
- 12.1.4.1. Company Overview
- 12.1.4.2. Products
- 12.1.4.3. Company Financials
- 12.1.4.4. SWOT Analysis
- 12.1.5 Perenco SA
- 12.1.5.1. Company Overview
- 12.1.5.2. Products
- 12.1.5.3. Company Financials
- 12.1.5.4. SWOT Analysis
- 12.1.6 Derrick Services (UK) Ltd
- 12.1.6.1. Company Overview
- 12.1.6.2. Products
- 12.1.6.3. Company Financials
- 12.1.6.4. SWOT Analysis
- 12.1.1 Veolia Environnement S A
- 12.2. Market Entropy
- 12.2.1 Company's Key Areas Served
- 12.2.2 Recent Developments
- 12.3. Company Market Share Analysis 2025
- 12.3.1 Top 5 Companies Market Share Analysis
- 12.3.2 Top 3 Companies Market Share Analysis
- 12.4. List of Potential Customers
- 13. Research Methodology
List of Figures
- Figure 1: Global UK Offshore Oil And Gas Decommissioning Market Revenue Breakdown (billion, %) by Region 2025 & 2033
- Figure 2: Global UK Offshore Oil And Gas Decommissioning Market Volume Breakdown (K Units, %) by Region 2025 & 2033
- Figure 3: North America UK Offshore Oil And Gas Decommissioning Market Revenue (billion), by Shallow Water 2025 & 2033
- Figure 4: North America UK Offshore Oil And Gas Decommissioning Market Volume (K Units), by Shallow Water 2025 & 2033
- Figure 5: North America UK Offshore Oil And Gas Decommissioning Market Revenue Share (%), by Shallow Water 2025 & 2033
- Figure 6: North America UK Offshore Oil And Gas Decommissioning Market Volume Share (%), by Shallow Water 2025 & 2033
- Figure 7: North America UK Offshore Oil And Gas Decommissioning Market Revenue (billion), by Deepwater and Ultra-Deep Water 2025 & 2033
- Figure 8: North America UK Offshore Oil And Gas Decommissioning Market Volume (K Units), by Deepwater and Ultra-Deep Water 2025 & 2033
- Figure 9: North America UK Offshore Oil And Gas Decommissioning Market Revenue Share (%), by Deepwater and Ultra-Deep Water 2025 & 2033
- Figure 10: North America UK Offshore Oil And Gas Decommissioning Market Volume Share (%), by Deepwater and Ultra-Deep Water 2025 & 2033
- Figure 11: North America UK Offshore Oil And Gas Decommissioning Market Revenue (billion), by Country 2025 & 2033
- Figure 12: North America UK Offshore Oil And Gas Decommissioning Market Volume (K Units), by Country 2025 & 2033
- Figure 13: North America UK Offshore Oil And Gas Decommissioning Market Revenue Share (%), by Country 2025 & 2033
- Figure 14: North America UK Offshore Oil And Gas Decommissioning Market Volume Share (%), by Country 2025 & 2033
- Figure 15: South America UK Offshore Oil And Gas Decommissioning Market Revenue (billion), by Shallow Water 2025 & 2033
- Figure 16: South America UK Offshore Oil And Gas Decommissioning Market Volume (K Units), by Shallow Water 2025 & 2033
- Figure 17: South America UK Offshore Oil And Gas Decommissioning Market Revenue Share (%), by Shallow Water 2025 & 2033
- Figure 18: South America UK Offshore Oil And Gas Decommissioning Market Volume Share (%), by Shallow Water 2025 & 2033
- Figure 19: South America UK Offshore Oil And Gas Decommissioning Market Revenue (billion), by Deepwater and Ultra-Deep Water 2025 & 2033
- Figure 20: South America UK Offshore Oil And Gas Decommissioning Market Volume (K Units), by Deepwater and Ultra-Deep Water 2025 & 2033
- Figure 21: South America UK Offshore Oil And Gas Decommissioning Market Revenue Share (%), by Deepwater and Ultra-Deep Water 2025 & 2033
- Figure 22: South America UK Offshore Oil And Gas Decommissioning Market Volume Share (%), by Deepwater and Ultra-Deep Water 2025 & 2033
- Figure 23: South America UK Offshore Oil And Gas Decommissioning Market Revenue (billion), by Country 2025 & 2033
- Figure 24: South America UK Offshore Oil And Gas Decommissioning Market Volume (K Units), by Country 2025 & 2033
- Figure 25: South America UK Offshore Oil And Gas Decommissioning Market Revenue Share (%), by Country 2025 & 2033
- Figure 26: South America UK Offshore Oil And Gas Decommissioning Market Volume Share (%), by Country 2025 & 2033
- Figure 27: Europe UK Offshore Oil And Gas Decommissioning Market Revenue (billion), by Shallow Water 2025 & 2033
- Figure 28: Europe UK Offshore Oil And Gas Decommissioning Market Volume (K Units), by Shallow Water 2025 & 2033
- Figure 29: Europe UK Offshore Oil And Gas Decommissioning Market Revenue Share (%), by Shallow Water 2025 & 2033
- Figure 30: Europe UK Offshore Oil And Gas Decommissioning Market Volume Share (%), by Shallow Water 2025 & 2033
- Figure 31: Europe UK Offshore Oil And Gas Decommissioning Market Revenue (billion), by Deepwater and Ultra-Deep Water 2025 & 2033
- Figure 32: Europe UK Offshore Oil And Gas Decommissioning Market Volume (K Units), by Deepwater and Ultra-Deep Water 2025 & 2033
- Figure 33: Europe UK Offshore Oil And Gas Decommissioning Market Revenue Share (%), by Deepwater and Ultra-Deep Water 2025 & 2033
- Figure 34: Europe UK Offshore Oil And Gas Decommissioning Market Volume Share (%), by Deepwater and Ultra-Deep Water 2025 & 2033
- Figure 35: Europe UK Offshore Oil And Gas Decommissioning Market Revenue (billion), by Country 2025 & 2033
- Figure 36: Europe UK Offshore Oil And Gas Decommissioning Market Volume (K Units), by Country 2025 & 2033
- Figure 37: Europe UK Offshore Oil And Gas Decommissioning Market Revenue Share (%), by Country 2025 & 2033
- Figure 38: Europe UK Offshore Oil And Gas Decommissioning Market Volume Share (%), by Country 2025 & 2033
- Figure 39: Middle East & Africa UK Offshore Oil And Gas Decommissioning Market Revenue (billion), by Shallow Water 2025 & 2033
- Figure 40: Middle East & Africa UK Offshore Oil And Gas Decommissioning Market Volume (K Units), by Shallow Water 2025 & 2033
- Figure 41: Middle East & Africa UK Offshore Oil And Gas Decommissioning Market Revenue Share (%), by Shallow Water 2025 & 2033
- Figure 42: Middle East & Africa UK Offshore Oil And Gas Decommissioning Market Volume Share (%), by Shallow Water 2025 & 2033
- Figure 43: Middle East & Africa UK Offshore Oil And Gas Decommissioning Market Revenue (billion), by Deepwater and Ultra-Deep Water 2025 & 2033
- Figure 44: Middle East & Africa UK Offshore Oil And Gas Decommissioning Market Volume (K Units), by Deepwater and Ultra-Deep Water 2025 & 2033
- Figure 45: Middle East & Africa UK Offshore Oil And Gas Decommissioning Market Revenue Share (%), by Deepwater and Ultra-Deep Water 2025 & 2033
- Figure 46: Middle East & Africa UK Offshore Oil And Gas Decommissioning Market Volume Share (%), by Deepwater and Ultra-Deep Water 2025 & 2033
- Figure 47: Middle East & Africa UK Offshore Oil And Gas Decommissioning Market Revenue (billion), by Country 2025 & 2033
- Figure 48: Middle East & Africa UK Offshore Oil And Gas Decommissioning Market Volume (K Units), by Country 2025 & 2033
- Figure 49: Middle East & Africa UK Offshore Oil And Gas Decommissioning Market Revenue Share (%), by Country 2025 & 2033
- Figure 50: Middle East & Africa UK Offshore Oil And Gas Decommissioning Market Volume Share (%), by Country 2025 & 2033
- Figure 51: Asia Pacific UK Offshore Oil And Gas Decommissioning Market Revenue (billion), by Shallow Water 2025 & 2033
- Figure 52: Asia Pacific UK Offshore Oil And Gas Decommissioning Market Volume (K Units), by Shallow Water 2025 & 2033
- Figure 53: Asia Pacific UK Offshore Oil And Gas Decommissioning Market Revenue Share (%), by Shallow Water 2025 & 2033
- Figure 54: Asia Pacific UK Offshore Oil And Gas Decommissioning Market Volume Share (%), by Shallow Water 2025 & 2033
- Figure 55: Asia Pacific UK Offshore Oil And Gas Decommissioning Market Revenue (billion), by Deepwater and Ultra-Deep Water 2025 & 2033
- Figure 56: Asia Pacific UK Offshore Oil And Gas Decommissioning Market Volume (K Units), by Deepwater and Ultra-Deep Water 2025 & 2033
- Figure 57: Asia Pacific UK Offshore Oil And Gas Decommissioning Market Revenue Share (%), by Deepwater and Ultra-Deep Water 2025 & 2033
- Figure 58: Asia Pacific UK Offshore Oil And Gas Decommissioning Market Volume Share (%), by Deepwater and Ultra-Deep Water 2025 & 2033
- Figure 59: Asia Pacific UK Offshore Oil And Gas Decommissioning Market Revenue (billion), by Country 2025 & 2033
- Figure 60: Asia Pacific UK Offshore Oil And Gas Decommissioning Market Volume (K Units), by Country 2025 & 2033
- Figure 61: Asia Pacific UK Offshore Oil And Gas Decommissioning Market Revenue Share (%), by Country 2025 & 2033
- Figure 62: Asia Pacific UK Offshore Oil And Gas Decommissioning Market Volume Share (%), by Country 2025 & 2033
List of Tables
- Table 1: Global UK Offshore Oil And Gas Decommissioning Market Revenue billion Forecast, by Shallow Water 2020 & 2033
- Table 2: Global UK Offshore Oil And Gas Decommissioning Market Volume K Units Forecast, by Shallow Water 2020 & 2033
- Table 3: Global UK Offshore Oil And Gas Decommissioning Market Revenue billion Forecast, by Deepwater and Ultra-Deep Water 2020 & 2033
- Table 4: Global UK Offshore Oil And Gas Decommissioning Market Volume K Units Forecast, by Deepwater and Ultra-Deep Water 2020 & 2033
- Table 5: Global UK Offshore Oil And Gas Decommissioning Market Revenue billion Forecast, by Region 2020 & 2033
- Table 6: Global UK Offshore Oil And Gas Decommissioning Market Volume K Units Forecast, by Region 2020 & 2033
- Table 7: Global UK Offshore Oil And Gas Decommissioning Market Revenue billion Forecast, by Shallow Water 2020 & 2033
- Table 8: Global UK Offshore Oil And Gas Decommissioning Market Volume K Units Forecast, by Shallow Water 2020 & 2033
- Table 9: Global UK Offshore Oil And Gas Decommissioning Market Revenue billion Forecast, by Deepwater and Ultra-Deep Water 2020 & 2033
- Table 10: Global UK Offshore Oil And Gas Decommissioning Market Volume K Units Forecast, by Deepwater and Ultra-Deep Water 2020 & 2033
- Table 11: Global UK Offshore Oil And Gas Decommissioning Market Revenue billion Forecast, by Country 2020 & 2033
- Table 12: Global UK Offshore Oil And Gas Decommissioning Market Volume K Units Forecast, by Country 2020 & 2033
- Table 13: United States UK Offshore Oil And Gas Decommissioning Market Revenue (billion) Forecast, by Application 2020 & 2033
- Table 14: United States UK Offshore Oil And Gas Decommissioning Market Volume (K Units) Forecast, by Application 2020 & 2033
- Table 15: Canada UK Offshore Oil And Gas Decommissioning Market Revenue (billion) Forecast, by Application 2020 & 2033
- Table 16: Canada UK Offshore Oil And Gas Decommissioning Market Volume (K Units) Forecast, by Application 2020 & 2033
- Table 17: Mexico UK Offshore Oil And Gas Decommissioning Market Revenue (billion) Forecast, by Application 2020 & 2033
- Table 18: Mexico UK Offshore Oil And Gas Decommissioning Market Volume (K Units) Forecast, by Application 2020 & 2033
- Table 19: Global UK Offshore Oil And Gas Decommissioning Market Revenue billion Forecast, by Shallow Water 2020 & 2033
- Table 20: Global UK Offshore Oil And Gas Decommissioning Market Volume K Units Forecast, by Shallow Water 2020 & 2033
- Table 21: Global UK Offshore Oil And Gas Decommissioning Market Revenue billion Forecast, by Deepwater and Ultra-Deep Water 2020 & 2033
- Table 22: Global UK Offshore Oil And Gas Decommissioning Market Volume K Units Forecast, by Deepwater and Ultra-Deep Water 2020 & 2033
- Table 23: Global UK Offshore Oil And Gas Decommissioning Market Revenue billion Forecast, by Country 2020 & 2033
- Table 24: Global UK Offshore Oil And Gas Decommissioning Market Volume K Units Forecast, by Country 2020 & 2033
- Table 25: Brazil UK Offshore Oil And Gas Decommissioning Market Revenue (billion) Forecast, by Application 2020 & 2033
- Table 26: Brazil UK Offshore Oil And Gas Decommissioning Market Volume (K Units) Forecast, by Application 2020 & 2033
- Table 27: Argentina UK Offshore Oil And Gas Decommissioning Market Revenue (billion) Forecast, by Application 2020 & 2033
- Table 28: Argentina UK Offshore Oil And Gas Decommissioning Market Volume (K Units) Forecast, by Application 2020 & 2033
- Table 29: Rest of South America UK Offshore Oil And Gas Decommissioning Market Revenue (billion) Forecast, by Application 2020 & 2033
- Table 30: Rest of South America UK Offshore Oil And Gas Decommissioning Market Volume (K Units) Forecast, by Application 2020 & 2033
- Table 31: Global UK Offshore Oil And Gas Decommissioning Market Revenue billion Forecast, by Shallow Water 2020 & 2033
- Table 32: Global UK Offshore Oil And Gas Decommissioning Market Volume K Units Forecast, by Shallow Water 2020 & 2033
- Table 33: Global UK Offshore Oil And Gas Decommissioning Market Revenue billion Forecast, by Deepwater and Ultra-Deep Water 2020 & 2033
- Table 34: Global UK Offshore Oil And Gas Decommissioning Market Volume K Units Forecast, by Deepwater and Ultra-Deep Water 2020 & 2033
- Table 35: Global UK Offshore Oil And Gas Decommissioning Market Revenue billion Forecast, by Country 2020 & 2033
- Table 36: Global UK Offshore Oil And Gas Decommissioning Market Volume K Units Forecast, by Country 2020 & 2033
- Table 37: United Kingdom UK Offshore Oil And Gas Decommissioning Market Revenue (billion) Forecast, by Application 2020 & 2033
- Table 38: United Kingdom UK Offshore Oil And Gas Decommissioning Market Volume (K Units) Forecast, by Application 2020 & 2033
- Table 39: Germany UK Offshore Oil And Gas Decommissioning Market Revenue (billion) Forecast, by Application 2020 & 2033
- Table 40: Germany UK Offshore Oil And Gas Decommissioning Market Volume (K Units) Forecast, by Application 2020 & 2033
- Table 41: France UK Offshore Oil And Gas Decommissioning Market Revenue (billion) Forecast, by Application 2020 & 2033
- Table 42: France UK Offshore Oil And Gas Decommissioning Market Volume (K Units) Forecast, by Application 2020 & 2033
- Table 43: Italy UK Offshore Oil And Gas Decommissioning Market Revenue (billion) Forecast, by Application 2020 & 2033
- Table 44: Italy UK Offshore Oil And Gas Decommissioning Market Volume (K Units) Forecast, by Application 2020 & 2033
- Table 45: Spain UK Offshore Oil And Gas Decommissioning Market Revenue (billion) Forecast, by Application 2020 & 2033
- Table 46: Spain UK Offshore Oil And Gas Decommissioning Market Volume (K Units) Forecast, by Application 2020 & 2033
- Table 47: Russia UK Offshore Oil And Gas Decommissioning Market Revenue (billion) Forecast, by Application 2020 & 2033
- Table 48: Russia UK Offshore Oil And Gas Decommissioning Market Volume (K Units) Forecast, by Application 2020 & 2033
- Table 49: Benelux UK Offshore Oil And Gas Decommissioning Market Revenue (billion) Forecast, by Application 2020 & 2033
- Table 50: Benelux UK Offshore Oil And Gas Decommissioning Market Volume (K Units) Forecast, by Application 2020 & 2033
- Table 51: Nordics UK Offshore Oil And Gas Decommissioning Market Revenue (billion) Forecast, by Application 2020 & 2033
- Table 52: Nordics UK Offshore Oil And Gas Decommissioning Market Volume (K Units) Forecast, by Application 2020 & 2033
- Table 53: Rest of Europe UK Offshore Oil And Gas Decommissioning Market Revenue (billion) Forecast, by Application 2020 & 2033
- Table 54: Rest of Europe UK Offshore Oil And Gas Decommissioning Market Volume (K Units) Forecast, by Application 2020 & 2033
- Table 55: Global UK Offshore Oil And Gas Decommissioning Market Revenue billion Forecast, by Shallow Water 2020 & 2033
- Table 56: Global UK Offshore Oil And Gas Decommissioning Market Volume K Units Forecast, by Shallow Water 2020 & 2033
- Table 57: Global UK Offshore Oil And Gas Decommissioning Market Revenue billion Forecast, by Deepwater and Ultra-Deep Water 2020 & 2033
- Table 58: Global UK Offshore Oil And Gas Decommissioning Market Volume K Units Forecast, by Deepwater and Ultra-Deep Water 2020 & 2033
- Table 59: Global UK Offshore Oil And Gas Decommissioning Market Revenue billion Forecast, by Country 2020 & 2033
- Table 60: Global UK Offshore Oil And Gas Decommissioning Market Volume K Units Forecast, by Country 2020 & 2033
- Table 61: Turkey UK Offshore Oil And Gas Decommissioning Market Revenue (billion) Forecast, by Application 2020 & 2033
- Table 62: Turkey UK Offshore Oil And Gas Decommissioning Market Volume (K Units) Forecast, by Application 2020 & 2033
- Table 63: Israel UK Offshore Oil And Gas Decommissioning Market Revenue (billion) Forecast, by Application 2020 & 2033
- Table 64: Israel UK Offshore Oil And Gas Decommissioning Market Volume (K Units) Forecast, by Application 2020 & 2033
- Table 65: GCC UK Offshore Oil And Gas Decommissioning Market Revenue (billion) Forecast, by Application 2020 & 2033
- Table 66: GCC UK Offshore Oil And Gas Decommissioning Market Volume (K Units) Forecast, by Application 2020 & 2033
- Table 67: North Africa UK Offshore Oil And Gas Decommissioning Market Revenue (billion) Forecast, by Application 2020 & 2033
- Table 68: North Africa UK Offshore Oil And Gas Decommissioning Market Volume (K Units) Forecast, by Application 2020 & 2033
- Table 69: South Africa UK Offshore Oil And Gas Decommissioning Market Revenue (billion) Forecast, by Application 2020 & 2033
- Table 70: South Africa UK Offshore Oil And Gas Decommissioning Market Volume (K Units) Forecast, by Application 2020 & 2033
- Table 71: Rest of Middle East & Africa UK Offshore Oil And Gas Decommissioning Market Revenue (billion) Forecast, by Application 2020 & 2033
- Table 72: Rest of Middle East & Africa UK Offshore Oil And Gas Decommissioning Market Volume (K Units) Forecast, by Application 2020 & 2033
- Table 73: Global UK Offshore Oil And Gas Decommissioning Market Revenue billion Forecast, by Shallow Water 2020 & 2033
- Table 74: Global UK Offshore Oil And Gas Decommissioning Market Volume K Units Forecast, by Shallow Water 2020 & 2033
- Table 75: Global UK Offshore Oil And Gas Decommissioning Market Revenue billion Forecast, by Deepwater and Ultra-Deep Water 2020 & 2033
- Table 76: Global UK Offshore Oil And Gas Decommissioning Market Volume K Units Forecast, by Deepwater and Ultra-Deep Water 2020 & 2033
- Table 77: Global UK Offshore Oil And Gas Decommissioning Market Revenue billion Forecast, by Country 2020 & 2033
- Table 78: Global UK Offshore Oil And Gas Decommissioning Market Volume K Units Forecast, by Country 2020 & 2033
- Table 79: China UK Offshore Oil And Gas Decommissioning Market Revenue (billion) Forecast, by Application 2020 & 2033
- Table 80: China UK Offshore Oil And Gas Decommissioning Market Volume (K Units) Forecast, by Application 2020 & 2033
- Table 81: India UK Offshore Oil And Gas Decommissioning Market Revenue (billion) Forecast, by Application 2020 & 2033
- Table 82: India UK Offshore Oil And Gas Decommissioning Market Volume (K Units) Forecast, by Application 2020 & 2033
- Table 83: Japan UK Offshore Oil And Gas Decommissioning Market Revenue (billion) Forecast, by Application 2020 & 2033
- Table 84: Japan UK Offshore Oil And Gas Decommissioning Market Volume (K Units) Forecast, by Application 2020 & 2033
- Table 85: South Korea UK Offshore Oil And Gas Decommissioning Market Revenue (billion) Forecast, by Application 2020 & 2033
- Table 86: South Korea UK Offshore Oil And Gas Decommissioning Market Volume (K Units) Forecast, by Application 2020 & 2033
- Table 87: ASEAN UK Offshore Oil And Gas Decommissioning Market Revenue (billion) Forecast, by Application 2020 & 2033
- Table 88: ASEAN UK Offshore Oil And Gas Decommissioning Market Volume (K Units) Forecast, by Application 2020 & 2033
- Table 89: Oceania UK Offshore Oil And Gas Decommissioning Market Revenue (billion) Forecast, by Application 2020 & 2033
- Table 90: Oceania UK Offshore Oil And Gas Decommissioning Market Volume (K Units) Forecast, by Application 2020 & 2033
- Table 91: Rest of Asia Pacific UK Offshore Oil And Gas Decommissioning Market Revenue (billion) Forecast, by Application 2020 & 2033
- Table 92: Rest of Asia Pacific UK Offshore Oil And Gas Decommissioning Market Volume (K Units) Forecast, by Application 2020 & 2033
Frequently Asked Questions
1. What is the projected Compound Annual Growth Rate (CAGR) of the UK Offshore Oil And Gas Decommissioning Market?
The projected CAGR is approximately 6.5%.
2. Which companies are prominent players in the UK Offshore Oil And Gas Decommissioning Market?
Key companies in the market include Veolia Environnement S A, John Lawrie Group Ltd *List Not Exhaustive, AF Gruppen ASA, Ramboll Group A/S, Perenco SA, Derrick Services (UK) Ltd.
3. What are the main segments of the UK Offshore Oil And Gas Decommissioning Market?
The market segments include Shallow Water, Deepwater and Ultra-Deep Water.
4. Can you provide details about the market size?
The market size is estimated to be USD 11.1 billion as of 2022.
5. What are some drivers contributing to market growth?
4.; Supportive Government Policies in Developing Solar Energy4.; Abundant Solar Resources Across the Country.
6. What are the notable trends driving market growth?
Increasing Decommissioning Projects to Drive the Market.
7. Are there any restraints impacting market growth?
4.; Competition from Conventional Energy Sources.
8. Can you provide examples of recent developments in the market?
November 2022: there were more than 2,000 abandoned oil and gas wells in the North Sea begin, The high number of abandoned wells is expected to lead to an increase in activity as operations worth EUR 20 billion are decommissioned and shut down. The research was conducted by industry group Offshore Energies UK (OEUK), formerly Oil & Gas UK, which provides fresh insight into petroleum decommissioning efforts.
9. What pricing options are available for accessing the report?
Pricing options include single-user, multi-user, and enterprise licenses priced at USD 3800, USD 4500, and USD 5800 respectively.
10. Is the market size provided in terms of value or volume?
The market size is provided in terms of value, measured in billion and volume, measured in K Units.
11. Are there any specific market keywords associated with the report?
Yes, the market keyword associated with the report is "UK Offshore Oil And Gas Decommissioning Market," which aids in identifying and referencing the specific market segment covered.
12. How do I determine which pricing option suits my needs best?
The pricing options vary based on user requirements and access needs. Individual users may opt for single-user licenses, while businesses requiring broader access may choose multi-user or enterprise licenses for cost-effective access to the report.
13. Are there any additional resources or data provided in the UK Offshore Oil And Gas Decommissioning Market report?
While the report offers comprehensive insights, it's advisable to review the specific contents or supplementary materials provided to ascertain if additional resources or data are available.
14. How can I stay updated on further developments or reports in the UK Offshore Oil And Gas Decommissioning Market?
To stay informed about further developments, trends, and reports in the UK Offshore Oil And Gas Decommissioning Market, consider subscribing to industry newsletters, following relevant companies and organizations, or regularly checking reputable industry news sources and publications.
Methodology
Step 1 - Identification of Relevant Samples Size from Population Database


Step 2 - Approaches for Defining Global Market Size (Value, Volume* & Price*)

Note*: In applicable scenarios
Step 3 - Data Sources
Primary Research
- Web Analytics
- Survey Reports
- Research Institute
- Latest Research Reports
- Opinion Leaders
Secondary Research
- Annual Reports
- White Paper
- Latest Press Release
- Industry Association
- Paid Database
- Investor Presentations

Step 4 - Data Triangulation
Involves using different sources of information in order to increase the validity of a study
These sources are likely to be stakeholders in a program - participants, other researchers, program staff, other community members, and so on.
Then we put all data in single framework & apply various statistical tools to find out the dynamic on the market.
During the analysis stage, feedback from the stakeholder groups would be compared to determine areas of agreement as well as areas of divergence