

Key Insights
The UK bunker fuel market is projected to reach £172.5 billion by 2025, with a Compound Annual Growth Rate (CAGR) of 5.6% between 2025 and 2033. This growth is underpinned by rising global maritime trade, particularly through key UK ports, driving demand for essential bunker fuels. The ongoing transition towards cleaner fuel alternatives, such as Very-Low Sulfur Fuel Oil (VLSFO) and Liquefied Natural Gas (LNG), also stimulates market expansion through strategic infrastructure investments. The diverse vessel traffic, encompassing container ships, tankers, and bulk carriers, contributes to a robust and varied market landscape. Leading industry participants, including Shell Marine Products Ltd, BP PLC, and Exxon Mobil Corporation, are instrumental in shaping market dynamics via their extensive supply chains and strategic investments. Key market restraints include volatility in crude oil prices, affecting operational costs, and stringent environmental regulations that, while promoting cleaner fuel adoption, necessitate substantial capital outlays from shipping operators and fuel suppliers.
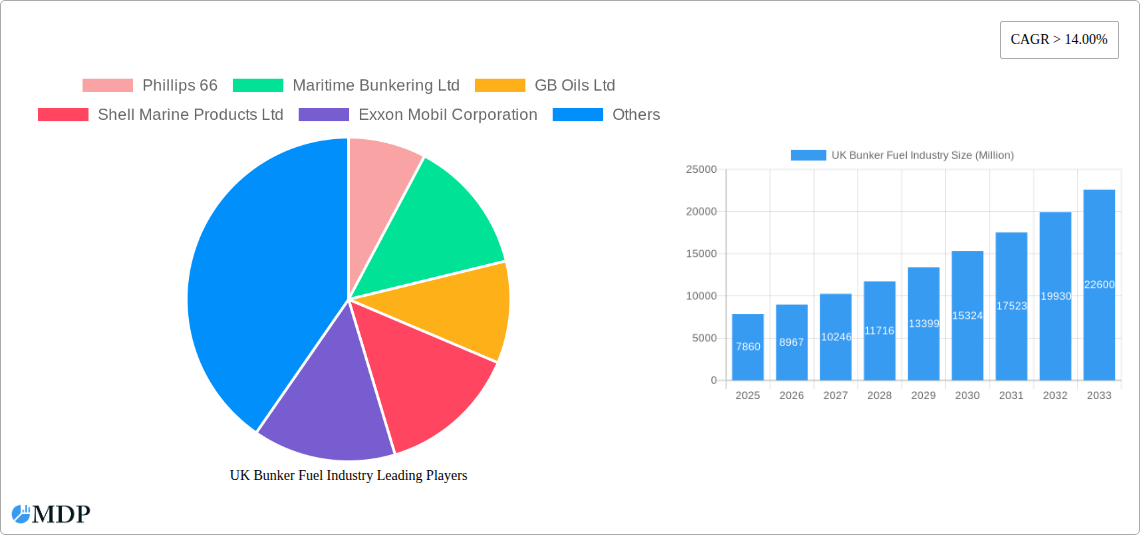
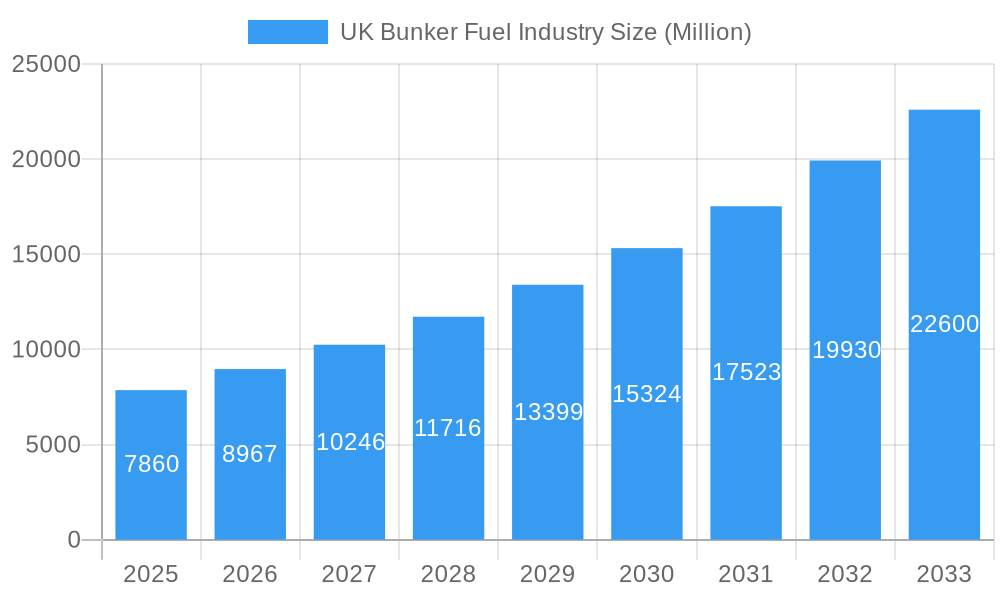
UK Bunker Fuel Industry Market Size (In Billion)
Market segmentation highlights significant trends, with VLSFO experiencing substantial growth due to environmental mandates, gradually supplanting High Sulfur Fuel Oil (HSFO). LNG, though currently a niche segment, shows considerable promise as a sustainable alternative. Regional market variations across England, Wales, Scotland, and Northern Ireland are anticipated, influenced by localized port operations and industrial demands. The forecast period (2025-2033) indicates sustained market expansion driven by increasing trade volumes, fleet modernization initiatives, and the progressive adoption of cleaner fuel technologies. Stakeholders must comprehend these evolving market dynamics to effectively operate within this complex sector.
UK Bunker Fuel Industry Company Market Share
UK Bunker Fuel Industry: A Comprehensive Market Report (2019-2033)
This comprehensive report provides an in-depth analysis of the UK bunker fuel industry, offering valuable insights for stakeholders including fuel suppliers, shipping companies, investors, and policymakers. Covering the period 2019-2033, with a focus on 2025, this report analyzes market dynamics, key players, emerging trends, and future growth opportunities within the UK bunker fuel market. The report leverages extensive data analysis to provide a clear and actionable understanding of this vital sector.
UK Bunker Fuel Industry Market Dynamics & Concentration
The UK bunker fuel market, valued at approximately £XX Million in 2025, exhibits a moderately concentrated structure. Key players such as Phillips 66, Shell Marine Products Ltd, Exxon Mobil Corporation, BP PLC, and others hold significant market share, estimated at a combined XX%. However, the market is witnessing increased competition from smaller, specialized players focusing on niche segments like LNG bunkering.
- Market Share: Dominant players hold approximately XX% of the market share, with the remaining XX% distributed among smaller companies.
- M&A Activity: The period 2019-2024 saw approximately XX M&A deals, primarily driven by consolidation efforts and expansion into new fuel types. The forecast period (2025-2033) is expected to see a further XX M&A deals, driven by the transition to cleaner fuels.
- Innovation Drivers: Stringent environmental regulations, particularly regarding sulfur emissions, are driving innovation in fuel technologies and bunkering infrastructure.
- Regulatory Framework: Compliance with IMO 2020 and other environmental regulations is a key factor shaping market dynamics.
- Product Substitutes: The increasing adoption of LNG and alternative fuels presents a significant challenge to traditional HSFO.
- End-User Trends: The shipping industry's growing focus on sustainability and efficiency is driving demand for cleaner fuels.
UK Bunker Fuel Industry Industry Trends & Analysis
The UK bunker fuel market is experiencing significant transformation driven by a multitude of factors. The industry's CAGR from 2025 to 2033 is projected to be XX%, fueled by the growth of global shipping and stringent environmental regulations. Market penetration of VLSFO and LNG is expected to increase dramatically, while the market share of HSFO will continue to decline.
Technological advancements in fuel blending and infrastructure are key drivers of growth. The increasing adoption of LNG as a bunker fuel is transforming the industry, requiring substantial investment in bunkering infrastructure and related technologies. Consumer preferences are shifting towards environmentally friendly options, increasing the demand for VLSFO and LNG. Intense competition among major players necessitates continuous innovation and strategic partnerships to maintain a competitive edge.
Leading Markets & Segments in UK Bunker Fuel Industry
The UK bunker fuel market is dominated by the VLSFO segment, which accounted for approximately XX Million in 2025. This dominance is driven by the IMO 2020 regulations, mandating a significant reduction in sulfur content. The tanker segment consumes the largest volume of bunker fuel, followed by containerships.
Key Drivers:
- Economic Policies: Government incentives and regulations promoting cleaner fuels are boosting market growth.
- Infrastructure: Investments in LNG bunkering infrastructure are expanding market access for this fuel type.
Dominance Analysis:
VLSFO’s dominance is primarily attributed to regulatory pressures, while the tanker segment's high fuel consumption drives its significant market share. The growth of LNG is expected to increase its market share significantly in the forecast period, though it currently represents a smaller portion of the total volume.
UK Bunker Fuel Industry Product Developments
Significant advancements are occurring in bunker fuel technology, including the development of next-generation biofuels, the optimization of VLSFO blends for improved efficiency, and the expansion of LNG bunkering capabilities. These developments are driven by the need to meet stricter environmental regulations and reduce the carbon footprint of shipping. The focus is on developing fuels with lower emissions and increased efficiency, leading to a more sustainable and cost-effective shipping industry.
Key Drivers of UK Bunker Fuel Industry Growth
The UK bunker fuel market's growth is driven by several key factors:
- Technological Advancements: Development of cleaner fuels like LNG and biofuels.
- Economic Growth: Increased global trade and shipping activity.
- Regulatory Changes: Stringent environmental regulations driving the shift to cleaner fuels.
Challenges in the UK Bunker Fuel Industry Market
The UK bunker fuel industry faces several challenges including:
- Regulatory Hurdles: The complexity and evolving nature of environmental regulations.
- Supply Chain Issues: Ensuring sufficient supply of cleaner fuels to meet growing demand.
- Competitive Pressures: Intense competition among major players.
Emerging Opportunities in UK Bunker Fuel Industry
Several factors are poised to drive long-term growth in the UK bunker fuel industry, including technological breakthroughs in alternative fuels, strategic partnerships to develop and deploy LNG bunkering infrastructure, and the expansion into new markets driven by the growing demand for cleaner fuels.
Leading Players in the UK Bunker Fuel Industry Sector
- Phillips 66
- Maritime Bunkering Ltd
- GB Oils Ltd
- Shell Marine Products Ltd
- Exxon Mobil Corporation
- Mærsk A/S
- ConocoPhillips Ltd
- Greenergy International Ltd
- Rosneft Marine UK Ltd
- BP PLC
- Henty Oil Ltd
Key Milestones in UK Bunker Fuel Industry Industry
- 2020: Implementation of IMO 2020, significantly impacting fuel demand.
- 2021-2023: Significant investments in LNG bunkering infrastructure by several major players.
- 2022-2024: Several mergers and acquisitions aimed at consolidating market share and expanding fuel offerings.
- Ongoing: Continuous development and testing of new fuel blends and technologies to meet stricter emission standards.
Strategic Outlook for UK Bunker Fuel Industry Market
The UK bunker fuel market is poised for sustained growth, driven by the increasing adoption of cleaner fuels, advancements in bunkering infrastructure, and the ongoing commitment to reduce the environmental impact of shipping. Strategic opportunities exist for companies investing in LNG bunkering infrastructure and developing innovative fuel blends to meet future regulatory requirements and growing consumer demand for sustainable shipping solutions.
UK Bunker Fuel Industry Segmentation
-
1. Type
- 1.1. High Sulfur Fuel Oil (HSFO)
- 1.2. Very-Low Sulfur Fuel Oil (VLSFO)
- 1.3. Marine Gas Oil (MGO)
- 1.4. Liquefied Natural Gas (LNG)
- 1.5. Others
-
2. Vessel Type
- 2.1. Containers
- 2.2. Tankers
- 2.3. General Cargo
- 2.4. Bulk Container
- 2.5. Others
UK Bunker Fuel Industry Segmentation By Geography
-
1. North America
- 1.1. United States
- 1.2. Canada
- 1.3. Mexico
-
2. South America
- 2.1. Brazil
- 2.2. Argentina
- 2.3. Rest of South America
-
3. Europe
- 3.1. United Kingdom
- 3.2. Germany
- 3.3. France
- 3.4. Italy
- 3.5. Spain
- 3.6. Russia
- 3.7. Benelux
- 3.8. Nordics
- 3.9. Rest of Europe
-
4. Middle East & Africa
- 4.1. Turkey
- 4.2. Israel
- 4.3. GCC
- 4.4. North Africa
- 4.5. South Africa
- 4.6. Rest of Middle East & Africa
-
5. Asia Pacific
- 5.1. China
- 5.2. India
- 5.3. Japan
- 5.4. South Korea
- 5.5. ASEAN
- 5.6. Oceania
- 5.7. Rest of Asia Pacific
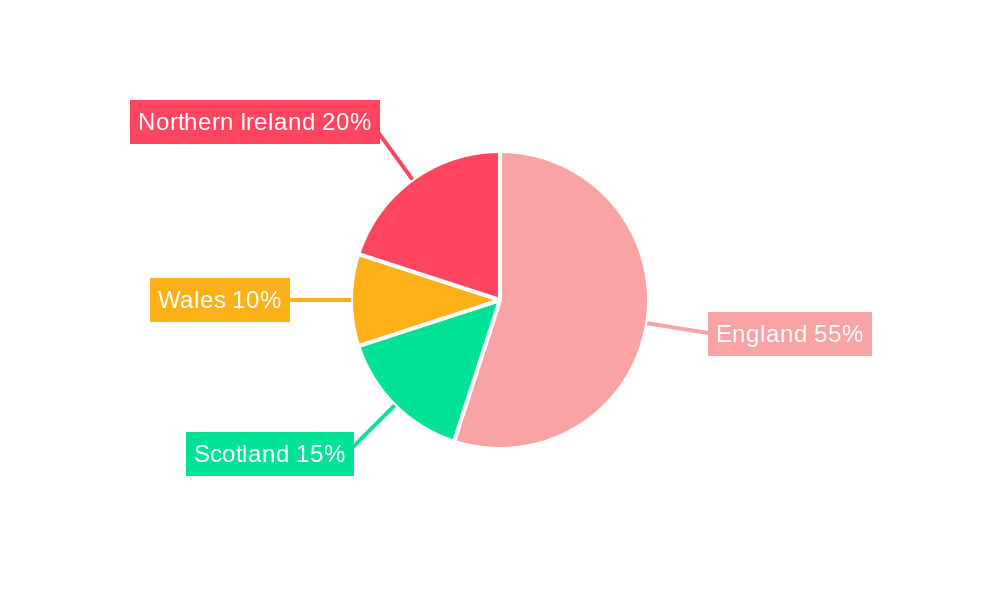
UK Bunker Fuel Industry Regional Market Share
Geographic Coverage of UK Bunker Fuel Industry
UK Bunker Fuel Industry REPORT HIGHLIGHTS
| Aspects | Details |
|---|---|
| Study Period | 2020-2034 |
| Base Year | 2025 |
| Estimated Year | 2026 |
| Forecast Period | 2026-2034 |
| Historical Period | 2020-2025 |
| Growth Rate | CAGR of 5.6% from 2020-2034 |
| Segmentation |
|
Table of Contents
- 1. Introduction
- 1.1. Research Scope
- 1.2. Market Segmentation
- 1.3. Research Objective
- 1.4. Definitions and Assumptions
- 2. Executive Summary
- 2.1. Market Snapshot
- 3. Market Dynamics
- 3.1. Market Drivers
- 3.2. Market Restrains
- 3.3. Market Trends
- 3.4. Market Opportunities
- 4. Market Factor Analysis
- 4.1. Porters Five Forces
- 4.1.1. Bargaining Power of Suppliers
- 4.1.2. Bargaining Power of Buyers
- 4.1.3. Threat of New Entrants
- 4.1.4. Threat of Substitutes
- 4.1.5. Competitive Rivalry
- 4.2. PESTEL analysis
- 4.3. BCG Analysis
- 4.3.1. Stars (High Growth, High Market Share)
- 4.3.2. Cash Cows (Low Growth, High Market Share)
- 4.3.3. Question Mark (High Growth, Low Market Share)
- 4.3.4. Dogs (Low Growth, Low Market Share)
- 4.4. Ansoff Matrix Analysis
- 4.5. Supply Chain Analysis
- 4.6. Regulatory Landscape
- 4.7. Current Market Potential and Opportunity Assessment (TAM–SAM–SOM Framework)
- 4.8. MDP Analyst Note
- 4.1. Porters Five Forces
- 5. Market Analysis, Insights and Forecast 2021-2033
- 5.1. Market Analysis, Insights and Forecast - by Type
- 5.1.1. High Sulfur Fuel Oil (HSFO)
- 5.1.2. Very-Low Sulfur Fuel Oil (VLSFO)
- 5.1.3. Marine Gas Oil (MGO)
- 5.1.4. Liquefied Natural Gas (LNG)
- 5.1.5. Others
- 5.2. Market Analysis, Insights and Forecast - by Vessel Type
- 5.2.1. Containers
- 5.2.2. Tankers
- 5.2.3. General Cargo
- 5.2.4. Bulk Container
- 5.2.5. Others
- 5.3. Market Analysis, Insights and Forecast - by Region
- 5.3.1. North America
- 5.3.2. South America
- 5.3.3. Europe
- 5.3.4. Middle East & Africa
- 5.3.5. Asia Pacific
- 5.1. Market Analysis, Insights and Forecast - by Type
- 6. Global UK Bunker Fuel Industry Analysis, Insights and Forecast, 2021-2033
- 6.1. Market Analysis, Insights and Forecast - by Type
- 6.1.1. High Sulfur Fuel Oil (HSFO)
- 6.1.2. Very-Low Sulfur Fuel Oil (VLSFO)
- 6.1.3. Marine Gas Oil (MGO)
- 6.1.4. Liquefied Natural Gas (LNG)
- 6.1.5. Others
- 6.2. Market Analysis, Insights and Forecast - by Vessel Type
- 6.2.1. Containers
- 6.2.2. Tankers
- 6.2.3. General Cargo
- 6.2.4. Bulk Container
- 6.2.5. Others
- 6.1. Market Analysis, Insights and Forecast - by Type
- 7. North America UK Bunker Fuel Industry Analysis, Insights and Forecast, 2020-2032
- 7.1. Market Analysis, Insights and Forecast - by Type
- 7.1.1. High Sulfur Fuel Oil (HSFO)
- 7.1.2. Very-Low Sulfur Fuel Oil (VLSFO)
- 7.1.3. Marine Gas Oil (MGO)
- 7.1.4. Liquefied Natural Gas (LNG)
- 7.1.5. Others
- 7.2. Market Analysis, Insights and Forecast - by Vessel Type
- 7.2.1. Containers
- 7.2.2. Tankers
- 7.2.3. General Cargo
- 7.2.4. Bulk Container
- 7.2.5. Others
- 7.1. Market Analysis, Insights and Forecast - by Type
- 8. South America UK Bunker Fuel Industry Analysis, Insights and Forecast, 2020-2032
- 8.1. Market Analysis, Insights and Forecast - by Type
- 8.1.1. High Sulfur Fuel Oil (HSFO)
- 8.1.2. Very-Low Sulfur Fuel Oil (VLSFO)
- 8.1.3. Marine Gas Oil (MGO)
- 8.1.4. Liquefied Natural Gas (LNG)
- 8.1.5. Others
- 8.2. Market Analysis, Insights and Forecast - by Vessel Type
- 8.2.1. Containers
- 8.2.2. Tankers
- 8.2.3. General Cargo
- 8.2.4. Bulk Container
- 8.2.5. Others
- 8.1. Market Analysis, Insights and Forecast - by Type
- 9. Europe UK Bunker Fuel Industry Analysis, Insights and Forecast, 2020-2032
- 9.1. Market Analysis, Insights and Forecast - by Type
- 9.1.1. High Sulfur Fuel Oil (HSFO)
- 9.1.2. Very-Low Sulfur Fuel Oil (VLSFO)
- 9.1.3. Marine Gas Oil (MGO)
- 9.1.4. Liquefied Natural Gas (LNG)
- 9.1.5. Others
- 9.2. Market Analysis, Insights and Forecast - by Vessel Type
- 9.2.1. Containers
- 9.2.2. Tankers
- 9.2.3. General Cargo
- 9.2.4. Bulk Container
- 9.2.5. Others
- 9.1. Market Analysis, Insights and Forecast - by Type
- 10. Middle East & Africa UK Bunker Fuel Industry Analysis, Insights and Forecast, 2020-2032
- 10.1. Market Analysis, Insights and Forecast - by Type
- 10.1.1. High Sulfur Fuel Oil (HSFO)
- 10.1.2. Very-Low Sulfur Fuel Oil (VLSFO)
- 10.1.3. Marine Gas Oil (MGO)
- 10.1.4. Liquefied Natural Gas (LNG)
- 10.1.5. Others
- 10.2. Market Analysis, Insights and Forecast - by Vessel Type
- 10.2.1. Containers
- 10.2.2. Tankers
- 10.2.3. General Cargo
- 10.2.4. Bulk Container
- 10.2.5. Others
- 10.1. Market Analysis, Insights and Forecast - by Type
- 11. Asia Pacific UK Bunker Fuel Industry Analysis, Insights and Forecast, 2020-2032
- 11.1. Market Analysis, Insights and Forecast - by Type
- 11.1.1. High Sulfur Fuel Oil (HSFO)
- 11.1.2. Very-Low Sulfur Fuel Oil (VLSFO)
- 11.1.3. Marine Gas Oil (MGO)
- 11.1.4. Liquefied Natural Gas (LNG)
- 11.1.5. Others
- 11.2. Market Analysis, Insights and Forecast - by Vessel Type
- 11.2.1. Containers
- 11.2.2. Tankers
- 11.2.3. General Cargo
- 11.2.4. Bulk Container
- 11.2.5. Others
- 11.1. Market Analysis, Insights and Forecast - by Type
- 12. Competitive Analysis
- 12.1. Company Profiles
- 12.1.1 Phillips 66
- 12.1.1.1. Company Overview
- 12.1.1.2. Products
- 12.1.1.3. Company Financials
- 12.1.1.4. SWOT Analysis
- 12.1.2 Maritime Bunkering Ltd
- 12.1.2.1. Company Overview
- 12.1.2.2. Products
- 12.1.2.3. Company Financials
- 12.1.2.4. SWOT Analysis
- 12.1.3 GB Oils Ltd
- 12.1.3.1. Company Overview
- 12.1.3.2. Products
- 12.1.3.3. Company Financials
- 12.1.3.4. SWOT Analysis
- 12.1.4 Shell Marine Products Ltd
- 12.1.4.1. Company Overview
- 12.1.4.2. Products
- 12.1.4.3. Company Financials
- 12.1.4.4. SWOT Analysis
- 12.1.5 Exxon Mobil Corporation
- 12.1.5.1. Company Overview
- 12.1.5.2. Products
- 12.1.5.3. Company Financials
- 12.1.5.4. SWOT Analysis
- 12.1.6 Mærsk A/S
- 12.1.6.1. Company Overview
- 12.1.6.2. Products
- 12.1.6.3. Company Financials
- 12.1.6.4. SWOT Analysis
- 12.1.7 ConocoPhillips Ltd
- 12.1.7.1. Company Overview
- 12.1.7.2. Products
- 12.1.7.3. Company Financials
- 12.1.7.4. SWOT Analysis
- 12.1.8 Greenergy International Ltd
- 12.1.8.1. Company Overview
- 12.1.8.2. Products
- 12.1.8.3. Company Financials
- 12.1.8.4. SWOT Analysis
- 12.1.9 Rosneft Marine UK Ltd *List Not Exhaustive
- 12.1.9.1. Company Overview
- 12.1.9.2. Products
- 12.1.9.3. Company Financials
- 12.1.9.4. SWOT Analysis
- 12.1.10 BP PLC
- 12.1.10.1. Company Overview
- 12.1.10.2. Products
- 12.1.10.3. Company Financials
- 12.1.10.4. SWOT Analysis
- 12.1.11 Henty Oil Ltd
- 12.1.11.1. Company Overview
- 12.1.11.2. Products
- 12.1.11.3. Company Financials
- 12.1.11.4. SWOT Analysis
- 12.1.1 Phillips 66
- 12.2. Market Entropy
- 12.2.1 Company's Key Areas Served
- 12.2.2 Recent Developments
- 12.3. Company Market Share Analysis 2025
- 12.3.1 Top 5 Companies Market Share Analysis
- 12.3.2 Top 3 Companies Market Share Analysis
- 12.4. List of Potential Customers
- 13. Research Methodology
List of Figures
- Figure 1: Global UK Bunker Fuel Industry Revenue Breakdown (billion, %) by Region 2025 & 2033
- Figure 2: Global UK Bunker Fuel Industry Volume Breakdown (K Tons, %) by Region 2025 & 2033
- Figure 3: North America UK Bunker Fuel Industry Revenue (billion), by Type 2025 & 2033
- Figure 4: North America UK Bunker Fuel Industry Volume (K Tons), by Type 2025 & 2033
- Figure 5: North America UK Bunker Fuel Industry Revenue Share (%), by Type 2025 & 2033
- Figure 6: North America UK Bunker Fuel Industry Volume Share (%), by Type 2025 & 2033
- Figure 7: North America UK Bunker Fuel Industry Revenue (billion), by Vessel Type 2025 & 2033
- Figure 8: North America UK Bunker Fuel Industry Volume (K Tons), by Vessel Type 2025 & 2033
- Figure 9: North America UK Bunker Fuel Industry Revenue Share (%), by Vessel Type 2025 & 2033
- Figure 10: North America UK Bunker Fuel Industry Volume Share (%), by Vessel Type 2025 & 2033
- Figure 11: North America UK Bunker Fuel Industry Revenue (billion), by Country 2025 & 2033
- Figure 12: North America UK Bunker Fuel Industry Volume (K Tons), by Country 2025 & 2033
- Figure 13: North America UK Bunker Fuel Industry Revenue Share (%), by Country 2025 & 2033
- Figure 14: North America UK Bunker Fuel Industry Volume Share (%), by Country 2025 & 2033
- Figure 15: South America UK Bunker Fuel Industry Revenue (billion), by Type 2025 & 2033
- Figure 16: South America UK Bunker Fuel Industry Volume (K Tons), by Type 2025 & 2033
- Figure 17: South America UK Bunker Fuel Industry Revenue Share (%), by Type 2025 & 2033
- Figure 18: South America UK Bunker Fuel Industry Volume Share (%), by Type 2025 & 2033
- Figure 19: South America UK Bunker Fuel Industry Revenue (billion), by Vessel Type 2025 & 2033
- Figure 20: South America UK Bunker Fuel Industry Volume (K Tons), by Vessel Type 2025 & 2033
- Figure 21: South America UK Bunker Fuel Industry Revenue Share (%), by Vessel Type 2025 & 2033
- Figure 22: South America UK Bunker Fuel Industry Volume Share (%), by Vessel Type 2025 & 2033
- Figure 23: South America UK Bunker Fuel Industry Revenue (billion), by Country 2025 & 2033
- Figure 24: South America UK Bunker Fuel Industry Volume (K Tons), by Country 2025 & 2033
- Figure 25: South America UK Bunker Fuel Industry Revenue Share (%), by Country 2025 & 2033
- Figure 26: South America UK Bunker Fuel Industry Volume Share (%), by Country 2025 & 2033
- Figure 27: Europe UK Bunker Fuel Industry Revenue (billion), by Type 2025 & 2033
- Figure 28: Europe UK Bunker Fuel Industry Volume (K Tons), by Type 2025 & 2033
- Figure 29: Europe UK Bunker Fuel Industry Revenue Share (%), by Type 2025 & 2033
- Figure 30: Europe UK Bunker Fuel Industry Volume Share (%), by Type 2025 & 2033
- Figure 31: Europe UK Bunker Fuel Industry Revenue (billion), by Vessel Type 2025 & 2033
- Figure 32: Europe UK Bunker Fuel Industry Volume (K Tons), by Vessel Type 2025 & 2033
- Figure 33: Europe UK Bunker Fuel Industry Revenue Share (%), by Vessel Type 2025 & 2033
- Figure 34: Europe UK Bunker Fuel Industry Volume Share (%), by Vessel Type 2025 & 2033
- Figure 35: Europe UK Bunker Fuel Industry Revenue (billion), by Country 2025 & 2033
- Figure 36: Europe UK Bunker Fuel Industry Volume (K Tons), by Country 2025 & 2033
- Figure 37: Europe UK Bunker Fuel Industry Revenue Share (%), by Country 2025 & 2033
- Figure 38: Europe UK Bunker Fuel Industry Volume Share (%), by Country 2025 & 2033
- Figure 39: Middle East & Africa UK Bunker Fuel Industry Revenue (billion), by Type 2025 & 2033
- Figure 40: Middle East & Africa UK Bunker Fuel Industry Volume (K Tons), by Type 2025 & 2033
- Figure 41: Middle East & Africa UK Bunker Fuel Industry Revenue Share (%), by Type 2025 & 2033
- Figure 42: Middle East & Africa UK Bunker Fuel Industry Volume Share (%), by Type 2025 & 2033
- Figure 43: Middle East & Africa UK Bunker Fuel Industry Revenue (billion), by Vessel Type 2025 & 2033
- Figure 44: Middle East & Africa UK Bunker Fuel Industry Volume (K Tons), by Vessel Type 2025 & 2033
- Figure 45: Middle East & Africa UK Bunker Fuel Industry Revenue Share (%), by Vessel Type 2025 & 2033
- Figure 46: Middle East & Africa UK Bunker Fuel Industry Volume Share (%), by Vessel Type 2025 & 2033
- Figure 47: Middle East & Africa UK Bunker Fuel Industry Revenue (billion), by Country 2025 & 2033
- Figure 48: Middle East & Africa UK Bunker Fuel Industry Volume (K Tons), by Country 2025 & 2033
- Figure 49: Middle East & Africa UK Bunker Fuel Industry Revenue Share (%), by Country 2025 & 2033
- Figure 50: Middle East & Africa UK Bunker Fuel Industry Volume Share (%), by Country 2025 & 2033
- Figure 51: Asia Pacific UK Bunker Fuel Industry Revenue (billion), by Type 2025 & 2033
- Figure 52: Asia Pacific UK Bunker Fuel Industry Volume (K Tons), by Type 2025 & 2033
- Figure 53: Asia Pacific UK Bunker Fuel Industry Revenue Share (%), by Type 2025 & 2033
- Figure 54: Asia Pacific UK Bunker Fuel Industry Volume Share (%), by Type 2025 & 2033
- Figure 55: Asia Pacific UK Bunker Fuel Industry Revenue (billion), by Vessel Type 2025 & 2033
- Figure 56: Asia Pacific UK Bunker Fuel Industry Volume (K Tons), by Vessel Type 2025 & 2033
- Figure 57: Asia Pacific UK Bunker Fuel Industry Revenue Share (%), by Vessel Type 2025 & 2033
- Figure 58: Asia Pacific UK Bunker Fuel Industry Volume Share (%), by Vessel Type 2025 & 2033
- Figure 59: Asia Pacific UK Bunker Fuel Industry Revenue (billion), by Country 2025 & 2033
- Figure 60: Asia Pacific UK Bunker Fuel Industry Volume (K Tons), by Country 2025 & 2033
- Figure 61: Asia Pacific UK Bunker Fuel Industry Revenue Share (%), by Country 2025 & 2033
- Figure 62: Asia Pacific UK Bunker Fuel Industry Volume Share (%), by Country 2025 & 2033
List of Tables
- Table 1: Global UK Bunker Fuel Industry Revenue billion Forecast, by Type 2020 & 2033
- Table 2: Global UK Bunker Fuel Industry Volume K Tons Forecast, by Type 2020 & 2033
- Table 3: Global UK Bunker Fuel Industry Revenue billion Forecast, by Vessel Type 2020 & 2033
- Table 4: Global UK Bunker Fuel Industry Volume K Tons Forecast, by Vessel Type 2020 & 2033
- Table 5: Global UK Bunker Fuel Industry Revenue billion Forecast, by Region 2020 & 2033
- Table 6: Global UK Bunker Fuel Industry Volume K Tons Forecast, by Region 2020 & 2033
- Table 7: Global UK Bunker Fuel Industry Revenue billion Forecast, by Type 2020 & 2033
- Table 8: Global UK Bunker Fuel Industry Volume K Tons Forecast, by Type 2020 & 2033
- Table 9: Global UK Bunker Fuel Industry Revenue billion Forecast, by Vessel Type 2020 & 2033
- Table 10: Global UK Bunker Fuel Industry Volume K Tons Forecast, by Vessel Type 2020 & 2033
- Table 11: Global UK Bunker Fuel Industry Revenue billion Forecast, by Country 2020 & 2033
- Table 12: Global UK Bunker Fuel Industry Volume K Tons Forecast, by Country 2020 & 2033
- Table 13: United States UK Bunker Fuel Industry Revenue (billion) Forecast, by Application 2020 & 2033
- Table 14: United States UK Bunker Fuel Industry Volume (K Tons) Forecast, by Application 2020 & 2033
- Table 15: Canada UK Bunker Fuel Industry Revenue (billion) Forecast, by Application 2020 & 2033
- Table 16: Canada UK Bunker Fuel Industry Volume (K Tons) Forecast, by Application 2020 & 2033
- Table 17: Mexico UK Bunker Fuel Industry Revenue (billion) Forecast, by Application 2020 & 2033
- Table 18: Mexico UK Bunker Fuel Industry Volume (K Tons) Forecast, by Application 2020 & 2033
- Table 19: Global UK Bunker Fuel Industry Revenue billion Forecast, by Type 2020 & 2033
- Table 20: Global UK Bunker Fuel Industry Volume K Tons Forecast, by Type 2020 & 2033
- Table 21: Global UK Bunker Fuel Industry Revenue billion Forecast, by Vessel Type 2020 & 2033
- Table 22: Global UK Bunker Fuel Industry Volume K Tons Forecast, by Vessel Type 2020 & 2033
- Table 23: Global UK Bunker Fuel Industry Revenue billion Forecast, by Country 2020 & 2033
- Table 24: Global UK Bunker Fuel Industry Volume K Tons Forecast, by Country 2020 & 2033
- Table 25: Brazil UK Bunker Fuel Industry Revenue (billion) Forecast, by Application 2020 & 2033
- Table 26: Brazil UK Bunker Fuel Industry Volume (K Tons) Forecast, by Application 2020 & 2033
- Table 27: Argentina UK Bunker Fuel Industry Revenue (billion) Forecast, by Application 2020 & 2033
- Table 28: Argentina UK Bunker Fuel Industry Volume (K Tons) Forecast, by Application 2020 & 2033
- Table 29: Rest of South America UK Bunker Fuel Industry Revenue (billion) Forecast, by Application 2020 & 2033
- Table 30: Rest of South America UK Bunker Fuel Industry Volume (K Tons) Forecast, by Application 2020 & 2033
- Table 31: Global UK Bunker Fuel Industry Revenue billion Forecast, by Type 2020 & 2033
- Table 32: Global UK Bunker Fuel Industry Volume K Tons Forecast, by Type 2020 & 2033
- Table 33: Global UK Bunker Fuel Industry Revenue billion Forecast, by Vessel Type 2020 & 2033
- Table 34: Global UK Bunker Fuel Industry Volume K Tons Forecast, by Vessel Type 2020 & 2033
- Table 35: Global UK Bunker Fuel Industry Revenue billion Forecast, by Country 2020 & 2033
- Table 36: Global UK Bunker Fuel Industry Volume K Tons Forecast, by Country 2020 & 2033
- Table 37: United Kingdom UK Bunker Fuel Industry Revenue (billion) Forecast, by Application 2020 & 2033
- Table 38: United Kingdom UK Bunker Fuel Industry Volume (K Tons) Forecast, by Application 2020 & 2033
- Table 39: Germany UK Bunker Fuel Industry Revenue (billion) Forecast, by Application 2020 & 2033
- Table 40: Germany UK Bunker Fuel Industry Volume (K Tons) Forecast, by Application 2020 & 2033
- Table 41: France UK Bunker Fuel Industry Revenue (billion) Forecast, by Application 2020 & 2033
- Table 42: France UK Bunker Fuel Industry Volume (K Tons) Forecast, by Application 2020 & 2033
- Table 43: Italy UK Bunker Fuel Industry Revenue (billion) Forecast, by Application 2020 & 2033
- Table 44: Italy UK Bunker Fuel Industry Volume (K Tons) Forecast, by Application 2020 & 2033
- Table 45: Spain UK Bunker Fuel Industry Revenue (billion) Forecast, by Application 2020 & 2033
- Table 46: Spain UK Bunker Fuel Industry Volume (K Tons) Forecast, by Application 2020 & 2033
- Table 47: Russia UK Bunker Fuel Industry Revenue (billion) Forecast, by Application 2020 & 2033
- Table 48: Russia UK Bunker Fuel Industry Volume (K Tons) Forecast, by Application 2020 & 2033
- Table 49: Benelux UK Bunker Fuel Industry Revenue (billion) Forecast, by Application 2020 & 2033
- Table 50: Benelux UK Bunker Fuel Industry Volume (K Tons) Forecast, by Application 2020 & 2033
- Table 51: Nordics UK Bunker Fuel Industry Revenue (billion) Forecast, by Application 2020 & 2033
- Table 52: Nordics UK Bunker Fuel Industry Volume (K Tons) Forecast, by Application 2020 & 2033
- Table 53: Rest of Europe UK Bunker Fuel Industry Revenue (billion) Forecast, by Application 2020 & 2033
- Table 54: Rest of Europe UK Bunker Fuel Industry Volume (K Tons) Forecast, by Application 2020 & 2033
- Table 55: Global UK Bunker Fuel Industry Revenue billion Forecast, by Type 2020 & 2033
- Table 56: Global UK Bunker Fuel Industry Volume K Tons Forecast, by Type 2020 & 2033
- Table 57: Global UK Bunker Fuel Industry Revenue billion Forecast, by Vessel Type 2020 & 2033
- Table 58: Global UK Bunker Fuel Industry Volume K Tons Forecast, by Vessel Type 2020 & 2033
- Table 59: Global UK Bunker Fuel Industry Revenue billion Forecast, by Country 2020 & 2033
- Table 60: Global UK Bunker Fuel Industry Volume K Tons Forecast, by Country 2020 & 2033
- Table 61: Turkey UK Bunker Fuel Industry Revenue (billion) Forecast, by Application 2020 & 2033
- Table 62: Turkey UK Bunker Fuel Industry Volume (K Tons) Forecast, by Application 2020 & 2033
- Table 63: Israel UK Bunker Fuel Industry Revenue (billion) Forecast, by Application 2020 & 2033
- Table 64: Israel UK Bunker Fuel Industry Volume (K Tons) Forecast, by Application 2020 & 2033
- Table 65: GCC UK Bunker Fuel Industry Revenue (billion) Forecast, by Application 2020 & 2033
- Table 66: GCC UK Bunker Fuel Industry Volume (K Tons) Forecast, by Application 2020 & 2033
- Table 67: North Africa UK Bunker Fuel Industry Revenue (billion) Forecast, by Application 2020 & 2033
- Table 68: North Africa UK Bunker Fuel Industry Volume (K Tons) Forecast, by Application 2020 & 2033
- Table 69: South Africa UK Bunker Fuel Industry Revenue (billion) Forecast, by Application 2020 & 2033
- Table 70: South Africa UK Bunker Fuel Industry Volume (K Tons) Forecast, by Application 2020 & 2033
- Table 71: Rest of Middle East & Africa UK Bunker Fuel Industry Revenue (billion) Forecast, by Application 2020 & 2033
- Table 72: Rest of Middle East & Africa UK Bunker Fuel Industry Volume (K Tons) Forecast, by Application 2020 & 2033
- Table 73: Global UK Bunker Fuel Industry Revenue billion Forecast, by Type 2020 & 2033
- Table 74: Global UK Bunker Fuel Industry Volume K Tons Forecast, by Type 2020 & 2033
- Table 75: Global UK Bunker Fuel Industry Revenue billion Forecast, by Vessel Type 2020 & 2033
- Table 76: Global UK Bunker Fuel Industry Volume K Tons Forecast, by Vessel Type 2020 & 2033
- Table 77: Global UK Bunker Fuel Industry Revenue billion Forecast, by Country 2020 & 2033
- Table 78: Global UK Bunker Fuel Industry Volume K Tons Forecast, by Country 2020 & 2033
- Table 79: China UK Bunker Fuel Industry Revenue (billion) Forecast, by Application 2020 & 2033
- Table 80: China UK Bunker Fuel Industry Volume (K Tons) Forecast, by Application 2020 & 2033
- Table 81: India UK Bunker Fuel Industry Revenue (billion) Forecast, by Application 2020 & 2033
- Table 82: India UK Bunker Fuel Industry Volume (K Tons) Forecast, by Application 2020 & 2033
- Table 83: Japan UK Bunker Fuel Industry Revenue (billion) Forecast, by Application 2020 & 2033
- Table 84: Japan UK Bunker Fuel Industry Volume (K Tons) Forecast, by Application 2020 & 2033
- Table 85: South Korea UK Bunker Fuel Industry Revenue (billion) Forecast, by Application 2020 & 2033
- Table 86: South Korea UK Bunker Fuel Industry Volume (K Tons) Forecast, by Application 2020 & 2033
- Table 87: ASEAN UK Bunker Fuel Industry Revenue (billion) Forecast, by Application 2020 & 2033
- Table 88: ASEAN UK Bunker Fuel Industry Volume (K Tons) Forecast, by Application 2020 & 2033
- Table 89: Oceania UK Bunker Fuel Industry Revenue (billion) Forecast, by Application 2020 & 2033
- Table 90: Oceania UK Bunker Fuel Industry Volume (K Tons) Forecast, by Application 2020 & 2033
- Table 91: Rest of Asia Pacific UK Bunker Fuel Industry Revenue (billion) Forecast, by Application 2020 & 2033
- Table 92: Rest of Asia Pacific UK Bunker Fuel Industry Volume (K Tons) Forecast, by Application 2020 & 2033
Frequently Asked Questions
1. What is the projected Compound Annual Growth Rate (CAGR) of the UK Bunker Fuel Industry?
The projected CAGR is approximately 5.6%.
2. Which companies are prominent players in the UK Bunker Fuel Industry?
Key companies in the market include Phillips 66, Maritime Bunkering Ltd, GB Oils Ltd, Shell Marine Products Ltd, Exxon Mobil Corporation, Mærsk A/S, ConocoPhillips Ltd, Greenergy International Ltd, Rosneft Marine UK Ltd *List Not Exhaustive, BP PLC, Henty Oil Ltd.
3. What are the main segments of the UK Bunker Fuel Industry?
The market segments include Type, Vessel Type.
4. Can you provide details about the market size?
The market size is estimated to be USD 172.5 billion as of 2022.
5. What are some drivers contributing to market growth?
4.; Increasing Demand for Petroleum Products Due to the Growth of the Local Economy4.; Government Initiatives to Boost the Production of Crude Oil and Natural Gas.
6. What are the notable trends driving market growth?
Very Low Sulphur Fuel Oil (VLSFO) to Witness Significant Growth.
7. Are there any restraints impacting market growth?
4.; Increasing Adoption of Renewable Energy.
8. Can you provide examples of recent developments in the market?
Investments in LNG bunkering infrastructure and partnerships
9. What pricing options are available for accessing the report?
Pricing options include single-user, multi-user, and enterprise licenses priced at USD 3800, USD 4500, and USD 5800 respectively.
10. Is the market size provided in terms of value or volume?
The market size is provided in terms of value, measured in billion and volume, measured in K Tons.
11. Are there any specific market keywords associated with the report?
Yes, the market keyword associated with the report is "UK Bunker Fuel Industry," which aids in identifying and referencing the specific market segment covered.
12. How do I determine which pricing option suits my needs best?
The pricing options vary based on user requirements and access needs. Individual users may opt for single-user licenses, while businesses requiring broader access may choose multi-user or enterprise licenses for cost-effective access to the report.
13. Are there any additional resources or data provided in the UK Bunker Fuel Industry report?
While the report offers comprehensive insights, it's advisable to review the specific contents or supplementary materials provided to ascertain if additional resources or data are available.
14. How can I stay updated on further developments or reports in the UK Bunker Fuel Industry?
To stay informed about further developments, trends, and reports in the UK Bunker Fuel Industry, consider subscribing to industry newsletters, following relevant companies and organizations, or regularly checking reputable industry news sources and publications.
Methodology
Step 1 - Identification of Relevant Samples Size from Population Database


Step 2 - Approaches for Defining Global Market Size (Value, Volume* & Price*)

Note*: In applicable scenarios
Step 3 - Data Sources
Primary Research
- Web Analytics
- Survey Reports
- Research Institute
- Latest Research Reports
- Opinion Leaders
Secondary Research
- Annual Reports
- White Paper
- Latest Press Release
- Industry Association
- Paid Database
- Investor Presentations

Step 4 - Data Triangulation
Involves using different sources of information in order to increase the validity of a study
These sources are likely to be stakeholders in a program - participants, other researchers, program staff, other community members, and so on.
Then we put all data in single framework & apply various statistical tools to find out the dynamic on the market.
During the analysis stage, feedback from the stakeholder groups would be compared to determine areas of agreement as well as areas of divergence