

Key Insights
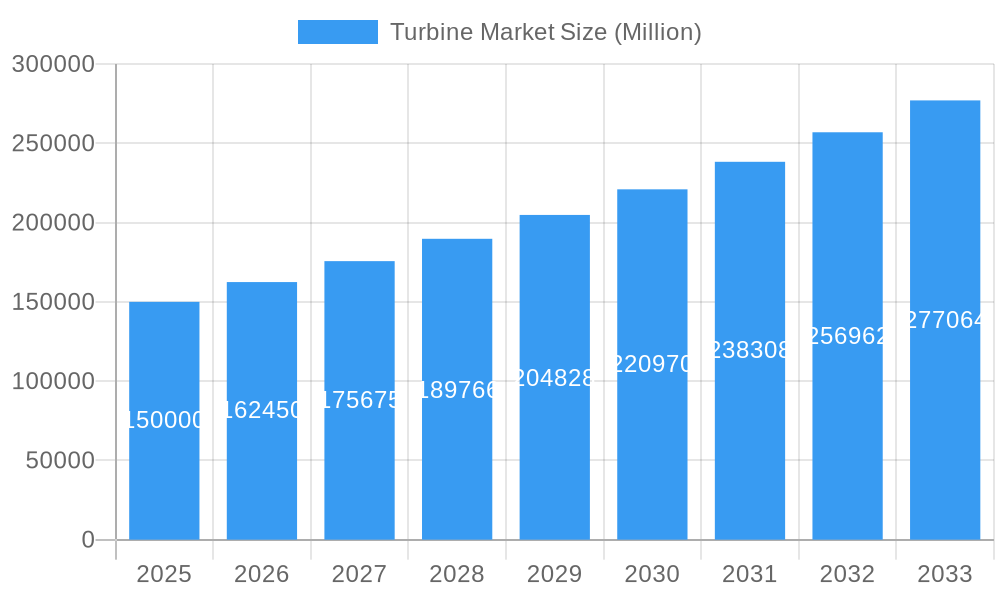
The global turbine market is experiencing robust growth, projected to maintain a Compound Annual Growth Rate (CAGR) exceeding 8.10% from 2025 to 2033. This expansion is fueled by several key drivers. The increasing demand for renewable energy sources, particularly wind and hydro power, is significantly boosting the market for wind and hydro turbines. Furthermore, the ongoing need for efficient and reliable power generation in various sectors, including electricity generation and industrial processes, is driving demand for steam and gas turbines. Government initiatives promoting clean energy transition and stricter emission regulations are further accelerating market growth. Technological advancements leading to improved turbine efficiency, reduced maintenance costs, and increased lifespan also contribute to the market's positive trajectory. Market segmentation reveals a strong presence of wind turbines, followed by steam and gas turbines, reflecting the global shift towards renewable energy and the continued reliance on traditional power sources. Key players like Bharat Heavy Electricals Limited (BHEL), Siemens AG, Vestas Wind Systems, and General Electric Company are shaping the competitive landscape through technological innovation and strategic partnerships. Geographical analysis suggests a strong market presence in North America, Europe, and Asia Pacific, driven by significant investments in energy infrastructure and renewable energy projects within these regions.
Turbine Market Market Size (In Billion)
Despite the positive outlook, the turbine market faces some challenges. The high initial investment costs associated with turbine installations can act as a restraint, especially for smaller projects. Fluctuations in raw material prices and supply chain disruptions can also impact market growth. Furthermore, the integration of renewable energy sources into existing power grids requires significant infrastructure development, which can pose a challenge. However, ongoing technological advancements, coupled with supportive government policies and increasing private sector investments, are mitigating these challenges and ensuring sustained market growth. The market is expected to witness substantial growth in offshore wind turbine technology, driven by the vast untapped potential of offshore wind resources, and an increasing focus on hybrid power generation systems that combine renewable and conventional sources. The continued development of more efficient and sustainable turbines will be a key factor in shaping the future of the market.
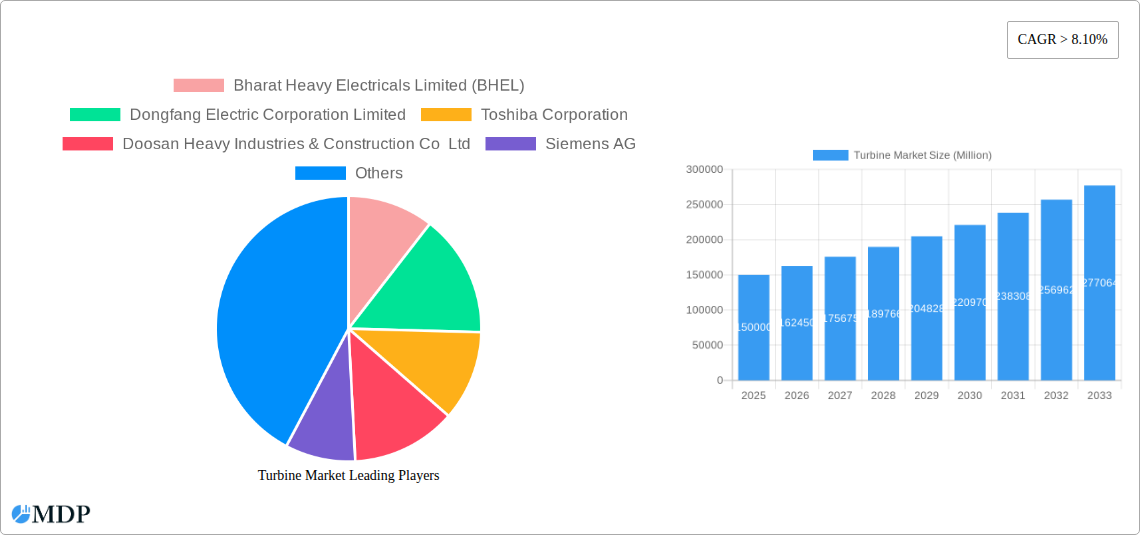
Turbine Market Company Market Share
Turbine Market Report: 2019-2033 Forecast - A Comprehensive Analysis
This comprehensive report provides an in-depth analysis of the global Turbine Market, offering crucial insights for investors, industry stakeholders, and strategic decision-makers. With a detailed study period spanning 2019-2033, including a base year of 2025 and a forecast period of 2025-2033, this report unveils the market dynamics, trends, and future prospects across various turbine segments. The market is expected to reach xx Million by 2033, exhibiting a CAGR of xx% during the forecast period.
Turbine Market Market Dynamics & Concentration
The global turbine market is characterized by a moderately concentrated landscape, with key players like Bharat Heavy Electricals Limited (BHEL), Dongfang Electric Corporation Limited, Toshiba Corporation, Doosan Heavy Industries & Construction Co Ltd, Siemens AG, Vestas Wind System A/S, Mitsubishi Hitachi Power Systems Ltd (MHPS), General Electric Company, Enercon GmbH, and Harbin Electric Company Limited holding significant market share. The market concentration ratio (CR4) is estimated at xx% in 2025. Innovation is driven by the demand for higher efficiency, lower emissions, and increased power generation capacity. Stringent regulatory frameworks, particularly concerning environmental regulations and safety standards, are shaping market growth. Product substitutes, such as solar and nuclear power, pose a competitive threat, although the reliance on reliable baseload power continues to favor turbine technologies. End-user trends indicate a growing preference for renewable energy sources and decentralized power generation. M&A activities in the sector, with an estimated xx deals in the last 5 years, show consolidation and efforts to expand market presence.
- Market Share: BHEL (xx%), Dongfang (xx%), Toshiba (xx%), others (xx%).
- M&A Deal Counts (2020-2024): xx
Turbine Market Industry Trends & Analysis
The turbine market is experiencing significant growth driven by increasing global energy demand, particularly in developing economies. The rising adoption of renewable energy sources, particularly wind and hydro power, is a key driver, fueling demand for wind turbines and hydro turbines. Technological advancements, such as the development of more efficient and robust turbine designs, are also contributing to market expansion. Consumer preferences are shifting towards cleaner and sustainable energy solutions, driving demand for environmentally friendly turbine technologies. Competitive dynamics are intense, with major players investing heavily in R&D and strategic partnerships to gain a competitive edge. The market is witnessing a gradual shift towards larger turbine capacities to improve economies of scale and reduce costs. The penetration of offshore wind turbines is also increasing, driven by vast untapped resources in coastal areas.
Leading Markets & Segments in Turbine Market
The Asia-Pacific region dominates the global turbine market, driven by rapid economic growth, expanding industrialization, and substantial investments in energy infrastructure. China and India are particularly significant markets within this region.
Key Drivers:
- Economic Policies: Favorable government policies and subsidies promoting renewable energy adoption.
- Infrastructure Development: Investments in grid infrastructure and power generation projects.
- Growing Energy Demand: Rising energy consumption across residential, commercial, and industrial sectors.
Segment Dominance:
- Wind Turbines: This segment holds the largest market share, driven by increasing demand for renewable energy and government support for wind energy projects.
- Hydro Turbines: This segment holds a significant share, particularly in regions with abundant hydropower resources.
- Steam Turbines (Offshore & Steam Cycle): These segments exhibit steady growth, fueled by the power generation needs of industries and coastal regions.
- Gas Turbines (Open Cycle): This segment demonstrates moderate growth, driven by the need for peaking power and industrial applications.
Turbine Market Product Developments
Recent product innovations focus on enhancing turbine efficiency, reducing operational costs, and improving reliability. Advanced materials, improved blade designs, and smart grid integration are key technological trends. New applications for turbines are emerging in diverse sectors, such as desalination and waste-to-energy projects. The competitive advantage lies in offering technologically superior, cost-effective, and environmentally responsible solutions.
Key Drivers of Turbine Market Growth
Technological advancements like the development of larger, more efficient turbines, along with improved materials and blade design are key drivers. Favorable government policies and subsidies promoting renewable energy adoption, particularly in developing nations, significantly boost market expansion. The increasing global energy demand and the growing need for a reliable energy supply further propel market growth.
Challenges in the Turbine Market Market
Regulatory hurdles in obtaining permits and approvals for projects can delay implementation. Supply chain disruptions, especially concerning raw materials and specialized components, impact production and delivery timelines. Intense competition among established players and emerging market entrants, coupled with the growing presence of substitute energy technologies, present significant challenges.
Emerging Opportunities in Turbine Market
Technological breakthroughs, such as advanced materials and artificial intelligence-powered predictive maintenance, offer considerable potential. Strategic partnerships between turbine manufacturers and energy companies, especially in offshore wind projects, are creating new opportunities. Market expansion into developing economies with high growth potential and untapped resources offers further avenues for growth.
Leading Players in the Turbine Market Sector
- Bharat Heavy Electricals Limited (BHEL)
- Dongfang Electric Corporation Limited
- Toshiba Corporation
- Doosan Heavy Industries & Construction Co Ltd
- Siemens AG
- Vestas Wind System A/S
- Mitsubishi Hitachi Power Systems Ltd (MHPS)
- General Electric Company
- Enercon GmbH
- Harbin Electric Company Limited
Key Milestones in Turbine Market Industry
- 2021: Launch of a new generation of high-efficiency wind turbines by Vestas.
- 2022: Acquisition of a smaller turbine manufacturer by Siemens.
- 2023: Successful completion of a large-scale offshore wind farm project.
Strategic Outlook for Turbine Market Market
The future of the turbine market looks promising, driven by several factors. Continued investments in renewable energy, technological advancements leading to increased efficiency and reduced costs, and the growing awareness of the need for sustainable energy solutions are poised to drive significant growth. Strategic collaborations and partnerships, alongside market expansion into emerging economies, offer lucrative opportunities for players in this dynamic sector.
Turbine Market Segmentation
-
1. Type
-
1.1. Wind Turbines
- 1.1.1. Onshore
- 1.1.2. Offshore
-
1.2. Steam Turbines
- 1.2.1. Combined Cycle
- 1.2.2. Steam Cycle
-
1.3. Gas Turbines
- 1.3.1. Open Cycle
-
1.4. Hydro Turbines
- 1.4.1. Reaction
- 1.4.2. Impulse
-
1.1. Wind Turbines
Turbine Market Segmentation By Geography
- 1. North America
- 2. Europe
- 3. Asia Pacific
- 4. South America
- 5. Middle East and Africa
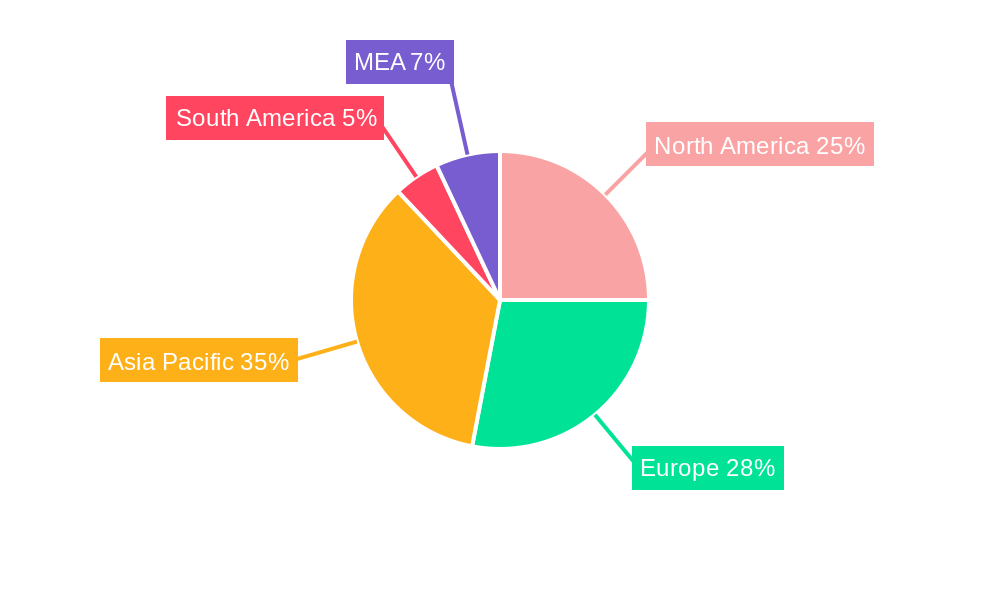
Turbine Market Regional Market Share
Geographic Coverage of Turbine Market
Turbine Market REPORT HIGHLIGHTS
| Aspects | Details |
|---|---|
| Study Period | 2020-2034 |
| Base Year | 2025 |
| Estimated Year | 2026 |
| Forecast Period | 2026-2034 |
| Historical Period | 2020-2025 |
| Growth Rate | CAGR of 6.7% from 2020-2034 |
| Segmentation |
|
Table of Contents
- 1. Introduction
- 1.1. Research Scope
- 1.2. Market Segmentation
- 1.3. Research Objective
- 1.4. Definitions and Assumptions
- 2. Executive Summary
- 2.1. Market Snapshot
- 3. Market Dynamics
- 3.1. Market Drivers
- 3.2. Market Restrains
- 3.3. Market Trends
- 3.4. Market Opportunities
- 4. Market Factor Analysis
- 4.1. Porters Five Forces
- 4.1.1. Bargaining Power of Suppliers
- 4.1.2. Bargaining Power of Buyers
- 4.1.3. Threat of New Entrants
- 4.1.4. Threat of Substitutes
- 4.1.5. Competitive Rivalry
- 4.2. PESTEL analysis
- 4.3. BCG Analysis
- 4.3.1. Stars (High Growth, High Market Share)
- 4.3.2. Cash Cows (Low Growth, High Market Share)
- 4.3.3. Question Mark (High Growth, Low Market Share)
- 4.3.4. Dogs (Low Growth, Low Market Share)
- 4.4. Ansoff Matrix Analysis
- 4.5. Supply Chain Analysis
- 4.6. Regulatory Landscape
- 4.7. Current Market Potential and Opportunity Assessment (TAM–SAM–SOM Framework)
- 4.8. MDP Analyst Note
- 4.1. Porters Five Forces
- 5. Market Analysis, Insights and Forecast 2021-2033
- 5.1. Market Analysis, Insights and Forecast - by Type
- 5.1.1. Wind Turbines
- 5.1.1.1. Onshore
- 5.1.1.2. Offshore
- 5.1.2. Steam Turbines
- 5.1.2.1. Combined Cycle
- 5.1.2.2. Steam Cycle
- 5.1.3. Gas Turbines
- 5.1.3.1. Open Cycle
- 5.1.4. Hydro Turbines
- 5.1.4.1. Reaction
- 5.1.4.2. Impulse
- 5.1.1. Wind Turbines
- 5.2. Market Analysis, Insights and Forecast - by Region
- 5.2.1. North America
- 5.2.2. Europe
- 5.2.3. Asia Pacific
- 5.2.4. South America
- 5.2.5. Middle East and Africa
- 5.1. Market Analysis, Insights and Forecast - by Type
- 6. Global Turbine Market Analysis, Insights and Forecast, 2021-2033
- 6.1. Market Analysis, Insights and Forecast - by Type
- 6.1.1. Wind Turbines
- 6.1.1.1. Onshore
- 6.1.1.2. Offshore
- 6.1.2. Steam Turbines
- 6.1.2.1. Combined Cycle
- 6.1.2.2. Steam Cycle
- 6.1.3. Gas Turbines
- 6.1.3.1. Open Cycle
- 6.1.4. Hydro Turbines
- 6.1.4.1. Reaction
- 6.1.4.2. Impulse
- 6.1.1. Wind Turbines
- 6.1. Market Analysis, Insights and Forecast - by Type
- 7. North America Turbine Market Analysis, Insights and Forecast, 2020-2032
- 7.1. Market Analysis, Insights and Forecast - by Type
- 7.1.1. Wind Turbines
- 7.1.1.1. Onshore
- 7.1.1.2. Offshore
- 7.1.2. Steam Turbines
- 7.1.2.1. Combined Cycle
- 7.1.2.2. Steam Cycle
- 7.1.3. Gas Turbines
- 7.1.3.1. Open Cycle
- 7.1.4. Hydro Turbines
- 7.1.4.1. Reaction
- 7.1.4.2. Impulse
- 7.1.1. Wind Turbines
- 7.1. Market Analysis, Insights and Forecast - by Type
- 8. Europe Turbine Market Analysis, Insights and Forecast, 2020-2032
- 8.1. Market Analysis, Insights and Forecast - by Type
- 8.1.1. Wind Turbines
- 8.1.1.1. Onshore
- 8.1.1.2. Offshore
- 8.1.2. Steam Turbines
- 8.1.2.1. Combined Cycle
- 8.1.2.2. Steam Cycle
- 8.1.3. Gas Turbines
- 8.1.3.1. Open Cycle
- 8.1.4. Hydro Turbines
- 8.1.4.1. Reaction
- 8.1.4.2. Impulse
- 8.1.1. Wind Turbines
- 8.1. Market Analysis, Insights and Forecast - by Type
- 9. Asia Pacific Turbine Market Analysis, Insights and Forecast, 2020-2032
- 9.1. Market Analysis, Insights and Forecast - by Type
- 9.1.1. Wind Turbines
- 9.1.1.1. Onshore
- 9.1.1.2. Offshore
- 9.1.2. Steam Turbines
- 9.1.2.1. Combined Cycle
- 9.1.2.2. Steam Cycle
- 9.1.3. Gas Turbines
- 9.1.3.1. Open Cycle
- 9.1.4. Hydro Turbines
- 9.1.4.1. Reaction
- 9.1.4.2. Impulse
- 9.1.1. Wind Turbines
- 9.1. Market Analysis, Insights and Forecast - by Type
- 10. South America Turbine Market Analysis, Insights and Forecast, 2020-2032
- 10.1. Market Analysis, Insights and Forecast - by Type
- 10.1.1. Wind Turbines
- 10.1.1.1. Onshore
- 10.1.1.2. Offshore
- 10.1.2. Steam Turbines
- 10.1.2.1. Combined Cycle
- 10.1.2.2. Steam Cycle
- 10.1.3. Gas Turbines
- 10.1.3.1. Open Cycle
- 10.1.4. Hydro Turbines
- 10.1.4.1. Reaction
- 10.1.4.2. Impulse
- 10.1.1. Wind Turbines
- 10.1. Market Analysis, Insights and Forecast - by Type
- 11. Middle East and Africa Turbine Market Analysis, Insights and Forecast, 2020-2032
- 11.1. Market Analysis, Insights and Forecast - by Type
- 11.1.1. Wind Turbines
- 11.1.1.1. Onshore
- 11.1.1.2. Offshore
- 11.1.2. Steam Turbines
- 11.1.2.1. Combined Cycle
- 11.1.2.2. Steam Cycle
- 11.1.3. Gas Turbines
- 11.1.3.1. Open Cycle
- 11.1.4. Hydro Turbines
- 11.1.4.1. Reaction
- 11.1.4.2. Impulse
- 11.1.1. Wind Turbines
- 11.1. Market Analysis, Insights and Forecast - by Type
- 12. Competitive Analysis
- 12.1. Company Profiles
- 12.1.1 Bharat Heavy Electricals Limited (BHEL)
- 12.1.1.1. Company Overview
- 12.1.1.2. Products
- 12.1.1.3. Company Financials
- 12.1.1.4. SWOT Analysis
- 12.1.2 Dongfang Electric Corporation Limited
- 12.1.2.1. Company Overview
- 12.1.2.2. Products
- 12.1.2.3. Company Financials
- 12.1.2.4. SWOT Analysis
- 12.1.3 Toshiba Corporation
- 12.1.3.1. Company Overview
- 12.1.3.2. Products
- 12.1.3.3. Company Financials
- 12.1.3.4. SWOT Analysis
- 12.1.4 Doosan Heavy Industries & Construction Co Ltd
- 12.1.4.1. Company Overview
- 12.1.4.2. Products
- 12.1.4.3. Company Financials
- 12.1.4.4. SWOT Analysis
- 12.1.5 Siemens AG
- 12.1.5.1. Company Overview
- 12.1.5.2. Products
- 12.1.5.3. Company Financials
- 12.1.5.4. SWOT Analysis
- 12.1.6 Vestas Wind System A/S*List Not Exhaustive
- 12.1.6.1. Company Overview
- 12.1.6.2. Products
- 12.1.6.3. Company Financials
- 12.1.6.4. SWOT Analysis
- 12.1.7 Mitsubishi Hitachi Power Systems Ltd (MHPS)
- 12.1.7.1. Company Overview
- 12.1.7.2. Products
- 12.1.7.3. Company Financials
- 12.1.7.4. SWOT Analysis
- 12.1.8 General Electric Company
- 12.1.8.1. Company Overview
- 12.1.8.2. Products
- 12.1.8.3. Company Financials
- 12.1.8.4. SWOT Analysis
- 12.1.9 Enercon GmbH
- 12.1.9.1. Company Overview
- 12.1.9.2. Products
- 12.1.9.3. Company Financials
- 12.1.9.4. SWOT Analysis
- 12.1.10 Harbin Electric Company Limited
- 12.1.10.1. Company Overview
- 12.1.10.2. Products
- 12.1.10.3. Company Financials
- 12.1.10.4. SWOT Analysis
- 12.1.1 Bharat Heavy Electricals Limited (BHEL)
- 12.2. Market Entropy
- 12.2.1 Company's Key Areas Served
- 12.2.2 Recent Developments
- 12.3. Company Market Share Analysis 2025
- 12.3.1 Top 5 Companies Market Share Analysis
- 12.3.2 Top 3 Companies Market Share Analysis
- 12.4. List of Potential Customers
- 13. Research Methodology
List of Figures
- Figure 1: Global Turbine Market Revenue Breakdown (billion, %) by Region 2025 & 2033
- Figure 2: Global Turbine Market Volume Breakdown (Megawatt, %) by Region 2025 & 2033
- Figure 3: North America Turbine Market Revenue (billion), by Type 2025 & 2033
- Figure 4: North America Turbine Market Volume (Megawatt), by Type 2025 & 2033
- Figure 5: North America Turbine Market Revenue Share (%), by Type 2025 & 2033
- Figure 6: North America Turbine Market Volume Share (%), by Type 2025 & 2033
- Figure 7: North America Turbine Market Revenue (billion), by Country 2025 & 2033
- Figure 8: North America Turbine Market Volume (Megawatt), by Country 2025 & 2033
- Figure 9: North America Turbine Market Revenue Share (%), by Country 2025 & 2033
- Figure 10: North America Turbine Market Volume Share (%), by Country 2025 & 2033
- Figure 11: Europe Turbine Market Revenue (billion), by Type 2025 & 2033
- Figure 12: Europe Turbine Market Volume (Megawatt), by Type 2025 & 2033
- Figure 13: Europe Turbine Market Revenue Share (%), by Type 2025 & 2033
- Figure 14: Europe Turbine Market Volume Share (%), by Type 2025 & 2033
- Figure 15: Europe Turbine Market Revenue (billion), by Country 2025 & 2033
- Figure 16: Europe Turbine Market Volume (Megawatt), by Country 2025 & 2033
- Figure 17: Europe Turbine Market Revenue Share (%), by Country 2025 & 2033
- Figure 18: Europe Turbine Market Volume Share (%), by Country 2025 & 2033
- Figure 19: Asia Pacific Turbine Market Revenue (billion), by Type 2025 & 2033
- Figure 20: Asia Pacific Turbine Market Volume (Megawatt), by Type 2025 & 2033
- Figure 21: Asia Pacific Turbine Market Revenue Share (%), by Type 2025 & 2033
- Figure 22: Asia Pacific Turbine Market Volume Share (%), by Type 2025 & 2033
- Figure 23: Asia Pacific Turbine Market Revenue (billion), by Country 2025 & 2033
- Figure 24: Asia Pacific Turbine Market Volume (Megawatt), by Country 2025 & 2033
- Figure 25: Asia Pacific Turbine Market Revenue Share (%), by Country 2025 & 2033
- Figure 26: Asia Pacific Turbine Market Volume Share (%), by Country 2025 & 2033
- Figure 27: South America Turbine Market Revenue (billion), by Type 2025 & 2033
- Figure 28: South America Turbine Market Volume (Megawatt), by Type 2025 & 2033
- Figure 29: South America Turbine Market Revenue Share (%), by Type 2025 & 2033
- Figure 30: South America Turbine Market Volume Share (%), by Type 2025 & 2033
- Figure 31: South America Turbine Market Revenue (billion), by Country 2025 & 2033
- Figure 32: South America Turbine Market Volume (Megawatt), by Country 2025 & 2033
- Figure 33: South America Turbine Market Revenue Share (%), by Country 2025 & 2033
- Figure 34: South America Turbine Market Volume Share (%), by Country 2025 & 2033
- Figure 35: Middle East and Africa Turbine Market Revenue (billion), by Type 2025 & 2033
- Figure 36: Middle East and Africa Turbine Market Volume (Megawatt), by Type 2025 & 2033
- Figure 37: Middle East and Africa Turbine Market Revenue Share (%), by Type 2025 & 2033
- Figure 38: Middle East and Africa Turbine Market Volume Share (%), by Type 2025 & 2033
- Figure 39: Middle East and Africa Turbine Market Revenue (billion), by Country 2025 & 2033
- Figure 40: Middle East and Africa Turbine Market Volume (Megawatt), by Country 2025 & 2033
- Figure 41: Middle East and Africa Turbine Market Revenue Share (%), by Country 2025 & 2033
- Figure 42: Middle East and Africa Turbine Market Volume Share (%), by Country 2025 & 2033
List of Tables
- Table 1: Global Turbine Market Revenue billion Forecast, by Type 2020 & 2033
- Table 2: Global Turbine Market Volume Megawatt Forecast, by Type 2020 & 2033
- Table 3: Global Turbine Market Revenue billion Forecast, by Region 2020 & 2033
- Table 4: Global Turbine Market Volume Megawatt Forecast, by Region 2020 & 2033
- Table 5: Global Turbine Market Revenue billion Forecast, by Type 2020 & 2033
- Table 6: Global Turbine Market Volume Megawatt Forecast, by Type 2020 & 2033
- Table 7: Global Turbine Market Revenue billion Forecast, by Country 2020 & 2033
- Table 8: Global Turbine Market Volume Megawatt Forecast, by Country 2020 & 2033
- Table 9: Global Turbine Market Revenue billion Forecast, by Type 2020 & 2033
- Table 10: Global Turbine Market Volume Megawatt Forecast, by Type 2020 & 2033
- Table 11: Global Turbine Market Revenue billion Forecast, by Country 2020 & 2033
- Table 12: Global Turbine Market Volume Megawatt Forecast, by Country 2020 & 2033
- Table 13: Global Turbine Market Revenue billion Forecast, by Type 2020 & 2033
- Table 14: Global Turbine Market Volume Megawatt Forecast, by Type 2020 & 2033
- Table 15: Global Turbine Market Revenue billion Forecast, by Country 2020 & 2033
- Table 16: Global Turbine Market Volume Megawatt Forecast, by Country 2020 & 2033
- Table 17: Global Turbine Market Revenue billion Forecast, by Type 2020 & 2033
- Table 18: Global Turbine Market Volume Megawatt Forecast, by Type 2020 & 2033
- Table 19: Global Turbine Market Revenue billion Forecast, by Country 2020 & 2033
- Table 20: Global Turbine Market Volume Megawatt Forecast, by Country 2020 & 2033
- Table 21: Global Turbine Market Revenue billion Forecast, by Type 2020 & 2033
- Table 22: Global Turbine Market Volume Megawatt Forecast, by Type 2020 & 2033
- Table 23: Global Turbine Market Revenue billion Forecast, by Country 2020 & 2033
- Table 24: Global Turbine Market Volume Megawatt Forecast, by Country 2020 & 2033
Frequently Asked Questions
1. What is the projected Compound Annual Growth Rate (CAGR) of the Turbine Market?
The projected CAGR is approximately 6.7%.
2. Which companies are prominent players in the Turbine Market?
Key companies in the market include Bharat Heavy Electricals Limited (BHEL), Dongfang Electric Corporation Limited, Toshiba Corporation, Doosan Heavy Industries & Construction Co Ltd, Siemens AG, Vestas Wind System A/S*List Not Exhaustive, Mitsubishi Hitachi Power Systems Ltd (MHPS), General Electric Company, Enercon GmbH, Harbin Electric Company Limited.
3. What are the main segments of the Turbine Market?
The market segments include Type.
4. Can you provide details about the market size?
The market size is estimated to be USD 185 billion as of 2022.
5. What are some drivers contributing to market growth?
Declining Costs of Solar Technologies4.; Demand for Decentralized Solar Energy Systems.
6. What are the notable trends driving market growth?
Wind Turbine Segment to Grow at the Fastest Rate.
7. Are there any restraints impacting market growth?
Absence of Any New Initiatives in the Country.
8. Can you provide examples of recent developments in the market?
N/A
9. What pricing options are available for accessing the report?
Pricing options include single-user, multi-user, and enterprise licenses priced at USD 4750, USD 5250, and USD 8750 respectively.
10. Is the market size provided in terms of value or volume?
The market size is provided in terms of value, measured in billion and volume, measured in Megawatt.
11. Are there any specific market keywords associated with the report?
Yes, the market keyword associated with the report is "Turbine Market," which aids in identifying and referencing the specific market segment covered.
12. How do I determine which pricing option suits my needs best?
The pricing options vary based on user requirements and access needs. Individual users may opt for single-user licenses, while businesses requiring broader access may choose multi-user or enterprise licenses for cost-effective access to the report.
13. Are there any additional resources or data provided in the Turbine Market report?
While the report offers comprehensive insights, it's advisable to review the specific contents or supplementary materials provided to ascertain if additional resources or data are available.
14. How can I stay updated on further developments or reports in the Turbine Market?
To stay informed about further developments, trends, and reports in the Turbine Market, consider subscribing to industry newsletters, following relevant companies and organizations, or regularly checking reputable industry news sources and publications.
Methodology
Step 1 - Identification of Relevant Samples Size from Population Database


Step 2 - Approaches for Defining Global Market Size (Value, Volume* & Price*)

Note*: In applicable scenarios
Step 3 - Data Sources
Primary Research
- Web Analytics
- Survey Reports
- Research Institute
- Latest Research Reports
- Opinion Leaders
Secondary Research
- Annual Reports
- White Paper
- Latest Press Release
- Industry Association
- Paid Database
- Investor Presentations

Step 4 - Data Triangulation
Involves using different sources of information in order to increase the validity of a study
These sources are likely to be stakeholders in a program - participants, other researchers, program staff, other community members, and so on.
Then we put all data in single framework & apply various statistical tools to find out the dynamic on the market.
During the analysis stage, feedback from the stakeholder groups would be compared to determine areas of agreement as well as areas of divergence