

Key Insights
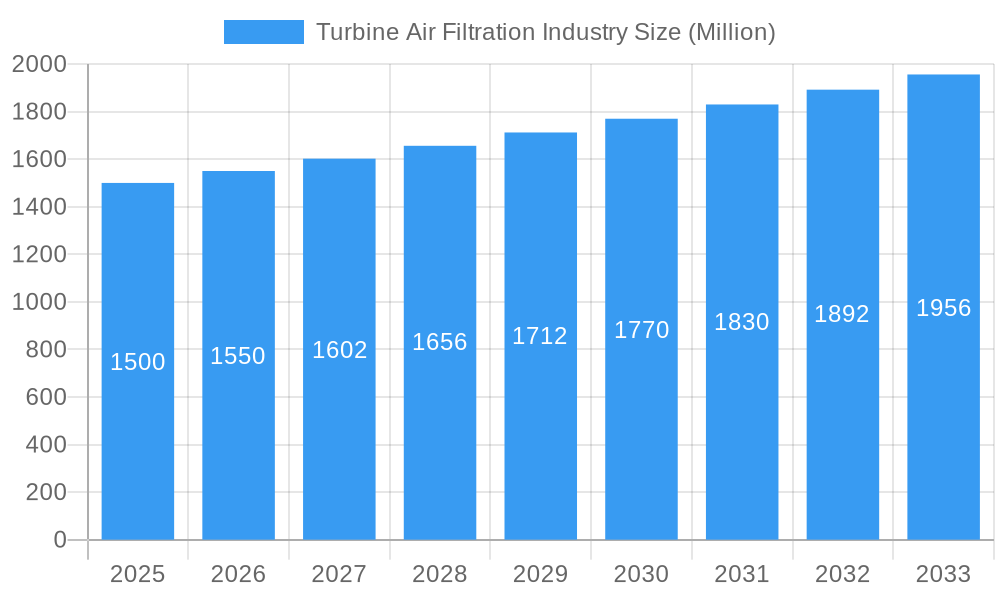
The global turbine air filtration market, valued at approximately $2.09 billion in 2025, is projected to experience robust expansion, exhibiting a compound annual growth rate (CAGR) of 3.73% from 2025 to 2033. Key growth drivers include escalating demand for power generation, particularly from renewable sources like wind and solar, and the enforcement of stringent environmental regulations for cleaner emissions from industrial facilities and power plants. Advancements in filtration technology, offering enhanced efficiency and durability, are also significantly contributing to market growth. The oil and gas sector, a major consumer of turbine air filtration systems, is anticipated to further fuel market expansion due to ongoing exploration and production activities. Market segmentation includes application (power generation, oil and gas, others), face velocity (low, medium, high), and geographical region.
Turbine Air Filtration Industry Market Size (In Billion)
Market growth may encounter challenges such as fluctuating raw material costs, economic downturns impacting industrial investments, and potential technological disruptions. Nevertheless, the long-term outlook remains optimistic, supported by consistent demand for reliable and efficient air filtration solutions across diverse industries. The competitive landscape is dynamic, featuring established global players and specialized niche providers. Geographic expansion, particularly in emerging economies with accelerating industrialization, presents substantial opportunities. While North America and Europe currently lead market share, the Asia-Pacific region is anticipated to witness significant growth driven by rapid industrial development in China and India. Future technological innovations will likely focus on sustainable and energy-efficient air filtration solutions.
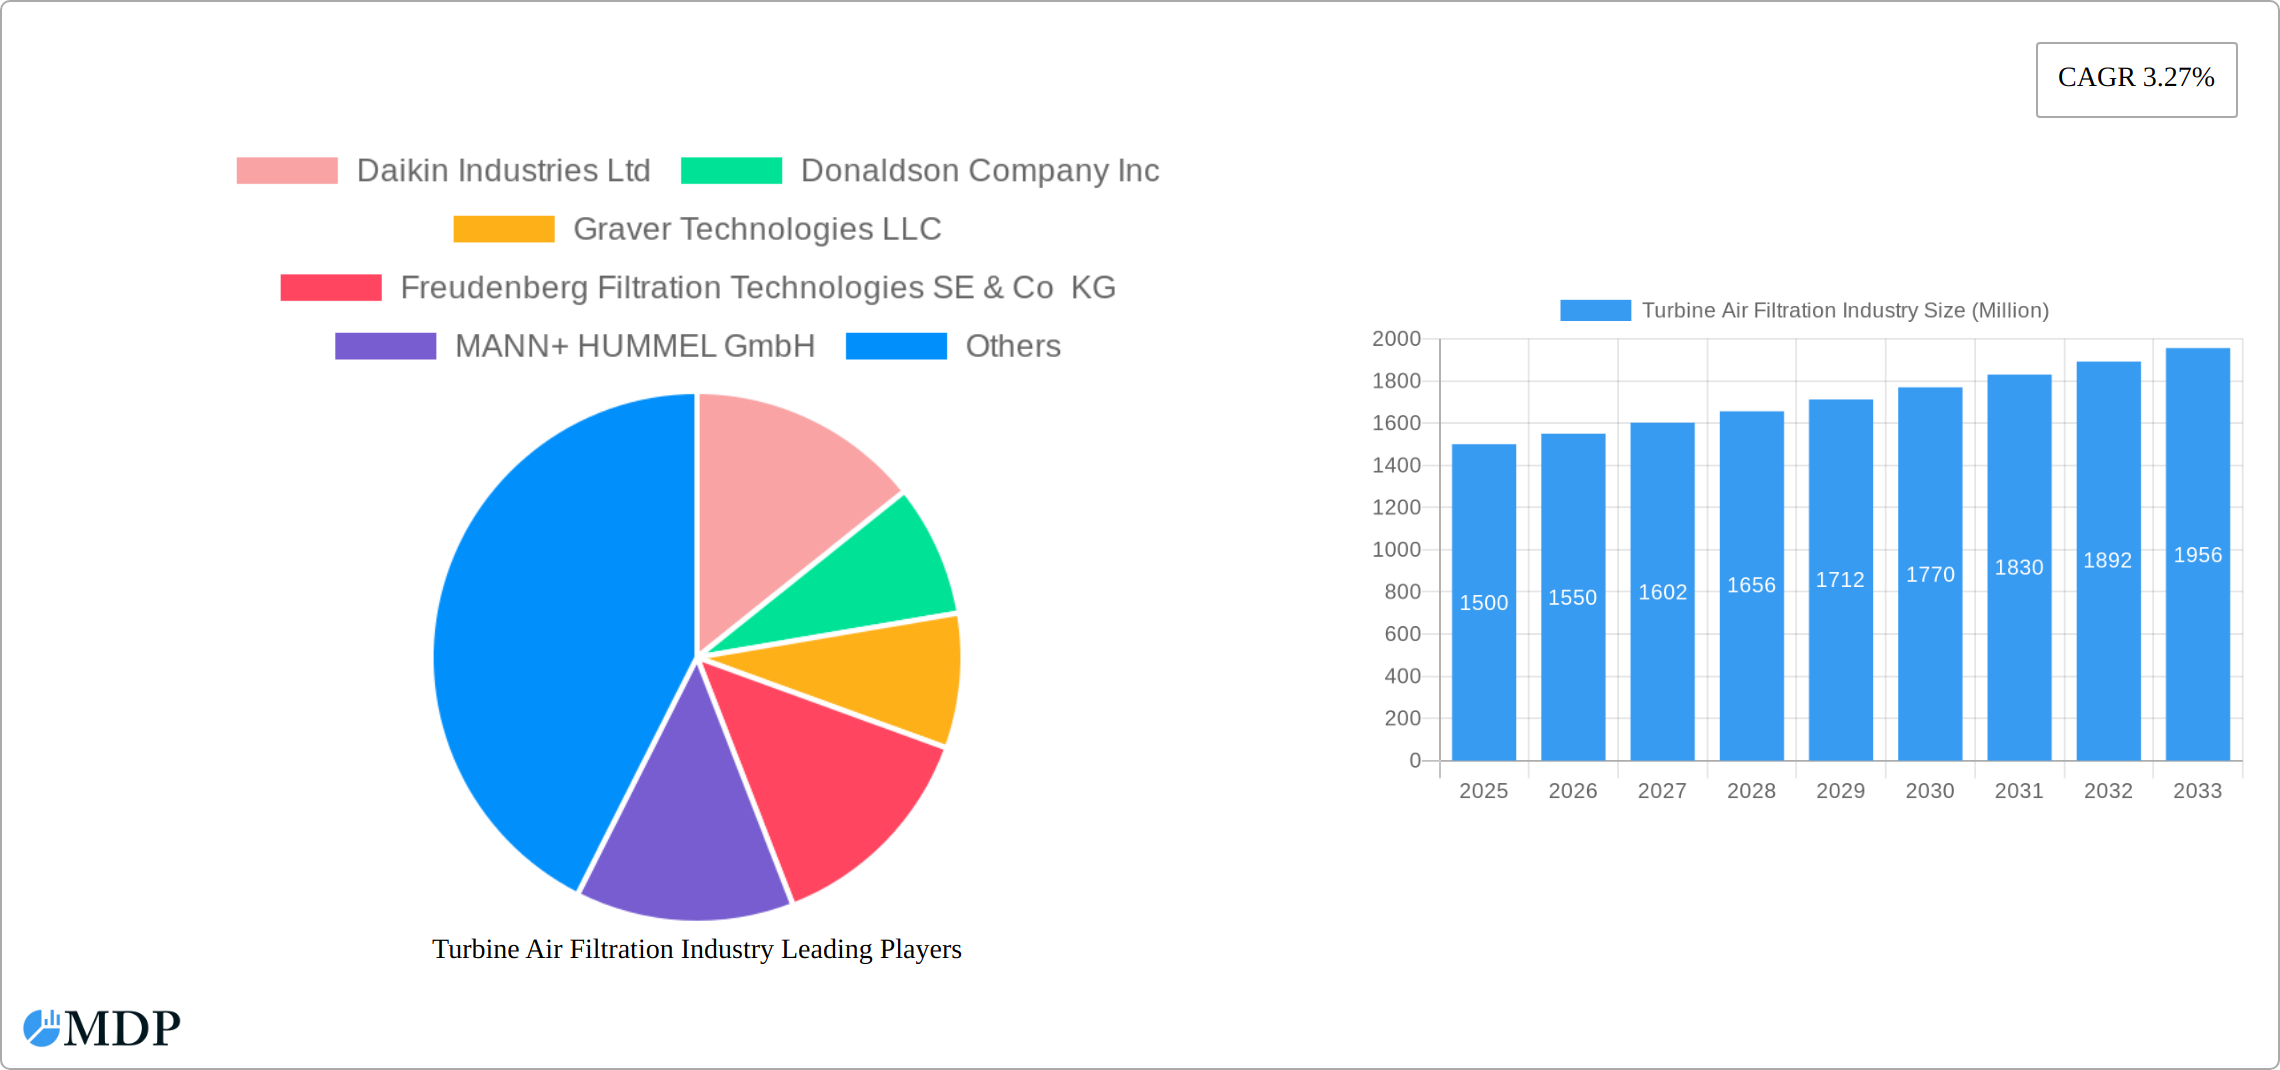
Turbine Air Filtration Industry Company Market Share
Turbine Air Filtration Industry Market Report: 2019-2033
This comprehensive report provides an in-depth analysis of the global turbine air filtration industry, offering invaluable insights for stakeholders across the value chain. Covering the period from 2019 to 2033, with a focus on 2025, this report analyzes market dynamics, leading players, technological advancements, and future growth prospects. The study includes detailed segmentation by application (Power Generation, Oil & Gas, Others) and face velocity (Low, Medium, High), providing a granular understanding of market trends and opportunities. Expect detailed analysis of over $xx Million market.
Turbine Air Filtration Industry Market Dynamics & Concentration
The global turbine air filtration market, valued at $xx Million in 2025, is characterized by a moderately concentrated landscape. Key players, including Daikin Industries Ltd, Donaldson Company Inc, Graver Technologies LLC, Freudenberg Filtration Technologies SE & Co KG, MANN+ HUMMEL GmbH, Koch Filter Corporation, Camfil AB, Advanced Filtration Concepts, W L Gore & Associates Inc, Parker Hannifin Corporation, and Nordic Air Filtration A/S, hold significant market share. However, the presence of several smaller, specialized players also contributes to competitive intensity.
Market concentration is influenced by factors such as economies of scale in manufacturing, technological innovation, and the ability to meet stringent regulatory requirements. Mergers and acquisitions (M&A) activity has played a role in shaping the market landscape, with approximately xx M&A deals recorded between 2019 and 2024. These deals have primarily focused on expanding product portfolios, accessing new markets, and strengthening technological capabilities.
- Market Share: The top 5 players collectively hold approximately xx% of the market share in 2025.
- Innovation Drivers: Stringent emission regulations, advancements in filtration technology (e.g., nanofiber filters), and the increasing demand for high-efficiency filtration systems drive innovation.
- Regulatory Frameworks: Stringent environmental regulations in various regions, particularly regarding emissions from power generation and industrial processes, significantly impact market growth.
- Product Substitutes: While limited, alternative technologies like electrostatic precipitators and other filtration methods present some level of substitution.
- End-User Trends: The increasing adoption of gas turbines in power generation and industrial applications, along with growing awareness of air quality, fuels market growth.
Turbine Air Filtration Industry Industry Trends & Analysis
The turbine air filtration market is experiencing robust growth, with a projected CAGR of xx% from 2025 to 2033. This growth is primarily driven by increasing demand from the power generation and oil & gas sectors, coupled with technological advancements leading to higher efficiency and longer filter lifespan. The market penetration of advanced filtration technologies, such as high-efficiency particulate air (HEPA) filters and ultra-low penetration air (ULPA) filters, is steadily increasing, driven by stringent emission regulations and the need for cleaner air. However, competitive dynamics are intense, with established players focusing on innovation and strategic partnerships to maintain market share. Consumer preferences are shifting towards sustainable and environmentally friendly filtration solutions, pushing manufacturers to develop eco-friendly products.
Leading Markets & Segments in Turbine Air Filtration Industry
The turbine air filtration industry is experiencing robust growth, fueled by several key factors. The power generation sector remains the dominant application, driven by the ever-increasing global demand for electricity and stringent emission regulations worldwide. This necessitates efficient and reliable air filtration systems in power plants, particularly those utilizing gas turbines. North America and Europe continue to hold significant market share due to their established power generation infrastructure and robust environmental standards. Analyzing face velocity, the medium velocity segment commands the largest market share, owing to its versatility and cost-effectiveness across a diverse range of turbine types and applications.
- Power Generation: Expanding power generation capacity globally, increasingly stringent emission norms (e.g., compliance with stricter SOx and NOx limits), and the rising adoption of gas turbines are key drivers in this segment. The transition towards cleaner energy sources further fuels the need for advanced filtration solutions.
- Oil & Gas: The demand for highly efficient filtration systems in both onshore and offshore oil and gas operations is substantial. Rising environmental concerns and a focus on minimizing operational downtime contribute significantly to the growth of this segment. The need for robust filtration in harsh environments drives innovation in filter media and system design.
- Industrial Applications: A diverse range of industrial processes, including manufacturing, chemical processing, and metals production, require high-efficiency air filtration to protect equipment and maintain product quality. This segment's growth is linked to overall industrial expansion and the adoption of advanced manufacturing techniques.
- Medium Velocity Filtration: This segment's dominance is a result of its optimal balance between cost-effectiveness and performance. Its suitability for various turbine types and sizes contributes to its widespread adoption across different industries.
Turbine Air Filtration Industry Product Developments
Recent product innovations focus on improving filter efficiency, extending lifespan, and reducing pressure drop. Manufacturers are incorporating advanced materials like nanofibers and incorporating smart sensors for real-time monitoring and predictive maintenance. This allows for optimized performance and reduced downtime. These developments cater to the growing demand for high-efficiency, low-maintenance filtration systems within various industries.
Key Drivers of Turbine Air Filtration Industry Growth
Several factors fuel market growth: stringent environmental regulations globally pushing for cleaner emissions, increasing demand for gas turbines in power generation and industrial settings, and continuous technological advancements in filtration technology leading to higher efficiency and lower operating costs. Government incentives for clean energy and industrial upgrades further accelerate market expansion.
Challenges in the Turbine Air Filtration Industry Market
Despite the significant growth potential, the turbine air filtration industry faces several challenges. Fluctuations in raw material prices, particularly for specialized filter media, directly impact production costs and profitability. Supply chain disruptions can lead to delays in delivery and impact project timelines. Furthermore, the industry is characterized by intense competition, with both established players and new entrants vying for market share. Meeting stringent regulatory compliance requirements, especially concerning environmental regulations and safety standards, adds complexity and cost, particularly for smaller companies. Finally, the need to continuously innovate and improve filter efficiency to meet evolving industry demands presents an ongoing challenge.
Emerging Opportunities in Turbine Air Filtration Industry
The industry is poised for considerable expansion, driven by several key opportunities. Advancements in nanotechnology are leading to the development of ultra-efficient filters with enhanced performance and longer lifespans. The increasing adoption of smart filtration systems, incorporating IoT capabilities, enables predictive maintenance and optimizes system performance, reducing downtime and maintenance costs. The expansion into emerging markets, particularly in rapidly industrializing regions of Asia and Africa, presents significant untapped potential. Strategic collaborations between filter manufacturers and turbine original equipment manufacturers (OEMs) facilitate the development of integrated and optimized filtration solutions, fostering growth and market penetration. Finally, a growing emphasis on sustainability is driving the demand for eco-friendly filter media and manufacturing processes.
Leading Players in the Turbine Air Filtration Industry Sector
- Daikin Industries Ltd
- Donaldson Company Inc
- Graver Technologies LLC
- Freudenberg Filtration Technologies SE & Co KG
- MANN+ HUMMEL GmbH
- Koch Filter Corporation
- Camfil AB
- Advanced Filtration Concepts
- W L Gore & Associates Inc
- Parker Hannifin Corporation
- Nordic Air Filtration A/S
Key Milestones in Turbine Air Filtration Industry Industry
- June 2021: Camfil Group announced the expansion of its research center, signifying investment in technological advancements.
- May 2021: Parker Hannifin launched ASSURE, a new line of filters, enhancing its product portfolio and competitiveness.
- March 2021: The Transco REAE project application signifies expansion opportunities within the gas pipeline infrastructure, impacting turbine air filtration demand.
Strategic Outlook for Turbine Air Filtration Industry Market
The turbine air filtration market exhibits strong growth prospects, driven by a confluence of factors. Technological advancements continue to enhance filter efficiency and longevity. The ongoing global industrialization fuels the demand for reliable filtration solutions across diverse sectors. A heightened focus on environmental sustainability necessitates the adoption of cleaner and more efficient filtration technologies. Companies seeking long-term success in this dynamic market should prioritize strategic partnerships, significant investments in research and development (R&D), and the adoption of sustainable manufacturing practices. Adaptability to evolving regulatory landscapes and a commitment to continuous innovation will be crucial for navigating the competitive landscape and capitalizing on the significant growth potential of this market.
Turbine Air Filtration Industry Segmentation
-
1. Application
- 1.1. Power Generation
- 1.2. Oil and Gas
- 1.3. Others
-
2. Face Velocity
- 2.1. Low Velocity
- 2.2. Medium Velocity
- 2.3. High Velocity
Turbine Air Filtration Industry Segmentation By Geography
- 1. North America
- 2. Europe
- 3. Asia Pacific
- 4. South America
- 5. Middle East and Africa
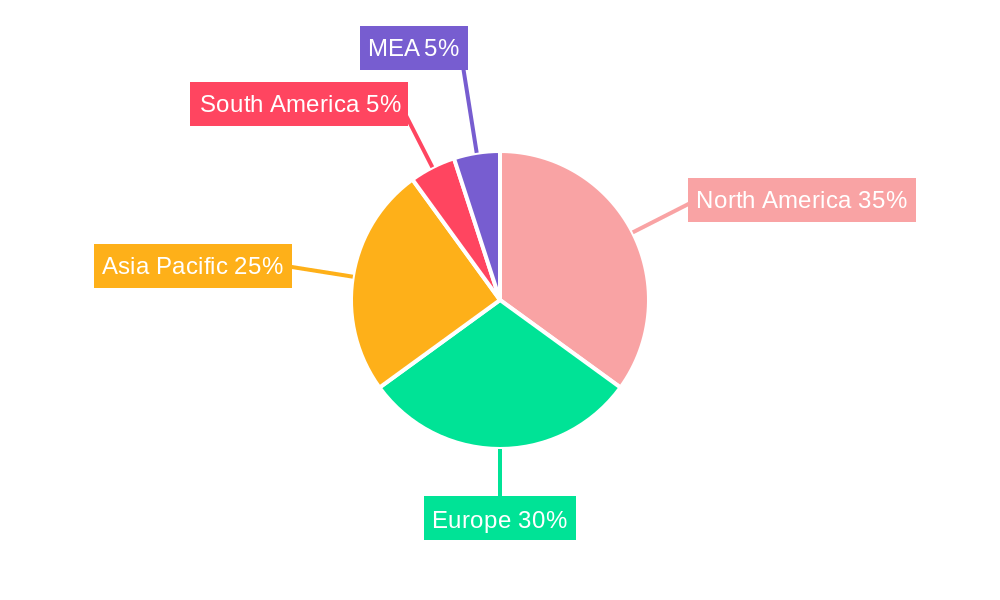
Turbine Air Filtration Industry Regional Market Share
Geographic Coverage of Turbine Air Filtration Industry
Turbine Air Filtration Industry REPORT HIGHLIGHTS
| Aspects | Details |
|---|---|
| Study Period | 2020-2034 |
| Base Year | 2025 |
| Estimated Year | 2026 |
| Forecast Period | 2026-2034 |
| Historical Period | 2020-2025 |
| Growth Rate | CAGR of 3.73% from 2020-2034 |
| Segmentation |
|
Table of Contents
- 1. Introduction
- 1.1. Research Scope
- 1.2. Market Segmentation
- 1.3. Research Objective
- 1.4. Definitions and Assumptions
- 2. Executive Summary
- 2.1. Market Snapshot
- 3. Market Dynamics
- 3.1. Market Drivers
- 3.2. Market Restrains
- 3.3. Market Trends
- 3.4. Market Opportunities
- 4. Market Factor Analysis
- 4.1. Porters Five Forces
- 4.1.1. Bargaining Power of Suppliers
- 4.1.2. Bargaining Power of Buyers
- 4.1.3. Threat of New Entrants
- 4.1.4. Threat of Substitutes
- 4.1.5. Competitive Rivalry
- 4.2. PESTEL analysis
- 4.3. BCG Analysis
- 4.3.1. Stars (High Growth, High Market Share)
- 4.3.2. Cash Cows (Low Growth, High Market Share)
- 4.3.3. Question Mark (High Growth, Low Market Share)
- 4.3.4. Dogs (Low Growth, Low Market Share)
- 4.4. Ansoff Matrix Analysis
- 4.5. Supply Chain Analysis
- 4.6. Regulatory Landscape
- 4.7. Current Market Potential and Opportunity Assessment (TAM–SAM–SOM Framework)
- 4.8. MDP Analyst Note
- 4.1. Porters Five Forces
- 5. Market Analysis, Insights and Forecast 2021-2033
- 5.1. Market Analysis, Insights and Forecast - by Application
- 5.1.1. Power Generation
- 5.1.2. Oil and Gas
- 5.1.3. Others
- 5.2. Market Analysis, Insights and Forecast - by Face Velocity
- 5.2.1. Low Velocity
- 5.2.2. Medium Velocity
- 5.2.3. High Velocity
- 5.3. Market Analysis, Insights and Forecast - by Region
- 5.3.1. North America
- 5.3.2. Europe
- 5.3.3. Asia Pacific
- 5.3.4. South America
- 5.3.5. Middle East and Africa
- 5.1. Market Analysis, Insights and Forecast - by Application
- 6. Global Turbine Air Filtration Industry Analysis, Insights and Forecast, 2021-2033
- 6.1. Market Analysis, Insights and Forecast - by Application
- 6.1.1. Power Generation
- 6.1.2. Oil and Gas
- 6.1.3. Others
- 6.2. Market Analysis, Insights and Forecast - by Face Velocity
- 6.2.1. Low Velocity
- 6.2.2. Medium Velocity
- 6.2.3. High Velocity
- 6.1. Market Analysis, Insights and Forecast - by Application
- 7. North America Turbine Air Filtration Industry Analysis, Insights and Forecast, 2020-2032
- 7.1. Market Analysis, Insights and Forecast - by Application
- 7.1.1. Power Generation
- 7.1.2. Oil and Gas
- 7.1.3. Others
- 7.2. Market Analysis, Insights and Forecast - by Face Velocity
- 7.2.1. Low Velocity
- 7.2.2. Medium Velocity
- 7.2.3. High Velocity
- 7.1. Market Analysis, Insights and Forecast - by Application
- 8. Europe Turbine Air Filtration Industry Analysis, Insights and Forecast, 2020-2032
- 8.1. Market Analysis, Insights and Forecast - by Application
- 8.1.1. Power Generation
- 8.1.2. Oil and Gas
- 8.1.3. Others
- 8.2. Market Analysis, Insights and Forecast - by Face Velocity
- 8.2.1. Low Velocity
- 8.2.2. Medium Velocity
- 8.2.3. High Velocity
- 8.1. Market Analysis, Insights and Forecast - by Application
- 9. Asia Pacific Turbine Air Filtration Industry Analysis, Insights and Forecast, 2020-2032
- 9.1. Market Analysis, Insights and Forecast - by Application
- 9.1.1. Power Generation
- 9.1.2. Oil and Gas
- 9.1.3. Others
- 9.2. Market Analysis, Insights and Forecast - by Face Velocity
- 9.2.1. Low Velocity
- 9.2.2. Medium Velocity
- 9.2.3. High Velocity
- 9.1. Market Analysis, Insights and Forecast - by Application
- 10. South America Turbine Air Filtration Industry Analysis, Insights and Forecast, 2020-2032
- 10.1. Market Analysis, Insights and Forecast - by Application
- 10.1.1. Power Generation
- 10.1.2. Oil and Gas
- 10.1.3. Others
- 10.2. Market Analysis, Insights and Forecast - by Face Velocity
- 10.2.1. Low Velocity
- 10.2.2. Medium Velocity
- 10.2.3. High Velocity
- 10.1. Market Analysis, Insights and Forecast - by Application
- 11. Middle East and Africa Turbine Air Filtration Industry Analysis, Insights and Forecast, 2020-2032
- 11.1. Market Analysis, Insights and Forecast - by Application
- 11.1.1. Power Generation
- 11.1.2. Oil and Gas
- 11.1.3. Others
- 11.2. Market Analysis, Insights and Forecast - by Face Velocity
- 11.2.1. Low Velocity
- 11.2.2. Medium Velocity
- 11.2.3. High Velocity
- 11.1. Market Analysis, Insights and Forecast - by Application
- 12. Competitive Analysis
- 12.1. Company Profiles
- 12.1.1 Daikin Industries Ltd
- 12.1.1.1. Company Overview
- 12.1.1.2. Products
- 12.1.1.3. Company Financials
- 12.1.1.4. SWOT Analysis
- 12.1.2 Donaldson Company Inc
- 12.1.2.1. Company Overview
- 12.1.2.2. Products
- 12.1.2.3. Company Financials
- 12.1.2.4. SWOT Analysis
- 12.1.3 Graver Technologies LLC
- 12.1.3.1. Company Overview
- 12.1.3.2. Products
- 12.1.3.3. Company Financials
- 12.1.3.4. SWOT Analysis
- 12.1.4 Freudenberg Filtration Technologies SE & Co KG
- 12.1.4.1. Company Overview
- 12.1.4.2. Products
- 12.1.4.3. Company Financials
- 12.1.4.4. SWOT Analysis
- 12.1.5 MANN+ HUMMEL GmbH
- 12.1.5.1. Company Overview
- 12.1.5.2. Products
- 12.1.5.3. Company Financials
- 12.1.5.4. SWOT Analysis
- 12.1.6 Koch Filter Corporation
- 12.1.6.1. Company Overview
- 12.1.6.2. Products
- 12.1.6.3. Company Financials
- 12.1.6.4. SWOT Analysis
- 12.1.7 Camfil AB
- 12.1.7.1. Company Overview
- 12.1.7.2. Products
- 12.1.7.3. Company Financials
- 12.1.7.4. SWOT Analysis
- 12.1.8 Advanced Filtration Concepts
- 12.1.8.1. Company Overview
- 12.1.8.2. Products
- 12.1.8.3. Company Financials
- 12.1.8.4. SWOT Analysis
- 12.1.9 W L Gore & Associates Inc *List Not Exhaustive
- 12.1.9.1. Company Overview
- 12.1.9.2. Products
- 12.1.9.3. Company Financials
- 12.1.9.4. SWOT Analysis
- 12.1.10 Parker Hannifin Corporation
- 12.1.10.1. Company Overview
- 12.1.10.2. Products
- 12.1.10.3. Company Financials
- 12.1.10.4. SWOT Analysis
- 12.1.11 Nordic Air Filtration A/S
- 12.1.11.1. Company Overview
- 12.1.11.2. Products
- 12.1.11.3. Company Financials
- 12.1.11.4. SWOT Analysis
- 12.1.1 Daikin Industries Ltd
- 12.2. Market Entropy
- 12.2.1 Company's Key Areas Served
- 12.2.2 Recent Developments
- 12.3. Company Market Share Analysis 2025
- 12.3.1 Top 5 Companies Market Share Analysis
- 12.3.2 Top 3 Companies Market Share Analysis
- 12.4. List of Potential Customers
- 13. Research Methodology
List of Figures
- Figure 1: Global Turbine Air Filtration Industry Revenue Breakdown (billion, %) by Region 2025 & 2033
- Figure 2: Global Turbine Air Filtration Industry Volume Breakdown (K Unit, %) by Region 2025 & 2033
- Figure 3: North America Turbine Air Filtration Industry Revenue (billion), by Application 2025 & 2033
- Figure 4: North America Turbine Air Filtration Industry Volume (K Unit), by Application 2025 & 2033
- Figure 5: North America Turbine Air Filtration Industry Revenue Share (%), by Application 2025 & 2033
- Figure 6: North America Turbine Air Filtration Industry Volume Share (%), by Application 2025 & 2033
- Figure 7: North America Turbine Air Filtration Industry Revenue (billion), by Face Velocity 2025 & 2033
- Figure 8: North America Turbine Air Filtration Industry Volume (K Unit), by Face Velocity 2025 & 2033
- Figure 9: North America Turbine Air Filtration Industry Revenue Share (%), by Face Velocity 2025 & 2033
- Figure 10: North America Turbine Air Filtration Industry Volume Share (%), by Face Velocity 2025 & 2033
- Figure 11: North America Turbine Air Filtration Industry Revenue (billion), by Country 2025 & 2033
- Figure 12: North America Turbine Air Filtration Industry Volume (K Unit), by Country 2025 & 2033
- Figure 13: North America Turbine Air Filtration Industry Revenue Share (%), by Country 2025 & 2033
- Figure 14: North America Turbine Air Filtration Industry Volume Share (%), by Country 2025 & 2033
- Figure 15: Europe Turbine Air Filtration Industry Revenue (billion), by Application 2025 & 2033
- Figure 16: Europe Turbine Air Filtration Industry Volume (K Unit), by Application 2025 & 2033
- Figure 17: Europe Turbine Air Filtration Industry Revenue Share (%), by Application 2025 & 2033
- Figure 18: Europe Turbine Air Filtration Industry Volume Share (%), by Application 2025 & 2033
- Figure 19: Europe Turbine Air Filtration Industry Revenue (billion), by Face Velocity 2025 & 2033
- Figure 20: Europe Turbine Air Filtration Industry Volume (K Unit), by Face Velocity 2025 & 2033
- Figure 21: Europe Turbine Air Filtration Industry Revenue Share (%), by Face Velocity 2025 & 2033
- Figure 22: Europe Turbine Air Filtration Industry Volume Share (%), by Face Velocity 2025 & 2033
- Figure 23: Europe Turbine Air Filtration Industry Revenue (billion), by Country 2025 & 2033
- Figure 24: Europe Turbine Air Filtration Industry Volume (K Unit), by Country 2025 & 2033
- Figure 25: Europe Turbine Air Filtration Industry Revenue Share (%), by Country 2025 & 2033
- Figure 26: Europe Turbine Air Filtration Industry Volume Share (%), by Country 2025 & 2033
- Figure 27: Asia Pacific Turbine Air Filtration Industry Revenue (billion), by Application 2025 & 2033
- Figure 28: Asia Pacific Turbine Air Filtration Industry Volume (K Unit), by Application 2025 & 2033
- Figure 29: Asia Pacific Turbine Air Filtration Industry Revenue Share (%), by Application 2025 & 2033
- Figure 30: Asia Pacific Turbine Air Filtration Industry Volume Share (%), by Application 2025 & 2033
- Figure 31: Asia Pacific Turbine Air Filtration Industry Revenue (billion), by Face Velocity 2025 & 2033
- Figure 32: Asia Pacific Turbine Air Filtration Industry Volume (K Unit), by Face Velocity 2025 & 2033
- Figure 33: Asia Pacific Turbine Air Filtration Industry Revenue Share (%), by Face Velocity 2025 & 2033
- Figure 34: Asia Pacific Turbine Air Filtration Industry Volume Share (%), by Face Velocity 2025 & 2033
- Figure 35: Asia Pacific Turbine Air Filtration Industry Revenue (billion), by Country 2025 & 2033
- Figure 36: Asia Pacific Turbine Air Filtration Industry Volume (K Unit), by Country 2025 & 2033
- Figure 37: Asia Pacific Turbine Air Filtration Industry Revenue Share (%), by Country 2025 & 2033
- Figure 38: Asia Pacific Turbine Air Filtration Industry Volume Share (%), by Country 2025 & 2033
- Figure 39: South America Turbine Air Filtration Industry Revenue (billion), by Application 2025 & 2033
- Figure 40: South America Turbine Air Filtration Industry Volume (K Unit), by Application 2025 & 2033
- Figure 41: South America Turbine Air Filtration Industry Revenue Share (%), by Application 2025 & 2033
- Figure 42: South America Turbine Air Filtration Industry Volume Share (%), by Application 2025 & 2033
- Figure 43: South America Turbine Air Filtration Industry Revenue (billion), by Face Velocity 2025 & 2033
- Figure 44: South America Turbine Air Filtration Industry Volume (K Unit), by Face Velocity 2025 & 2033
- Figure 45: South America Turbine Air Filtration Industry Revenue Share (%), by Face Velocity 2025 & 2033
- Figure 46: South America Turbine Air Filtration Industry Volume Share (%), by Face Velocity 2025 & 2033
- Figure 47: South America Turbine Air Filtration Industry Revenue (billion), by Country 2025 & 2033
- Figure 48: South America Turbine Air Filtration Industry Volume (K Unit), by Country 2025 & 2033
- Figure 49: South America Turbine Air Filtration Industry Revenue Share (%), by Country 2025 & 2033
- Figure 50: South America Turbine Air Filtration Industry Volume Share (%), by Country 2025 & 2033
- Figure 51: Middle East and Africa Turbine Air Filtration Industry Revenue (billion), by Application 2025 & 2033
- Figure 52: Middle East and Africa Turbine Air Filtration Industry Volume (K Unit), by Application 2025 & 2033
- Figure 53: Middle East and Africa Turbine Air Filtration Industry Revenue Share (%), by Application 2025 & 2033
- Figure 54: Middle East and Africa Turbine Air Filtration Industry Volume Share (%), by Application 2025 & 2033
- Figure 55: Middle East and Africa Turbine Air Filtration Industry Revenue (billion), by Face Velocity 2025 & 2033
- Figure 56: Middle East and Africa Turbine Air Filtration Industry Volume (K Unit), by Face Velocity 2025 & 2033
- Figure 57: Middle East and Africa Turbine Air Filtration Industry Revenue Share (%), by Face Velocity 2025 & 2033
- Figure 58: Middle East and Africa Turbine Air Filtration Industry Volume Share (%), by Face Velocity 2025 & 2033
- Figure 59: Middle East and Africa Turbine Air Filtration Industry Revenue (billion), by Country 2025 & 2033
- Figure 60: Middle East and Africa Turbine Air Filtration Industry Volume (K Unit), by Country 2025 & 2033
- Figure 61: Middle East and Africa Turbine Air Filtration Industry Revenue Share (%), by Country 2025 & 2033
- Figure 62: Middle East and Africa Turbine Air Filtration Industry Volume Share (%), by Country 2025 & 2033
List of Tables
- Table 1: Global Turbine Air Filtration Industry Revenue billion Forecast, by Application 2020 & 2033
- Table 2: Global Turbine Air Filtration Industry Volume K Unit Forecast, by Application 2020 & 2033
- Table 3: Global Turbine Air Filtration Industry Revenue billion Forecast, by Face Velocity 2020 & 2033
- Table 4: Global Turbine Air Filtration Industry Volume K Unit Forecast, by Face Velocity 2020 & 2033
- Table 5: Global Turbine Air Filtration Industry Revenue billion Forecast, by Region 2020 & 2033
- Table 6: Global Turbine Air Filtration Industry Volume K Unit Forecast, by Region 2020 & 2033
- Table 7: Global Turbine Air Filtration Industry Revenue billion Forecast, by Application 2020 & 2033
- Table 8: Global Turbine Air Filtration Industry Volume K Unit Forecast, by Application 2020 & 2033
- Table 9: Global Turbine Air Filtration Industry Revenue billion Forecast, by Face Velocity 2020 & 2033
- Table 10: Global Turbine Air Filtration Industry Volume K Unit Forecast, by Face Velocity 2020 & 2033
- Table 11: Global Turbine Air Filtration Industry Revenue billion Forecast, by Country 2020 & 2033
- Table 12: Global Turbine Air Filtration Industry Volume K Unit Forecast, by Country 2020 & 2033
- Table 13: Global Turbine Air Filtration Industry Revenue billion Forecast, by Application 2020 & 2033
- Table 14: Global Turbine Air Filtration Industry Volume K Unit Forecast, by Application 2020 & 2033
- Table 15: Global Turbine Air Filtration Industry Revenue billion Forecast, by Face Velocity 2020 & 2033
- Table 16: Global Turbine Air Filtration Industry Volume K Unit Forecast, by Face Velocity 2020 & 2033
- Table 17: Global Turbine Air Filtration Industry Revenue billion Forecast, by Country 2020 & 2033
- Table 18: Global Turbine Air Filtration Industry Volume K Unit Forecast, by Country 2020 & 2033
- Table 19: Global Turbine Air Filtration Industry Revenue billion Forecast, by Application 2020 & 2033
- Table 20: Global Turbine Air Filtration Industry Volume K Unit Forecast, by Application 2020 & 2033
- Table 21: Global Turbine Air Filtration Industry Revenue billion Forecast, by Face Velocity 2020 & 2033
- Table 22: Global Turbine Air Filtration Industry Volume K Unit Forecast, by Face Velocity 2020 & 2033
- Table 23: Global Turbine Air Filtration Industry Revenue billion Forecast, by Country 2020 & 2033
- Table 24: Global Turbine Air Filtration Industry Volume K Unit Forecast, by Country 2020 & 2033
- Table 25: Global Turbine Air Filtration Industry Revenue billion Forecast, by Application 2020 & 2033
- Table 26: Global Turbine Air Filtration Industry Volume K Unit Forecast, by Application 2020 & 2033
- Table 27: Global Turbine Air Filtration Industry Revenue billion Forecast, by Face Velocity 2020 & 2033
- Table 28: Global Turbine Air Filtration Industry Volume K Unit Forecast, by Face Velocity 2020 & 2033
- Table 29: Global Turbine Air Filtration Industry Revenue billion Forecast, by Country 2020 & 2033
- Table 30: Global Turbine Air Filtration Industry Volume K Unit Forecast, by Country 2020 & 2033
- Table 31: Global Turbine Air Filtration Industry Revenue billion Forecast, by Application 2020 & 2033
- Table 32: Global Turbine Air Filtration Industry Volume K Unit Forecast, by Application 2020 & 2033
- Table 33: Global Turbine Air Filtration Industry Revenue billion Forecast, by Face Velocity 2020 & 2033
- Table 34: Global Turbine Air Filtration Industry Volume K Unit Forecast, by Face Velocity 2020 & 2033
- Table 35: Global Turbine Air Filtration Industry Revenue billion Forecast, by Country 2020 & 2033
- Table 36: Global Turbine Air Filtration Industry Volume K Unit Forecast, by Country 2020 & 2033
Frequently Asked Questions
1. What is the projected Compound Annual Growth Rate (CAGR) of the Turbine Air Filtration Industry?
The projected CAGR is approximately 3.73%.
2. Which companies are prominent players in the Turbine Air Filtration Industry?
Key companies in the market include Daikin Industries Ltd, Donaldson Company Inc, Graver Technologies LLC, Freudenberg Filtration Technologies SE & Co KG, MANN+ HUMMEL GmbH, Koch Filter Corporation, Camfil AB, Advanced Filtration Concepts, W L Gore & Associates Inc *List Not Exhaustive, Parker Hannifin Corporation, Nordic Air Filtration A/S.
3. What are the main segments of the Turbine Air Filtration Industry?
The market segments include Application, Face Velocity.
4. Can you provide details about the market size?
The market size is estimated to be USD 2.09 billion as of 2022.
5. What are some drivers contributing to market growth?
4.; Increasing Number of Automobiles4.; The Government Policy Regarding Pollution Emission Control Parameters.
6. What are the notable trends driving market growth?
Power Generation Segment to Dominate the Market.
7. Are there any restraints impacting market growth?
4.; The Technological Limitations of Air Filters.
8. Can you provide examples of recent developments in the market?
In June 2021, Camfil Group announced the expansion of its state-of-the-art technical research center in Trosa, Sweden, which is expected to be completed by the end of 2021.
9. What pricing options are available for accessing the report?
Pricing options include single-user, multi-user, and enterprise licenses priced at USD 4750, USD 5250, and USD 8750 respectively.
10. Is the market size provided in terms of value or volume?
The market size is provided in terms of value, measured in billion and volume, measured in K Unit.
11. Are there any specific market keywords associated with the report?
Yes, the market keyword associated with the report is "Turbine Air Filtration Industry," which aids in identifying and referencing the specific market segment covered.
12. How do I determine which pricing option suits my needs best?
The pricing options vary based on user requirements and access needs. Individual users may opt for single-user licenses, while businesses requiring broader access may choose multi-user or enterprise licenses for cost-effective access to the report.
13. Are there any additional resources or data provided in the Turbine Air Filtration Industry report?
While the report offers comprehensive insights, it's advisable to review the specific contents or supplementary materials provided to ascertain if additional resources or data are available.
14. How can I stay updated on further developments or reports in the Turbine Air Filtration Industry?
To stay informed about further developments, trends, and reports in the Turbine Air Filtration Industry, consider subscribing to industry newsletters, following relevant companies and organizations, or regularly checking reputable industry news sources and publications.
Methodology
Step 1 - Identification of Relevant Samples Size from Population Database


Step 2 - Approaches for Defining Global Market Size (Value, Volume* & Price*)

Note*: In applicable scenarios
Step 3 - Data Sources
Primary Research
- Web Analytics
- Survey Reports
- Research Institute
- Latest Research Reports
- Opinion Leaders
Secondary Research
- Annual Reports
- White Paper
- Latest Press Release
- Industry Association
- Paid Database
- Investor Presentations

Step 4 - Data Triangulation
Involves using different sources of information in order to increase the validity of a study
These sources are likely to be stakeholders in a program - participants, other researchers, program staff, other community members, and so on.
Then we put all data in single framework & apply various statistical tools to find out the dynamic on the market.
During the analysis stage, feedback from the stakeholder groups would be compared to determine areas of agreement as well as areas of divergence