

Key Insights
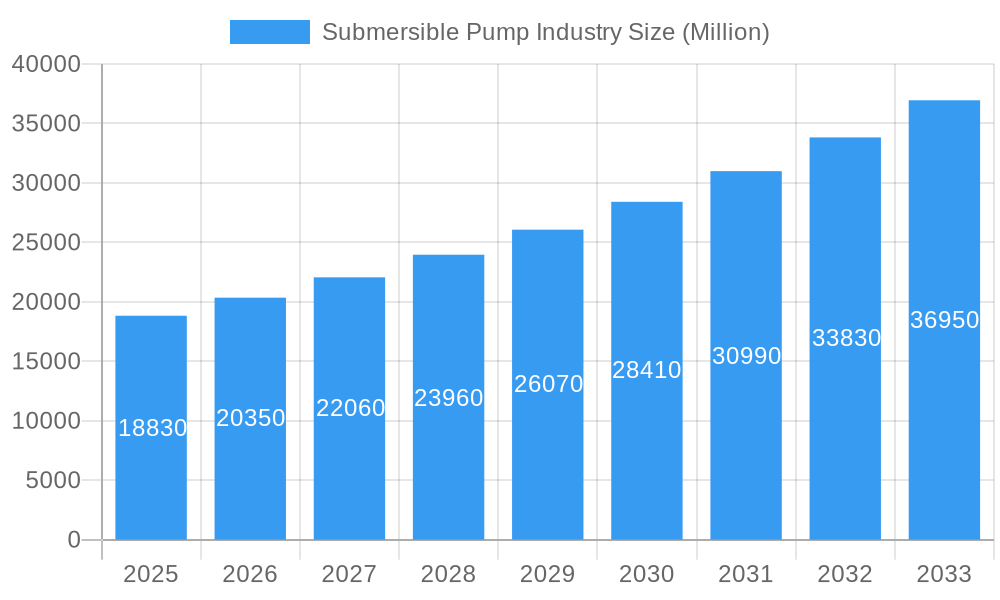
The global submersible pump market, valued at $18.83 billion in 2025, is projected to experience robust growth, exhibiting a compound annual growth rate (CAGR) of 8.20% from 2025 to 2033. This expansion is fueled by several key factors. The increasing demand for efficient water management solutions in various sectors, including water and wastewater treatment, agriculture, and oil and gas extraction, is a primary driver. Furthermore, the rising adoption of submersible pumps in industrial applications due to their reliability and cost-effectiveness contributes significantly to market growth. Technological advancements leading to the development of energy-efficient pumps, improved durability, and enhanced automation capabilities are further bolstering market expansion. Specific growth segments include borewell submersible pumps, driven by the need for groundwater extraction, and those with higher head capabilities (above 100m), catering to deep-well applications. Geographic expansion is also a significant contributor, with developing economies in Asia-Pacific and the Middle East and Africa witnessing substantial infrastructure development, thus increasing demand. However, factors such as fluctuating raw material prices and stringent environmental regulations could potentially pose challenges to market growth.
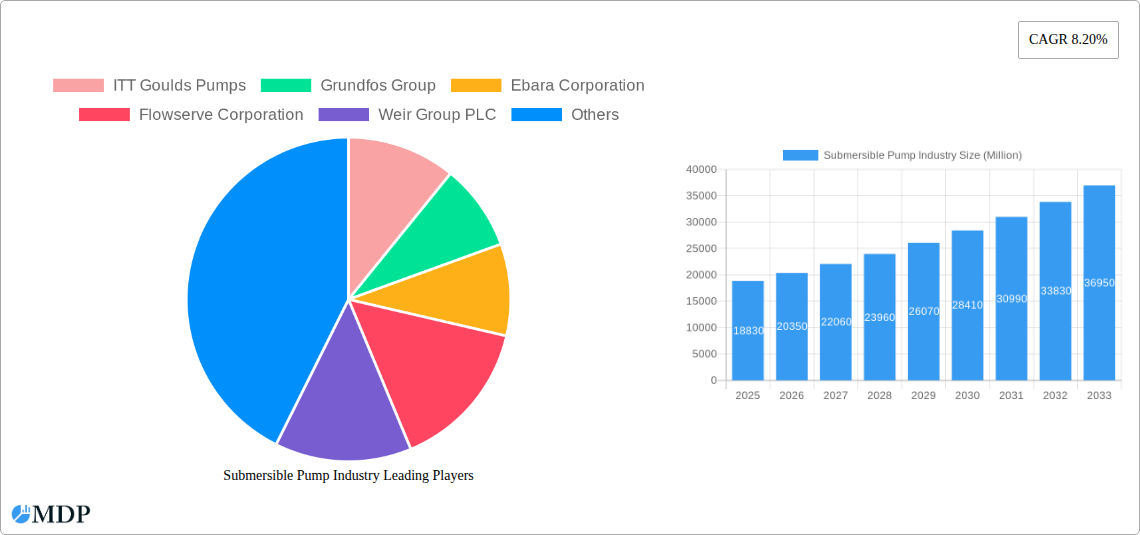
Submersible Pump Industry Market Size (In Billion)
The competitive landscape is characterized by the presence of both established multinational corporations and regional players. Key players like ITT Goulds Pumps, Grundfos, Ebara Corporation, and others, compete based on product innovation, technological advancements, and market reach. The market is segmented by type (borewell, openwell, non-clog), drive type (electric, hydraulic), head (below 50m, 50-100m, above 100m), and end-user industries. Analyzing these segments reveals distinct growth patterns and opportunities. For example, the electric drive segment dominates due to cost-effectiveness and readily available infrastructure, while the increasing demand for enhanced efficiency and precise control is driving growth in the hydraulic drive segment, albeit from a smaller base. The continued development of robust and reliable pumps tailored to specific industry needs will be crucial for companies seeking to capitalize on this expansive market.
Submersible Pump Industry Company Market Share
Submersible Pump Industry Report: 2019-2033 Forecast
This comprehensive report provides a detailed analysis of the global submersible pump industry, offering invaluable insights for stakeholders, investors, and industry professionals. With a forecast period spanning 2025-2033 and a base year of 2025, this report leverages data from 2019-2024 to paint a clear picture of current market dynamics and future trends. The market is projected to reach xx Million by 2033, exhibiting a CAGR of xx%.
Submersible Pump Industry Market Dynamics & Concentration
The global submersible pump market, valued at xx Million in 2024, is characterized by a moderately concentrated landscape. Key players like ITT Goulds Pumps, Grundfos Group, Ebara Corporation, Flowserve Corporation, and Weir Group PLC hold significant market share. However, the presence of numerous smaller players, particularly in niche segments, indicates potential for both consolidation and disruptive innovation. The market's concentration ratio (CR6) is estimated at xx%, signifying a balanced mix of established players and emerging competitors.
Market Concentration Factors:
- High capital expenditure requirements for manufacturing and R&D.
- Stringent regulatory compliance requirements, particularly in water and wastewater treatment.
- Increasing demand for energy-efficient pumps driving innovation and market consolidation.
- Strategic mergers and acquisitions (M&A) are reshaping the competitive landscape. Over the historical period (2019-2024), approximately xx M&A deals were recorded in the industry.
Submersible Pump Industry Industry Trends & Analysis
The submersible pump industry is experiencing robust growth driven by several factors. The expanding global population and increasing urbanization are fueling demand for efficient water management solutions. Simultaneously, the oil and gas, mining, and construction sectors are major consumers, driving demand for high-capacity, durable pumps capable of operating in harsh conditions. Technological advancements, particularly in motor efficiency and materials science, are improving pump performance, reliability, and energy efficiency. Consumer preferences are shifting toward sustainable, eco-friendly solutions. Competitive dynamics are intensified by technological disruption, with new entrants focusing on smart pumps and IoT integration.
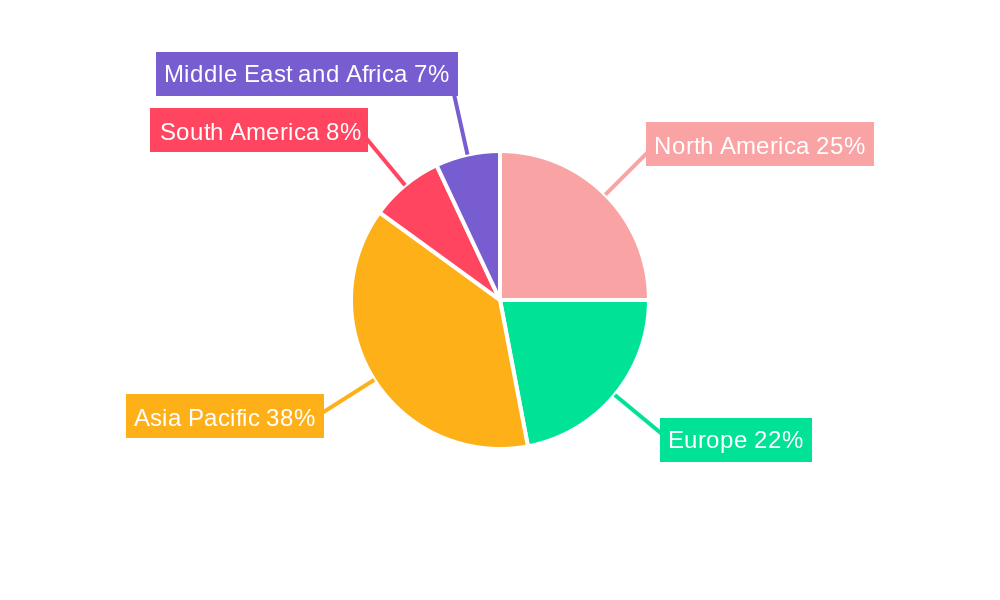
Leading Markets & Segments in Submersible Pump Industry
The Asia-Pacific region currently dominates the submersible pump market, driven by rapid infrastructure development and increasing industrialization. Within this region, China and India are particularly significant contributors.
Key Drivers by Segment:
- Type: Electric submersible pumps hold the largest market share due to their cost-effectiveness and versatility across various applications. The Borewell submersible pump segment is experiencing rapid growth, owing to increased demand for groundwater extraction in agricultural and domestic sectors.
- Drive Type: The electric drive type is predominant, owing to its reliability, cost-effectiveness, and ease of maintenance.
- Head: The "Below 50m" segment maintains the largest market share due to widespread usage in residential and agricultural applications.
- End User: The water and wastewater segment currently dominates the market, driven by large-scale infrastructure projects and growing concerns regarding water scarcity. The Oil and Gas industry is also a significant segment, demanding specialized pumps for high-pressure and corrosive environments.
Regional Dominance Analysis:
Asia-Pacific's dominance is attributed to strong economic growth, extensive infrastructure development projects, and a rapidly expanding industrial base. Government initiatives to improve water management and sanitation infrastructure further contribute to market growth in this region.
Submersible Pump Industry Product Developments
Recent innovations focus on enhancing energy efficiency, improving durability in harsh environments, and incorporating smart technologies for remote monitoring and control. The adoption of advanced materials like composite polymers and high-strength alloys increases pump lifespan and reduces maintenance needs. Furthermore, integration of sensors and IoT capabilities enables predictive maintenance, reducing downtime and optimizing operational efficiency. These developments cater to growing demand for reliable, cost-effective, and sustainable solutions across diverse applications.
Key Drivers of Submersible Pump Industry Growth
Several factors are driving the growth of the submersible pump industry. Firstly, increasing investments in water and wastewater infrastructure projects globally are creating significant demand. Secondly, the growth of the oil and gas and mining industries necessitates robust and reliable submersible pumps for extraction and processing applications. Lastly, technological advancements such as the development of more efficient motors and improved materials are increasing the overall efficiency and lifespan of these pumps.
Challenges in the Submersible Pump Industry Market
The submersible pump market faces several challenges. Stringent environmental regulations and increasing energy costs are putting pressure on manufacturers to develop more energy-efficient and sustainable products. Furthermore, supply chain disruptions caused by geopolitical instability and natural disasters can impact production and increase prices. Lastly, intense competition from both established players and new entrants necessitates continuous innovation and cost optimization strategies.
Emerging Opportunities in Submersible Pump Industry
The industry presents significant long-term growth opportunities, primarily driven by increasing demand for smart pumps integrated with IoT technologies. The expanding market for renewable energy sources, particularly solar and wind power, presents new avenues for submersible pump applications. Moreover, strategic partnerships and collaborations between pump manufacturers and technology providers can unlock new markets and accelerate innovation.
Leading Players in the Submersible Pump Industry Sector
- ITT Goulds Pumps
- Grundfos Group
- Ebara Corporation
- Flowserve Corporation
- Weir Group PLC
- Atlas Copco AB
- Baker Hughes Co
- Franklin Electric Co Inc
- Borets International Ltd
- Halliburton Co
- KSB AG
- The Gorman-Rupp Company
- Sulzer AG
- Schlumberger Limited
Key Milestones in Submersible Pump Industry Industry
- May 2023: Curtiss-Wright Corporation signed an agreement with Shell Plc to test, manufacture, and provide operational support for an electro-submersible pump for a Shell offshore platform in the Gulf of Mexico. This highlights the growing adoption of advanced technologies in the offshore oil and gas sector.
- February 2022: Industrial Flow Solutions acquired Dreno Pompe, an Italian manufacturer of submersible pumps for wastewater applications. This acquisition expands Industrial Flow Solutions' product portfolio and strengthens its presence in the European market.
Strategic Outlook for Submersible Pump Industry Market
The future of the submersible pump market is promising, driven by continuous technological advancements and growing demand across various sectors. Strategic investments in research and development, coupled with strategic partnerships and acquisitions, will be crucial for companies seeking to maintain their competitive edge. Focusing on energy efficiency, sustainability, and smart technologies will be key factors in shaping the future landscape of this industry, leading to a market valued at xx Million by 2033.
Submersible Pump Industry Segmentation
-
1. Type
- 1.1. Borewell Submersible Pump
- 1.2. Openwell Submersible Pump
- 1.3. Non-clog Submersible Pump
-
2. Drive Type
- 2.1. Electric
- 2.2. Hydraulic
- 2.3. Other Drive Types
-
3. Head
- 3.1. Below 50 m
- 3.2. Between 50 m to 100 m
- 3.3. Above 100 m
-
4. End User
- 4.1. Water and Wastewater
- 4.2. Oil and Gas Industry
- 4.3. Mining and Construction Industry
- 4.4. Other End Users
Submersible Pump Industry Segmentation By Geography
-
1. North America
- 1.1. United States
- 1.2. Canada
- 1.3. Rest of North America
-
2. Europe
- 2.1. Germany
- 2.2. France
- 2.3. United Kingdom
- 2.4. Spain
- 2.5. Nordic Countries
- 2.6. Turkey
- 2.7. Russia
- 2.8. Rest of Europe
-
3. Asia Pacific
- 3.1. China
- 3.2. India
- 3.3. Japan
- 3.4. South Korea
- 3.5. Malaysia
- 3.6. Thailand
- 3.7. Indonesia
- 3.8. Vietnam
- 3.9. Rest of Asia Pacific
-
4. South America
- 4.1. Brazil
- 4.2. Argentina
- 4.3. Colombia
- 4.4. Rest of South America
-
5. Middle East and Africa
- 5.1. Saudi Arabia
- 5.2. United Arab Emirates
- 5.3. South Africa
- 5.4. Nigeria
- 5.5. Qatar
- 5.6. Egypt
- 5.7. Rest of Middle East and Africa
Submersible Pump Industry Regional Market Share
Geographic Coverage of Submersible Pump Industry
Submersible Pump Industry REPORT HIGHLIGHTS
| Aspects | Details |
|---|---|
| Study Period | 2020-2034 |
| Base Year | 2025 |
| Estimated Year | 2026 |
| Forecast Period | 2026-2034 |
| Historical Period | 2020-2025 |
| Growth Rate | CAGR of 8.20% from 2020-2034 |
| Segmentation |
|
Table of Contents
- 1. Introduction
- 1.1. Research Scope
- 1.2. Market Segmentation
- 1.3. Research Objective
- 1.4. Definitions and Assumptions
- 2. Executive Summary
- 2.1. Market Snapshot
- 3. Market Dynamics
- 3.1. Market Drivers
- 3.2. Market Restrains
- 3.3. Market Trends
- 3.4. Market Opportunities
- 4. Market Factor Analysis
- 4.1. Porters Five Forces
- 4.1.1. Bargaining Power of Suppliers
- 4.1.2. Bargaining Power of Buyers
- 4.1.3. Threat of New Entrants
- 4.1.4. Threat of Substitutes
- 4.1.5. Competitive Rivalry
- 4.2. PESTEL analysis
- 4.3. BCG Analysis
- 4.3.1. Stars (High Growth, High Market Share)
- 4.3.2. Cash Cows (Low Growth, High Market Share)
- 4.3.3. Question Mark (High Growth, Low Market Share)
- 4.3.4. Dogs (Low Growth, Low Market Share)
- 4.4. Ansoff Matrix Analysis
- 4.5. Supply Chain Analysis
- 4.6. Regulatory Landscape
- 4.7. Current Market Potential and Opportunity Assessment (TAM–SAM–SOM Framework)
- 4.8. MDP Analyst Note
- 4.1. Porters Five Forces
- 5. Market Analysis, Insights and Forecast 2021-2033
- 5.1. Market Analysis, Insights and Forecast - by Type
- 5.1.1. Borewell Submersible Pump
- 5.1.2. Openwell Submersible Pump
- 5.1.3. Non-clog Submersible Pump
- 5.2. Market Analysis, Insights and Forecast - by Drive Type
- 5.2.1. Electric
- 5.2.2. Hydraulic
- 5.2.3. Other Drive Types
- 5.3. Market Analysis, Insights and Forecast - by Head
- 5.3.1. Below 50 m
- 5.3.2. Between 50 m to 100 m
- 5.3.3. Above 100 m
- 5.4. Market Analysis, Insights and Forecast - by End User
- 5.4.1. Water and Wastewater
- 5.4.2. Oil and Gas Industry
- 5.4.3. Mining and Construction Industry
- 5.4.4. Other End Users
- 5.5. Market Analysis, Insights and Forecast - by Region
- 5.5.1. North America
- 5.5.2. Europe
- 5.5.3. Asia Pacific
- 5.5.4. South America
- 5.5.5. Middle East and Africa
- 5.1. Market Analysis, Insights and Forecast - by Type
- 6. Global Submersible Pump Industry Analysis, Insights and Forecast, 2021-2033
- 6.1. Market Analysis, Insights and Forecast - by Type
- 6.1.1. Borewell Submersible Pump
- 6.1.2. Openwell Submersible Pump
- 6.1.3. Non-clog Submersible Pump
- 6.2. Market Analysis, Insights and Forecast - by Drive Type
- 6.2.1. Electric
- 6.2.2. Hydraulic
- 6.2.3. Other Drive Types
- 6.3. Market Analysis, Insights and Forecast - by Head
- 6.3.1. Below 50 m
- 6.3.2. Between 50 m to 100 m
- 6.3.3. Above 100 m
- 6.4. Market Analysis, Insights and Forecast - by End User
- 6.4.1. Water and Wastewater
- 6.4.2. Oil and Gas Industry
- 6.4.3. Mining and Construction Industry
- 6.4.4. Other End Users
- 6.1. Market Analysis, Insights and Forecast - by Type
- 7. North America Submersible Pump Industry Analysis, Insights and Forecast, 2020-2032
- 7.1. Market Analysis, Insights and Forecast - by Type
- 7.1.1. Borewell Submersible Pump
- 7.1.2. Openwell Submersible Pump
- 7.1.3. Non-clog Submersible Pump
- 7.2. Market Analysis, Insights and Forecast - by Drive Type
- 7.2.1. Electric
- 7.2.2. Hydraulic
- 7.2.3. Other Drive Types
- 7.3. Market Analysis, Insights and Forecast - by Head
- 7.3.1. Below 50 m
- 7.3.2. Between 50 m to 100 m
- 7.3.3. Above 100 m
- 7.4. Market Analysis, Insights and Forecast - by End User
- 7.4.1. Water and Wastewater
- 7.4.2. Oil and Gas Industry
- 7.4.3. Mining and Construction Industry
- 7.4.4. Other End Users
- 7.1. Market Analysis, Insights and Forecast - by Type
- 8. Europe Submersible Pump Industry Analysis, Insights and Forecast, 2020-2032
- 8.1. Market Analysis, Insights and Forecast - by Type
- 8.1.1. Borewell Submersible Pump
- 8.1.2. Openwell Submersible Pump
- 8.1.3. Non-clog Submersible Pump
- 8.2. Market Analysis, Insights and Forecast - by Drive Type
- 8.2.1. Electric
- 8.2.2. Hydraulic
- 8.2.3. Other Drive Types
- 8.3. Market Analysis, Insights and Forecast - by Head
- 8.3.1. Below 50 m
- 8.3.2. Between 50 m to 100 m
- 8.3.3. Above 100 m
- 8.4. Market Analysis, Insights and Forecast - by End User
- 8.4.1. Water and Wastewater
- 8.4.2. Oil and Gas Industry
- 8.4.3. Mining and Construction Industry
- 8.4.4. Other End Users
- 8.1. Market Analysis, Insights and Forecast - by Type
- 9. Asia Pacific Submersible Pump Industry Analysis, Insights and Forecast, 2020-2032
- 9.1. Market Analysis, Insights and Forecast - by Type
- 9.1.1. Borewell Submersible Pump
- 9.1.2. Openwell Submersible Pump
- 9.1.3. Non-clog Submersible Pump
- 9.2. Market Analysis, Insights and Forecast - by Drive Type
- 9.2.1. Electric
- 9.2.2. Hydraulic
- 9.2.3. Other Drive Types
- 9.3. Market Analysis, Insights and Forecast - by Head
- 9.3.1. Below 50 m
- 9.3.2. Between 50 m to 100 m
- 9.3.3. Above 100 m
- 9.4. Market Analysis, Insights and Forecast - by End User
- 9.4.1. Water and Wastewater
- 9.4.2. Oil and Gas Industry
- 9.4.3. Mining and Construction Industry
- 9.4.4. Other End Users
- 9.1. Market Analysis, Insights and Forecast - by Type
- 10. South America Submersible Pump Industry Analysis, Insights and Forecast, 2020-2032
- 10.1. Market Analysis, Insights and Forecast - by Type
- 10.1.1. Borewell Submersible Pump
- 10.1.2. Openwell Submersible Pump
- 10.1.3. Non-clog Submersible Pump
- 10.2. Market Analysis, Insights and Forecast - by Drive Type
- 10.2.1. Electric
- 10.2.2. Hydraulic
- 10.2.3. Other Drive Types
- 10.3. Market Analysis, Insights and Forecast - by Head
- 10.3.1. Below 50 m
- 10.3.2. Between 50 m to 100 m
- 10.3.3. Above 100 m
- 10.4. Market Analysis, Insights and Forecast - by End User
- 10.4.1. Water and Wastewater
- 10.4.2. Oil and Gas Industry
- 10.4.3. Mining and Construction Industry
- 10.4.4. Other End Users
- 10.1. Market Analysis, Insights and Forecast - by Type
- 11. Middle East and Africa Submersible Pump Industry Analysis, Insights and Forecast, 2020-2032
- 11.1. Market Analysis, Insights and Forecast - by Type
- 11.1.1. Borewell Submersible Pump
- 11.1.2. Openwell Submersible Pump
- 11.1.3. Non-clog Submersible Pump
- 11.2. Market Analysis, Insights and Forecast - by Drive Type
- 11.2.1. Electric
- 11.2.2. Hydraulic
- 11.2.3. Other Drive Types
- 11.3. Market Analysis, Insights and Forecast - by Head
- 11.3.1. Below 50 m
- 11.3.2. Between 50 m to 100 m
- 11.3.3. Above 100 m
- 11.4. Market Analysis, Insights and Forecast - by End User
- 11.4.1. Water and Wastewater
- 11.4.2. Oil and Gas Industry
- 11.4.3. Mining and Construction Industry
- 11.4.4. Other End Users
- 11.1. Market Analysis, Insights and Forecast - by Type
- 12. Competitive Analysis
- 12.1. Company Profiles
- 12.1.1 ITT Goulds Pumps
- 12.1.1.1. Company Overview
- 12.1.1.2. Products
- 12.1.1.3. Company Financials
- 12.1.1.4. SWOT Analysis
- 12.1.2 Grundfos Group
- 12.1.2.1. Company Overview
- 12.1.2.2. Products
- 12.1.2.3. Company Financials
- 12.1.2.4. SWOT Analysis
- 12.1.3 Ebara Corporation
- 12.1.3.1. Company Overview
- 12.1.3.2. Products
- 12.1.3.3. Company Financials
- 12.1.3.4. SWOT Analysis
- 12.1.4 Flowserve Corporation
- 12.1.4.1. Company Overview
- 12.1.4.2. Products
- 12.1.4.3. Company Financials
- 12.1.4.4. SWOT Analysis
- 12.1.5 Weir Group PLC
- 12.1.5.1. Company Overview
- 12.1.5.2. Products
- 12.1.5.3. Company Financials
- 12.1.5.4. SWOT Analysis
- 12.1.6 Atlas Copco AB
- 12.1.6.1. Company Overview
- 12.1.6.2. Products
- 12.1.6.3. Company Financials
- 12.1.6.4. SWOT Analysis
- 12.1.7 Baker Hughes Co
- 12.1.7.1. Company Overview
- 12.1.7.2. Products
- 12.1.7.3. Company Financials
- 12.1.7.4. SWOT Analysis
- 12.1.8 Franklin Electric Co Inc
- 12.1.8.1. Company Overview
- 12.1.8.2. Products
- 12.1.8.3. Company Financials
- 12.1.8.4. SWOT Analysis
- 12.1.9 Borets International Ltd
- 12.1.9.1. Company Overview
- 12.1.9.2. Products
- 12.1.9.3. Company Financials
- 12.1.9.4. SWOT Analysis
- 12.1.10 Halliburton Co
- 12.1.10.1. Company Overview
- 12.1.10.2. Products
- 12.1.10.3. Company Financials
- 12.1.10.4. SWOT Analysis
- 12.1.11 KSB AG*List Not Exhaustive 6 4 Market Ranking/Share Analysi
- 12.1.11.1. Company Overview
- 12.1.11.2. Products
- 12.1.11.3. Company Financials
- 12.1.11.4. SWOT Analysis
- 12.1.12 The Gorman-Rupp Company
- 12.1.12.1. Company Overview
- 12.1.12.2. Products
- 12.1.12.3. Company Financials
- 12.1.12.4. SWOT Analysis
- 12.1.13 Sulzer AG
- 12.1.13.1. Company Overview
- 12.1.13.2. Products
- 12.1.13.3. Company Financials
- 12.1.13.4. SWOT Analysis
- 12.1.14 Schlumberger Limited
- 12.1.14.1. Company Overview
- 12.1.14.2. Products
- 12.1.14.3. Company Financials
- 12.1.14.4. SWOT Analysis
- 12.1.1 ITT Goulds Pumps
- 12.2. Market Entropy
- 12.2.1 Company's Key Areas Served
- 12.2.2 Recent Developments
- 12.3. Company Market Share Analysis 2025
- 12.3.1 Top 5 Companies Market Share Analysis
- 12.3.2 Top 3 Companies Market Share Analysis
- 12.4. List of Potential Customers
- 13. Research Methodology
List of Figures
- Figure 1: Global Submersible Pump Industry Revenue Breakdown (Million, %) by Region 2025 & 2033
- Figure 2: North America Submersible Pump Industry Revenue (Million), by Type 2025 & 2033
- Figure 3: North America Submersible Pump Industry Revenue Share (%), by Type 2025 & 2033
- Figure 4: North America Submersible Pump Industry Revenue (Million), by Drive Type 2025 & 2033
- Figure 5: North America Submersible Pump Industry Revenue Share (%), by Drive Type 2025 & 2033
- Figure 6: North America Submersible Pump Industry Revenue (Million), by Head 2025 & 2033
- Figure 7: North America Submersible Pump Industry Revenue Share (%), by Head 2025 & 2033
- Figure 8: North America Submersible Pump Industry Revenue (Million), by End User 2025 & 2033
- Figure 9: North America Submersible Pump Industry Revenue Share (%), by End User 2025 & 2033
- Figure 10: North America Submersible Pump Industry Revenue (Million), by Country 2025 & 2033
- Figure 11: North America Submersible Pump Industry Revenue Share (%), by Country 2025 & 2033
- Figure 12: Europe Submersible Pump Industry Revenue (Million), by Type 2025 & 2033
- Figure 13: Europe Submersible Pump Industry Revenue Share (%), by Type 2025 & 2033
- Figure 14: Europe Submersible Pump Industry Revenue (Million), by Drive Type 2025 & 2033
- Figure 15: Europe Submersible Pump Industry Revenue Share (%), by Drive Type 2025 & 2033
- Figure 16: Europe Submersible Pump Industry Revenue (Million), by Head 2025 & 2033
- Figure 17: Europe Submersible Pump Industry Revenue Share (%), by Head 2025 & 2033
- Figure 18: Europe Submersible Pump Industry Revenue (Million), by End User 2025 & 2033
- Figure 19: Europe Submersible Pump Industry Revenue Share (%), by End User 2025 & 2033
- Figure 20: Europe Submersible Pump Industry Revenue (Million), by Country 2025 & 2033
- Figure 21: Europe Submersible Pump Industry Revenue Share (%), by Country 2025 & 2033
- Figure 22: Asia Pacific Submersible Pump Industry Revenue (Million), by Type 2025 & 2033
- Figure 23: Asia Pacific Submersible Pump Industry Revenue Share (%), by Type 2025 & 2033
- Figure 24: Asia Pacific Submersible Pump Industry Revenue (Million), by Drive Type 2025 & 2033
- Figure 25: Asia Pacific Submersible Pump Industry Revenue Share (%), by Drive Type 2025 & 2033
- Figure 26: Asia Pacific Submersible Pump Industry Revenue (Million), by Head 2025 & 2033
- Figure 27: Asia Pacific Submersible Pump Industry Revenue Share (%), by Head 2025 & 2033
- Figure 28: Asia Pacific Submersible Pump Industry Revenue (Million), by End User 2025 & 2033
- Figure 29: Asia Pacific Submersible Pump Industry Revenue Share (%), by End User 2025 & 2033
- Figure 30: Asia Pacific Submersible Pump Industry Revenue (Million), by Country 2025 & 2033
- Figure 31: Asia Pacific Submersible Pump Industry Revenue Share (%), by Country 2025 & 2033
- Figure 32: South America Submersible Pump Industry Revenue (Million), by Type 2025 & 2033
- Figure 33: South America Submersible Pump Industry Revenue Share (%), by Type 2025 & 2033
- Figure 34: South America Submersible Pump Industry Revenue (Million), by Drive Type 2025 & 2033
- Figure 35: South America Submersible Pump Industry Revenue Share (%), by Drive Type 2025 & 2033
- Figure 36: South America Submersible Pump Industry Revenue (Million), by Head 2025 & 2033
- Figure 37: South America Submersible Pump Industry Revenue Share (%), by Head 2025 & 2033
- Figure 38: South America Submersible Pump Industry Revenue (Million), by End User 2025 & 2033
- Figure 39: South America Submersible Pump Industry Revenue Share (%), by End User 2025 & 2033
- Figure 40: South America Submersible Pump Industry Revenue (Million), by Country 2025 & 2033
- Figure 41: South America Submersible Pump Industry Revenue Share (%), by Country 2025 & 2033
- Figure 42: Middle East and Africa Submersible Pump Industry Revenue (Million), by Type 2025 & 2033
- Figure 43: Middle East and Africa Submersible Pump Industry Revenue Share (%), by Type 2025 & 2033
- Figure 44: Middle East and Africa Submersible Pump Industry Revenue (Million), by Drive Type 2025 & 2033
- Figure 45: Middle East and Africa Submersible Pump Industry Revenue Share (%), by Drive Type 2025 & 2033
- Figure 46: Middle East and Africa Submersible Pump Industry Revenue (Million), by Head 2025 & 2033
- Figure 47: Middle East and Africa Submersible Pump Industry Revenue Share (%), by Head 2025 & 2033
- Figure 48: Middle East and Africa Submersible Pump Industry Revenue (Million), by End User 2025 & 2033
- Figure 49: Middle East and Africa Submersible Pump Industry Revenue Share (%), by End User 2025 & 2033
- Figure 50: Middle East and Africa Submersible Pump Industry Revenue (Million), by Country 2025 & 2033
- Figure 51: Middle East and Africa Submersible Pump Industry Revenue Share (%), by Country 2025 & 2033
List of Tables
- Table 1: Global Submersible Pump Industry Revenue Million Forecast, by Type 2020 & 2033
- Table 2: Global Submersible Pump Industry Revenue Million Forecast, by Drive Type 2020 & 2033
- Table 3: Global Submersible Pump Industry Revenue Million Forecast, by Head 2020 & 2033
- Table 4: Global Submersible Pump Industry Revenue Million Forecast, by End User 2020 & 2033
- Table 5: Global Submersible Pump Industry Revenue Million Forecast, by Region 2020 & 2033
- Table 6: Global Submersible Pump Industry Revenue Million Forecast, by Type 2020 & 2033
- Table 7: Global Submersible Pump Industry Revenue Million Forecast, by Drive Type 2020 & 2033
- Table 8: Global Submersible Pump Industry Revenue Million Forecast, by Head 2020 & 2033
- Table 9: Global Submersible Pump Industry Revenue Million Forecast, by End User 2020 & 2033
- Table 10: Global Submersible Pump Industry Revenue Million Forecast, by Country 2020 & 2033
- Table 11: United States Submersible Pump Industry Revenue (Million) Forecast, by Application 2020 & 2033
- Table 12: Canada Submersible Pump Industry Revenue (Million) Forecast, by Application 2020 & 2033
- Table 13: Rest of North America Submersible Pump Industry Revenue (Million) Forecast, by Application 2020 & 2033
- Table 14: Global Submersible Pump Industry Revenue Million Forecast, by Type 2020 & 2033
- Table 15: Global Submersible Pump Industry Revenue Million Forecast, by Drive Type 2020 & 2033
- Table 16: Global Submersible Pump Industry Revenue Million Forecast, by Head 2020 & 2033
- Table 17: Global Submersible Pump Industry Revenue Million Forecast, by End User 2020 & 2033
- Table 18: Global Submersible Pump Industry Revenue Million Forecast, by Country 2020 & 2033
- Table 19: Germany Submersible Pump Industry Revenue (Million) Forecast, by Application 2020 & 2033
- Table 20: France Submersible Pump Industry Revenue (Million) Forecast, by Application 2020 & 2033
- Table 21: United Kingdom Submersible Pump Industry Revenue (Million) Forecast, by Application 2020 & 2033
- Table 22: Spain Submersible Pump Industry Revenue (Million) Forecast, by Application 2020 & 2033
- Table 23: Nordic Countries Submersible Pump Industry Revenue (Million) Forecast, by Application 2020 & 2033
- Table 24: Turkey Submersible Pump Industry Revenue (Million) Forecast, by Application 2020 & 2033
- Table 25: Russia Submersible Pump Industry Revenue (Million) Forecast, by Application 2020 & 2033
- Table 26: Rest of Europe Submersible Pump Industry Revenue (Million) Forecast, by Application 2020 & 2033
- Table 27: Global Submersible Pump Industry Revenue Million Forecast, by Type 2020 & 2033
- Table 28: Global Submersible Pump Industry Revenue Million Forecast, by Drive Type 2020 & 2033
- Table 29: Global Submersible Pump Industry Revenue Million Forecast, by Head 2020 & 2033
- Table 30: Global Submersible Pump Industry Revenue Million Forecast, by End User 2020 & 2033
- Table 31: Global Submersible Pump Industry Revenue Million Forecast, by Country 2020 & 2033
- Table 32: China Submersible Pump Industry Revenue (Million) Forecast, by Application 2020 & 2033
- Table 33: India Submersible Pump Industry Revenue (Million) Forecast, by Application 2020 & 2033
- Table 34: Japan Submersible Pump Industry Revenue (Million) Forecast, by Application 2020 & 2033
- Table 35: South Korea Submersible Pump Industry Revenue (Million) Forecast, by Application 2020 & 2033
- Table 36: Malaysia Submersible Pump Industry Revenue (Million) Forecast, by Application 2020 & 2033
- Table 37: Thailand Submersible Pump Industry Revenue (Million) Forecast, by Application 2020 & 2033
- Table 38: Indonesia Submersible Pump Industry Revenue (Million) Forecast, by Application 2020 & 2033
- Table 39: Vietnam Submersible Pump Industry Revenue (Million) Forecast, by Application 2020 & 2033
- Table 40: Rest of Asia Pacific Submersible Pump Industry Revenue (Million) Forecast, by Application 2020 & 2033
- Table 41: Global Submersible Pump Industry Revenue Million Forecast, by Type 2020 & 2033
- Table 42: Global Submersible Pump Industry Revenue Million Forecast, by Drive Type 2020 & 2033
- Table 43: Global Submersible Pump Industry Revenue Million Forecast, by Head 2020 & 2033
- Table 44: Global Submersible Pump Industry Revenue Million Forecast, by End User 2020 & 2033
- Table 45: Global Submersible Pump Industry Revenue Million Forecast, by Country 2020 & 2033
- Table 46: Brazil Submersible Pump Industry Revenue (Million) Forecast, by Application 2020 & 2033
- Table 47: Argentina Submersible Pump Industry Revenue (Million) Forecast, by Application 2020 & 2033
- Table 48: Colombia Submersible Pump Industry Revenue (Million) Forecast, by Application 2020 & 2033
- Table 49: Rest of South America Submersible Pump Industry Revenue (Million) Forecast, by Application 2020 & 2033
- Table 50: Global Submersible Pump Industry Revenue Million Forecast, by Type 2020 & 2033
- Table 51: Global Submersible Pump Industry Revenue Million Forecast, by Drive Type 2020 & 2033
- Table 52: Global Submersible Pump Industry Revenue Million Forecast, by Head 2020 & 2033
- Table 53: Global Submersible Pump Industry Revenue Million Forecast, by End User 2020 & 2033
- Table 54: Global Submersible Pump Industry Revenue Million Forecast, by Country 2020 & 2033
- Table 55: Saudi Arabia Submersible Pump Industry Revenue (Million) Forecast, by Application 2020 & 2033
- Table 56: United Arab Emirates Submersible Pump Industry Revenue (Million) Forecast, by Application 2020 & 2033
- Table 57: South Africa Submersible Pump Industry Revenue (Million) Forecast, by Application 2020 & 2033
- Table 58: Nigeria Submersible Pump Industry Revenue (Million) Forecast, by Application 2020 & 2033
- Table 59: Qatar Submersible Pump Industry Revenue (Million) Forecast, by Application 2020 & 2033
- Table 60: Egypt Submersible Pump Industry Revenue (Million) Forecast, by Application 2020 & 2033
- Table 61: Rest of Middle East and Africa Submersible Pump Industry Revenue (Million) Forecast, by Application 2020 & 2033
Frequently Asked Questions
1. What is the projected Compound Annual Growth Rate (CAGR) of the Submersible Pump Industry?
The projected CAGR is approximately 8.20%.
2. Which companies are prominent players in the Submersible Pump Industry?
Key companies in the market include ITT Goulds Pumps, Grundfos Group, Ebara Corporation, Flowserve Corporation, Weir Group PLC, Atlas Copco AB, Baker Hughes Co, Franklin Electric Co Inc, Borets International Ltd, Halliburton Co, KSB AG*List Not Exhaustive 6 4 Market Ranking/Share Analysi, The Gorman-Rupp Company, Sulzer AG, Schlumberger Limited.
3. What are the main segments of the Submersible Pump Industry?
The market segments include Type, Drive Type, Head, End User.
4. Can you provide details about the market size?
The market size is estimated to be USD 18.83 Million as of 2022.
5. What are some drivers contributing to market growth?
4.; Rapid Recovery in the Oil and Gas and Mining Industries4.; Surge in the Construction Industry.
6. What are the notable trends driving market growth?
The Oil and Gas Industry is Expected to Dominate the Market.
7. Are there any restraints impacting market growth?
4.; High Maintenance and Operation Costs of Submersible Pump Restrain the Market.
8. Can you provide examples of recent developments in the market?
In May 2023, Curtiss-Wright Corporation announced to sign an agreement with Shell Plc to test, manufacture, and provide operational support for an electro-submersible pump for a for a Shell offshore platform in the Gulf of Mexico. The goal of this initiative is to Curtiss-Wright's canned motor technology as an effective and reliable alternative to current subsea pump technologies.
9. What pricing options are available for accessing the report?
Pricing options include single-user, multi-user, and enterprise licenses priced at USD 4750, USD 5250, and USD 8750 respectively.
10. Is the market size provided in terms of value or volume?
The market size is provided in terms of value, measured in Million.
11. Are there any specific market keywords associated with the report?
Yes, the market keyword associated with the report is "Submersible Pump Industry," which aids in identifying and referencing the specific market segment covered.
12. How do I determine which pricing option suits my needs best?
The pricing options vary based on user requirements and access needs. Individual users may opt for single-user licenses, while businesses requiring broader access may choose multi-user or enterprise licenses for cost-effective access to the report.
13. Are there any additional resources or data provided in the Submersible Pump Industry report?
While the report offers comprehensive insights, it's advisable to review the specific contents or supplementary materials provided to ascertain if additional resources or data are available.
14. How can I stay updated on further developments or reports in the Submersible Pump Industry?
To stay informed about further developments, trends, and reports in the Submersible Pump Industry, consider subscribing to industry newsletters, following relevant companies and organizations, or regularly checking reputable industry news sources and publications.
Methodology
Step 1 - Identification of Relevant Samples Size from Population Database


Step 2 - Approaches for Defining Global Market Size (Value, Volume* & Price*)

Note*: In applicable scenarios
Step 3 - Data Sources
Primary Research
- Web Analytics
- Survey Reports
- Research Institute
- Latest Research Reports
- Opinion Leaders
Secondary Research
- Annual Reports
- White Paper
- Latest Press Release
- Industry Association
- Paid Database
- Investor Presentations

Step 4 - Data Triangulation
Involves using different sources of information in order to increase the validity of a study
These sources are likely to be stakeholders in a program - participants, other researchers, program staff, other community members, and so on.
Then we put all data in single framework & apply various statistical tools to find out the dynamic on the market.
During the analysis stage, feedback from the stakeholder groups would be compared to determine areas of agreement as well as areas of divergence