

Key Insights
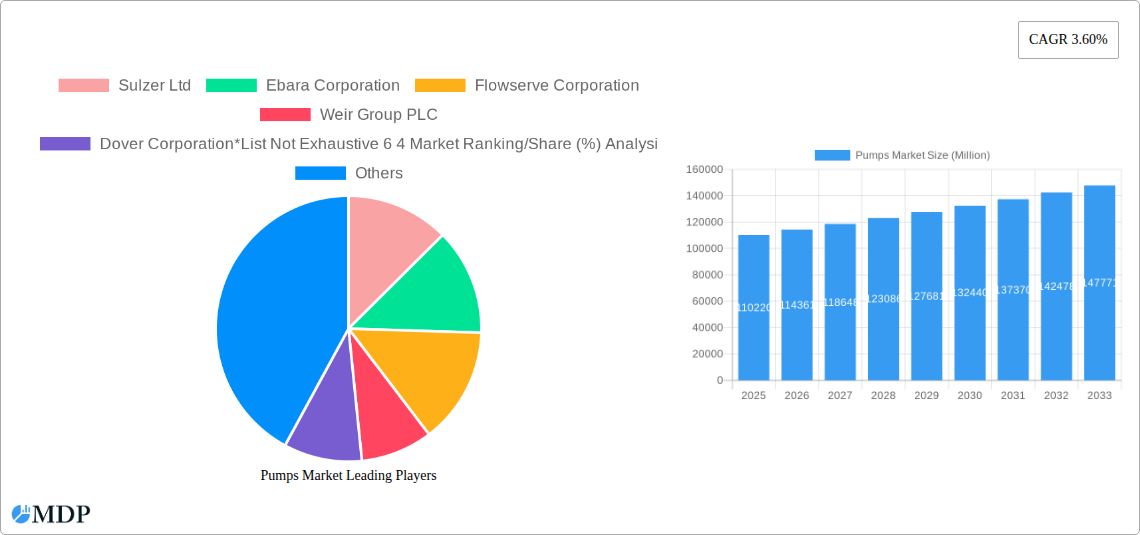
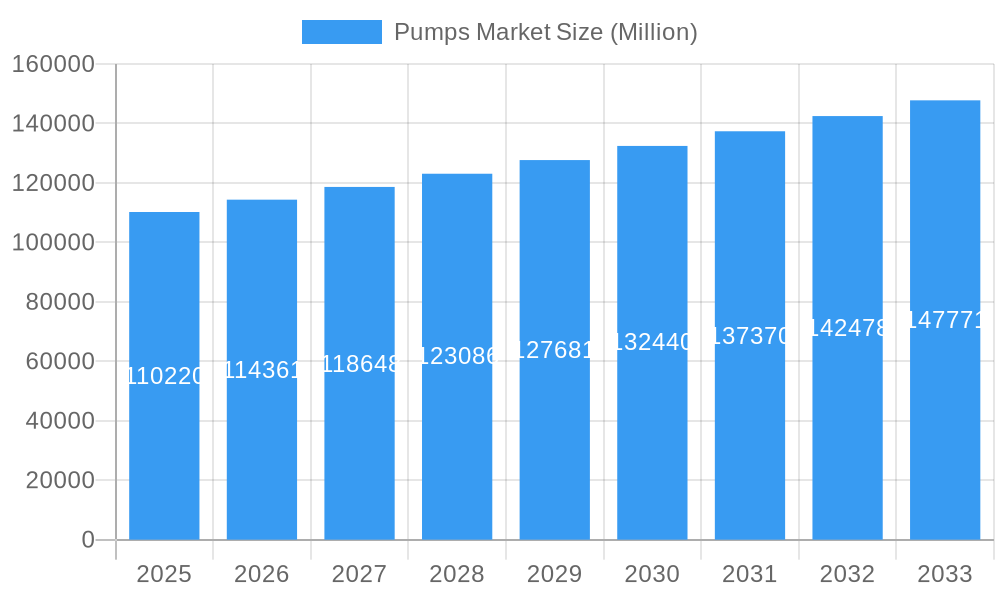
The global pumps market, valued at $110.22 billion in 2025, is projected to experience steady growth, driven by robust demand across diverse end-use sectors. A compound annual growth rate (CAGR) of 3.60% from 2025 to 2033 indicates a significant expansion, reaching approximately $150 billion by 2033. Key drivers include the increasing need for efficient fluid handling in oil and gas extraction, water and wastewater treatment, and the burgeoning chemical and petrochemical industries. Furthermore, growth in mining, power generation, and other industrial applications contributes significantly to market expansion. The centrifugal pump segment currently dominates the market due to its versatility and cost-effectiveness, while positive displacement pumps cater to specialized high-pressure applications. Geographical analysis reveals strong performance in North America and Europe, attributed to established industrial infrastructure and stringent environmental regulations. However, rapid industrialization and infrastructure development in Asia-Pacific are expected to fuel substantial growth in this region during the forecast period. Competitive pressures among established players like Sulzer Ltd, Ebara Corporation, and Flowserve Corporation, alongside the emergence of regional players, will shape market dynamics.
Pumps Market Market Size (In Billion)
Continued growth in the pumps market is anticipated due to several factors. Firstly, increasing investment in infrastructure projects globally will enhance demand for efficient pumping solutions across various sectors. Secondly, the rising focus on water management and wastewater treatment, driven by growing populations and stricter environmental regulations, represents a significant growth opportunity. Technological advancements in pump design, including the incorporation of smart sensors and improved energy efficiency, will continue to drive market innovation. Finally, the expanding scope of applications in diverse sectors such as renewable energy (e.g., geothermal power) and pharmaceuticals will also fuel market expansion. Challenges may include fluctuations in raw material prices and potential supply chain disruptions. However, the long-term outlook for the pumps market remains positive, with considerable growth potential driven by the aforementioned factors.
Pumps Market Company Market Share
Pumps Market Report: 2019-2033 Forecast - Unlocking Growth Opportunities in a Dynamic Industry
This comprehensive report provides a detailed analysis of the global pumps market, offering invaluable insights for industry stakeholders, investors, and strategic decision-makers. Covering the period 2019-2033, with a base year of 2025 and a forecast period of 2025-2033, this study dissects market dynamics, identifies key trends, and pinpoints lucrative opportunities. Benefit from our in-depth analysis of market segmentation, competitive landscape, and future projections, enabling you to make informed decisions and gain a competitive edge.
Pumps Market Market Dynamics & Concentration
The global pumps market, valued at xx Million in 2024, is characterized by a moderately concentrated landscape with several key players vying for market share. Market concentration is influenced by factors including technological advancements, stringent regulatory frameworks (e.g., emission standards impacting pump efficiency), the availability of substitute technologies (e.g., alternative fluid handling methods), and evolving end-user demands across diverse sectors. The market witnesses continuous innovation driven by the need for energy efficiency, enhanced reliability, and customized solutions. Mergers and acquisitions (M&A) play a significant role in shaping the market dynamics, with xx M&A deals recorded between 2019 and 2024. This activity reflects the strategic efforts of companies to expand their product portfolios, geographic reach, and technological capabilities.
- Market Share Analysis: The top 6 players, including Sulzer Ltd, Ebara Corporation, Flowserve Corporation, Weir Group PLC, Dover Corporation, and others, collectively hold approximately 40% of the global market share in 2024 (estimated).
- Innovation Drivers: Increased demand for energy-efficient pumps, smart pumps with IoT capabilities, and customized solutions for niche applications.
- Regulatory Frameworks: Stringent environmental regulations and safety standards driving adoption of eco-friendly and high-performance pumps.
- Product Substitutes: Competition from alternative fluid handling technologies, though limited, requires continuous innovation to maintain market share.
- End-User Trends: Growing demand from the Oil & Gas, Water & Wastewater, and Chemical sectors is shaping market growth.
- M&A Activity: Significant M&A activity, fueled by the need for market consolidation and technological advancement.
Pumps Market Industry Trends & Analysis
The global pumps market is experiencing robust growth, projected to achieve a CAGR of xx% during the forecast period (2025-2033). This growth is fueled by several factors, including increasing industrialization, infrastructure development (particularly in emerging economies), and rising demand for water and wastewater treatment solutions. Technological disruptions, such as the integration of advanced materials and digital technologies in pump design and manufacturing, are significantly impacting market dynamics. Consumer preferences are shifting towards energy-efficient, reliable, and easy-to-maintain pumps. The competitive landscape is marked by both intense rivalry among established players and the emergence of new entrants offering innovative solutions. Market penetration of smart pumps, equipped with advanced monitoring and control systems, is steadily increasing.
Leading Markets & Segments in Pumps Market
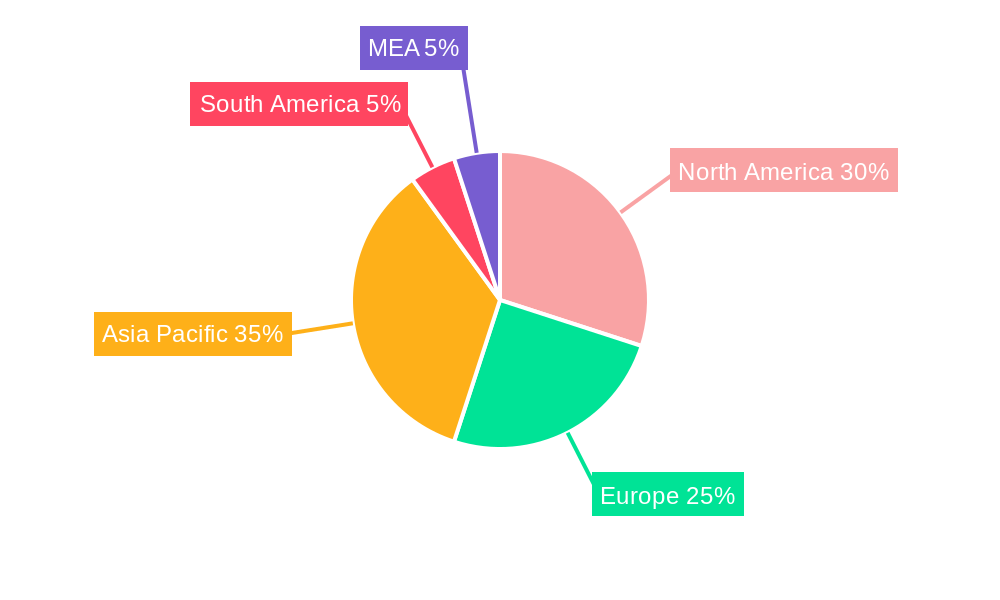
The Water and Wastewater segment dominates the end-user market, driven by increasing urbanization and stringent regulations regarding water quality and treatment. The Oil and Gas sector presents substantial growth opportunities due to ongoing exploration and production activities. Geographically, North America and Europe currently hold significant market share, but Asia-Pacific is emerging as a key growth region due to rapid industrialization and infrastructure development.
- Dominant Regions: North America, Europe, and Asia-Pacific
- Key Drivers for Water and Wastewater: Growing urbanization, stricter environmental regulations, and increasing investment in water infrastructure projects.
- Key Drivers for Oil and Gas: Rising global energy demand, expansion of exploration and production activities, and demand for efficient and reliable pumps in harsh environments.
- Key Drivers for Chemicals and Petrochemicals: Expansion of the chemical and petrochemical industries, and the need for specialized pumps capable of handling corrosive and hazardous fluids.
Centrifugal Pumps hold the largest share of the type segment due to their versatility, cost-effectiveness, and suitability for a wide range of applications. However, the Positive Displacement Pump segment is also witnessing significant growth driven by the need for precise fluid handling and high-pressure applications.
Pumps Market Product Developments
Recent years have seen significant advancements in pump technology, including the development of energy-efficient designs, smart pumps with integrated sensors and remote monitoring capabilities, and the use of advanced materials to improve durability and performance. These innovations cater to diverse industry needs, offering improved efficiency, reduced maintenance costs, and enhanced reliability. The market is witnessing increasing adoption of digitally enabled pumps to improve performance and operational efficiency.
Key Drivers of Pumps Market Growth
The pumps market's growth is propelled by several key factors: Firstly, increasing industrialization across emerging economies fuels demand for industrial pumps. Secondly, expanding infrastructure projects, particularly in water management and energy sectors, create significant opportunities. Finally, stringent environmental regulations necessitate the adoption of energy-efficient and eco-friendly pump technologies.
Challenges in the Pumps Market Market
The pumps market faces challenges like volatile raw material prices impacting production costs, supply chain disruptions affecting delivery timelines, and intense competition requiring continuous innovation to maintain market share. Furthermore, stringent regulatory compliance requirements add to operational complexity and expenses. These factors pose significant challenges to market growth and profitability.
Emerging Opportunities in Pumps Market
Significant opportunities exist in the development and deployment of smart pumps incorporating IoT capabilities, predictive maintenance features, and advanced data analytics for optimized performance and reduced downtime. Strategic partnerships between pump manufacturers and technology providers can unlock innovative solutions and expand market reach. Expansion into emerging markets with growing infrastructure needs also presents lucrative opportunities for growth.
Leading Players in the Pumps Market Sector
- Sulzer Ltd
- Ebara Corporation
- Flowserve Corporation
- Weir Group PLC
- Dover Corporation
- Clyde Union Inc
- Schlumberger Ltd
- KSB SE & Co KGaA
- ITT Inc
- Grundfos Holding AS
- Baker Hughes Company
Key Milestones in Pumps Market Industry
- December 2023: Packo Pumps website merged with Verder Liquids, expanding product offerings.
- May 2023: ClydeUnion Pumps secured an agreement with ONGC for pump maintenance services in India.
- February 2023: Motion & Control Enterprises acquired Precision Pump & Valve, strengthening its position in the oil and gas sector.
Strategic Outlook for Pumps Market Market
The pumps market is poised for sustained growth, driven by technological advancements, increasing industrialization, and infrastructure development. Strategic partnerships, focus on innovation, and expansion into new markets will be crucial for companies to capitalize on future growth opportunities and achieve a competitive edge. The integration of digital technologies and the development of sustainable pump solutions will further shape the market landscape in the coming years.
Pumps Market Segmentation
-
1. Type
- 1.1. Centrifugal Pump
- 1.2. Positive Displacement Pump
-
2. End User
- 2.1. Oil and Gas
- 2.2. Water and Wastewater
- 2.3. Chemicals and Petrochemicals
- 2.4. Mining Industry
- 2.5. Power Generation
- 2.6. Other End Users
Pumps Market Segmentation By Geography
-
1. North America
- 1.1. United States
- 1.2. Canada
- 1.3. Rest of North America
-
2. Europe
- 2.1. Germany
- 2.2. France
- 2.3. Spain
- 2.4. United Kingdom
- 2.5. Russia
- 2.6. NORDIC
- 2.7. Italy
- 2.8. Turkey
- 2.9. Rest of Europe
-
3. Asia Pacific
- 3.1. China
- 3.2. India
- 3.3. Japan
- 3.4. South Korea
- 3.5. Australia
- 3.6. Malaysia
- 3.7. Thailand
- 3.8. Indonesia
- 3.9. Vietnam
- 3.10. Rest of Asia Pacific
-
4. South America
- 4.1. Brazil
- 4.2. Argentina
- 4.3. Colombia
- 4.4. Rest of South America
-
5. Middle East and Africa
- 5.1. Saudi Arabia
- 5.2. United Arab Emirates
- 5.3. South Africa
- 5.4. Nigeria
- 5.5. Qatar
- 5.6. Egypt
- 5.7. Rest of the Middle East and Africa
Pumps Market Regional Market Share
Geographic Coverage of Pumps Market
Pumps Market REPORT HIGHLIGHTS
| Aspects | Details |
|---|---|
| Study Period | 2020-2034 |
| Base Year | 2025 |
| Estimated Year | 2026 |
| Forecast Period | 2026-2034 |
| Historical Period | 2020-2025 |
| Growth Rate | CAGR of 3.60% from 2020-2034 |
| Segmentation |
|
Table of Contents
- 1. Introduction
- 1.1. Research Scope
- 1.2. Market Segmentation
- 1.3. Research Objective
- 1.4. Definitions and Assumptions
- 2. Executive Summary
- 2.1. Market Snapshot
- 3. Market Dynamics
- 3.1. Market Drivers
- 3.2. Market Restrains
- 3.3. Market Trends
- 3.4. Market Opportunities
- 4. Market Factor Analysis
- 4.1. Porters Five Forces
- 4.1.1. Bargaining Power of Suppliers
- 4.1.2. Bargaining Power of Buyers
- 4.1.3. Threat of New Entrants
- 4.1.4. Threat of Substitutes
- 4.1.5. Competitive Rivalry
- 4.2. PESTEL analysis
- 4.3. BCG Analysis
- 4.3.1. Stars (High Growth, High Market Share)
- 4.3.2. Cash Cows (Low Growth, High Market Share)
- 4.3.3. Question Mark (High Growth, Low Market Share)
- 4.3.4. Dogs (Low Growth, Low Market Share)
- 4.4. Ansoff Matrix Analysis
- 4.5. Supply Chain Analysis
- 4.6. Regulatory Landscape
- 4.7. Current Market Potential and Opportunity Assessment (TAM–SAM–SOM Framework)
- 4.8. MDP Analyst Note
- 4.1. Porters Five Forces
- 5. Market Analysis, Insights and Forecast 2021-2033
- 5.1. Market Analysis, Insights and Forecast - by Type
- 5.1.1. Centrifugal Pump
- 5.1.2. Positive Displacement Pump
- 5.2. Market Analysis, Insights and Forecast - by End User
- 5.2.1. Oil and Gas
- 5.2.2. Water and Wastewater
- 5.2.3. Chemicals and Petrochemicals
- 5.2.4. Mining Industry
- 5.2.5. Power Generation
- 5.2.6. Other End Users
- 5.3. Market Analysis, Insights and Forecast - by Region
- 5.3.1. North America
- 5.3.2. Europe
- 5.3.3. Asia Pacific
- 5.3.4. South America
- 5.3.5. Middle East and Africa
- 5.1. Market Analysis, Insights and Forecast - by Type
- 6. Global Pumps Market Analysis, Insights and Forecast, 2021-2033
- 6.1. Market Analysis, Insights and Forecast - by Type
- 6.1.1. Centrifugal Pump
- 6.1.2. Positive Displacement Pump
- 6.2. Market Analysis, Insights and Forecast - by End User
- 6.2.1. Oil and Gas
- 6.2.2. Water and Wastewater
- 6.2.3. Chemicals and Petrochemicals
- 6.2.4. Mining Industry
- 6.2.5. Power Generation
- 6.2.6. Other End Users
- 6.1. Market Analysis, Insights and Forecast - by Type
- 7. North America Pumps Market Analysis, Insights and Forecast, 2020-2032
- 7.1. Market Analysis, Insights and Forecast - by Type
- 7.1.1. Centrifugal Pump
- 7.1.2. Positive Displacement Pump
- 7.2. Market Analysis, Insights and Forecast - by End User
- 7.2.1. Oil and Gas
- 7.2.2. Water and Wastewater
- 7.2.3. Chemicals and Petrochemicals
- 7.2.4. Mining Industry
- 7.2.5. Power Generation
- 7.2.6. Other End Users
- 7.1. Market Analysis, Insights and Forecast - by Type
- 8. Europe Pumps Market Analysis, Insights and Forecast, 2020-2032
- 8.1. Market Analysis, Insights and Forecast - by Type
- 8.1.1. Centrifugal Pump
- 8.1.2. Positive Displacement Pump
- 8.2. Market Analysis, Insights and Forecast - by End User
- 8.2.1. Oil and Gas
- 8.2.2. Water and Wastewater
- 8.2.3. Chemicals and Petrochemicals
- 8.2.4. Mining Industry
- 8.2.5. Power Generation
- 8.2.6. Other End Users
- 8.1. Market Analysis, Insights and Forecast - by Type
- 9. Asia Pacific Pumps Market Analysis, Insights and Forecast, 2020-2032
- 9.1. Market Analysis, Insights and Forecast - by Type
- 9.1.1. Centrifugal Pump
- 9.1.2. Positive Displacement Pump
- 9.2. Market Analysis, Insights and Forecast - by End User
- 9.2.1. Oil and Gas
- 9.2.2. Water and Wastewater
- 9.2.3. Chemicals and Petrochemicals
- 9.2.4. Mining Industry
- 9.2.5. Power Generation
- 9.2.6. Other End Users
- 9.1. Market Analysis, Insights and Forecast - by Type
- 10. South America Pumps Market Analysis, Insights and Forecast, 2020-2032
- 10.1. Market Analysis, Insights and Forecast - by Type
- 10.1.1. Centrifugal Pump
- 10.1.2. Positive Displacement Pump
- 10.2. Market Analysis, Insights and Forecast - by End User
- 10.2.1. Oil and Gas
- 10.2.2. Water and Wastewater
- 10.2.3. Chemicals and Petrochemicals
- 10.2.4. Mining Industry
- 10.2.5. Power Generation
- 10.2.6. Other End Users
- 10.1. Market Analysis, Insights and Forecast - by Type
- 11. Middle East and Africa Pumps Market Analysis, Insights and Forecast, 2020-2032
- 11.1. Market Analysis, Insights and Forecast - by Type
- 11.1.1. Centrifugal Pump
- 11.1.2. Positive Displacement Pump
- 11.2. Market Analysis, Insights and Forecast - by End User
- 11.2.1. Oil and Gas
- 11.2.2. Water and Wastewater
- 11.2.3. Chemicals and Petrochemicals
- 11.2.4. Mining Industry
- 11.2.5. Power Generation
- 11.2.6. Other End Users
- 11.1. Market Analysis, Insights and Forecast - by Type
- 12. Competitive Analysis
- 12.1. Company Profiles
- 12.1.1 Sulzer Ltd
- 12.1.1.1. Company Overview
- 12.1.1.2. Products
- 12.1.1.3. Company Financials
- 12.1.1.4. SWOT Analysis
- 12.1.2 Ebara Corporation
- 12.1.2.1. Company Overview
- 12.1.2.2. Products
- 12.1.2.3. Company Financials
- 12.1.2.4. SWOT Analysis
- 12.1.3 Flowserve Corporation
- 12.1.3.1. Company Overview
- 12.1.3.2. Products
- 12.1.3.3. Company Financials
- 12.1.3.4. SWOT Analysis
- 12.1.4 Weir Group PLC
- 12.1.4.1. Company Overview
- 12.1.4.2. Products
- 12.1.4.3. Company Financials
- 12.1.4.4. SWOT Analysis
- 12.1.5 Dover Corporation*List Not Exhaustive 6 4 Market Ranking/Share (%) Analysi
- 12.1.5.1. Company Overview
- 12.1.5.2. Products
- 12.1.5.3. Company Financials
- 12.1.5.4. SWOT Analysis
- 12.1.6 Clyde Union Inc
- 12.1.6.1. Company Overview
- 12.1.6.2. Products
- 12.1.6.3. Company Financials
- 12.1.6.4. SWOT Analysis
- 12.1.7 Schlumberger Ltd
- 12.1.7.1. Company Overview
- 12.1.7.2. Products
- 12.1.7.3. Company Financials
- 12.1.7.4. SWOT Analysis
- 12.1.8 KSB SE & Co KGaA
- 12.1.8.1. Company Overview
- 12.1.8.2. Products
- 12.1.8.3. Company Financials
- 12.1.8.4. SWOT Analysis
- 12.1.9 ITT Inc
- 12.1.9.1. Company Overview
- 12.1.9.2. Products
- 12.1.9.3. Company Financials
- 12.1.9.4. SWOT Analysis
- 12.1.10 Grundfos Holding AS
- 12.1.10.1. Company Overview
- 12.1.10.2. Products
- 12.1.10.3. Company Financials
- 12.1.10.4. SWOT Analysis
- 12.1.11 Baker Hughes Company
- 12.1.11.1. Company Overview
- 12.1.11.2. Products
- 12.1.11.3. Company Financials
- 12.1.11.4. SWOT Analysis
- 12.1.1 Sulzer Ltd
- 12.2. Market Entropy
- 12.2.1 Company's Key Areas Served
- 12.2.2 Recent Developments
- 12.3. Company Market Share Analysis 2025
- 12.3.1 Top 5 Companies Market Share Analysis
- 12.3.2 Top 3 Companies Market Share Analysis
- 12.4. List of Potential Customers
- 13. Research Methodology
List of Figures
- Figure 1: Global Pumps Market Revenue Breakdown (Million, %) by Region 2025 & 2033
- Figure 2: Global Pumps Market Volume Breakdown (K Unit, %) by Region 2025 & 2033
- Figure 3: North America Pumps Market Revenue (Million), by Type 2025 & 2033
- Figure 4: North America Pumps Market Volume (K Unit), by Type 2025 & 2033
- Figure 5: North America Pumps Market Revenue Share (%), by Type 2025 & 2033
- Figure 6: North America Pumps Market Volume Share (%), by Type 2025 & 2033
- Figure 7: North America Pumps Market Revenue (Million), by End User 2025 & 2033
- Figure 8: North America Pumps Market Volume (K Unit), by End User 2025 & 2033
- Figure 9: North America Pumps Market Revenue Share (%), by End User 2025 & 2033
- Figure 10: North America Pumps Market Volume Share (%), by End User 2025 & 2033
- Figure 11: North America Pumps Market Revenue (Million), by Country 2025 & 2033
- Figure 12: North America Pumps Market Volume (K Unit), by Country 2025 & 2033
- Figure 13: North America Pumps Market Revenue Share (%), by Country 2025 & 2033
- Figure 14: North America Pumps Market Volume Share (%), by Country 2025 & 2033
- Figure 15: Europe Pumps Market Revenue (Million), by Type 2025 & 2033
- Figure 16: Europe Pumps Market Volume (K Unit), by Type 2025 & 2033
- Figure 17: Europe Pumps Market Revenue Share (%), by Type 2025 & 2033
- Figure 18: Europe Pumps Market Volume Share (%), by Type 2025 & 2033
- Figure 19: Europe Pumps Market Revenue (Million), by End User 2025 & 2033
- Figure 20: Europe Pumps Market Volume (K Unit), by End User 2025 & 2033
- Figure 21: Europe Pumps Market Revenue Share (%), by End User 2025 & 2033
- Figure 22: Europe Pumps Market Volume Share (%), by End User 2025 & 2033
- Figure 23: Europe Pumps Market Revenue (Million), by Country 2025 & 2033
- Figure 24: Europe Pumps Market Volume (K Unit), by Country 2025 & 2033
- Figure 25: Europe Pumps Market Revenue Share (%), by Country 2025 & 2033
- Figure 26: Europe Pumps Market Volume Share (%), by Country 2025 & 2033
- Figure 27: Asia Pacific Pumps Market Revenue (Million), by Type 2025 & 2033
- Figure 28: Asia Pacific Pumps Market Volume (K Unit), by Type 2025 & 2033
- Figure 29: Asia Pacific Pumps Market Revenue Share (%), by Type 2025 & 2033
- Figure 30: Asia Pacific Pumps Market Volume Share (%), by Type 2025 & 2033
- Figure 31: Asia Pacific Pumps Market Revenue (Million), by End User 2025 & 2033
- Figure 32: Asia Pacific Pumps Market Volume (K Unit), by End User 2025 & 2033
- Figure 33: Asia Pacific Pumps Market Revenue Share (%), by End User 2025 & 2033
- Figure 34: Asia Pacific Pumps Market Volume Share (%), by End User 2025 & 2033
- Figure 35: Asia Pacific Pumps Market Revenue (Million), by Country 2025 & 2033
- Figure 36: Asia Pacific Pumps Market Volume (K Unit), by Country 2025 & 2033
- Figure 37: Asia Pacific Pumps Market Revenue Share (%), by Country 2025 & 2033
- Figure 38: Asia Pacific Pumps Market Volume Share (%), by Country 2025 & 2033
- Figure 39: South America Pumps Market Revenue (Million), by Type 2025 & 2033
- Figure 40: South America Pumps Market Volume (K Unit), by Type 2025 & 2033
- Figure 41: South America Pumps Market Revenue Share (%), by Type 2025 & 2033
- Figure 42: South America Pumps Market Volume Share (%), by Type 2025 & 2033
- Figure 43: South America Pumps Market Revenue (Million), by End User 2025 & 2033
- Figure 44: South America Pumps Market Volume (K Unit), by End User 2025 & 2033
- Figure 45: South America Pumps Market Revenue Share (%), by End User 2025 & 2033
- Figure 46: South America Pumps Market Volume Share (%), by End User 2025 & 2033
- Figure 47: South America Pumps Market Revenue (Million), by Country 2025 & 2033
- Figure 48: South America Pumps Market Volume (K Unit), by Country 2025 & 2033
- Figure 49: South America Pumps Market Revenue Share (%), by Country 2025 & 2033
- Figure 50: South America Pumps Market Volume Share (%), by Country 2025 & 2033
- Figure 51: Middle East and Africa Pumps Market Revenue (Million), by Type 2025 & 2033
- Figure 52: Middle East and Africa Pumps Market Volume (K Unit), by Type 2025 & 2033
- Figure 53: Middle East and Africa Pumps Market Revenue Share (%), by Type 2025 & 2033
- Figure 54: Middle East and Africa Pumps Market Volume Share (%), by Type 2025 & 2033
- Figure 55: Middle East and Africa Pumps Market Revenue (Million), by End User 2025 & 2033
- Figure 56: Middle East and Africa Pumps Market Volume (K Unit), by End User 2025 & 2033
- Figure 57: Middle East and Africa Pumps Market Revenue Share (%), by End User 2025 & 2033
- Figure 58: Middle East and Africa Pumps Market Volume Share (%), by End User 2025 & 2033
- Figure 59: Middle East and Africa Pumps Market Revenue (Million), by Country 2025 & 2033
- Figure 60: Middle East and Africa Pumps Market Volume (K Unit), by Country 2025 & 2033
- Figure 61: Middle East and Africa Pumps Market Revenue Share (%), by Country 2025 & 2033
- Figure 62: Middle East and Africa Pumps Market Volume Share (%), by Country 2025 & 2033
List of Tables
- Table 1: Global Pumps Market Revenue Million Forecast, by Type 2020 & 2033
- Table 2: Global Pumps Market Volume K Unit Forecast, by Type 2020 & 2033
- Table 3: Global Pumps Market Revenue Million Forecast, by End User 2020 & 2033
- Table 4: Global Pumps Market Volume K Unit Forecast, by End User 2020 & 2033
- Table 5: Global Pumps Market Revenue Million Forecast, by Region 2020 & 2033
- Table 6: Global Pumps Market Volume K Unit Forecast, by Region 2020 & 2033
- Table 7: Global Pumps Market Revenue Million Forecast, by Type 2020 & 2033
- Table 8: Global Pumps Market Volume K Unit Forecast, by Type 2020 & 2033
- Table 9: Global Pumps Market Revenue Million Forecast, by End User 2020 & 2033
- Table 10: Global Pumps Market Volume K Unit Forecast, by End User 2020 & 2033
- Table 11: Global Pumps Market Revenue Million Forecast, by Country 2020 & 2033
- Table 12: Global Pumps Market Volume K Unit Forecast, by Country 2020 & 2033
- Table 13: United States Pumps Market Revenue (Million) Forecast, by Application 2020 & 2033
- Table 14: United States Pumps Market Volume (K Unit) Forecast, by Application 2020 & 2033
- Table 15: Canada Pumps Market Revenue (Million) Forecast, by Application 2020 & 2033
- Table 16: Canada Pumps Market Volume (K Unit) Forecast, by Application 2020 & 2033
- Table 17: Rest of North America Pumps Market Revenue (Million) Forecast, by Application 2020 & 2033
- Table 18: Rest of North America Pumps Market Volume (K Unit) Forecast, by Application 2020 & 2033
- Table 19: Global Pumps Market Revenue Million Forecast, by Type 2020 & 2033
- Table 20: Global Pumps Market Volume K Unit Forecast, by Type 2020 & 2033
- Table 21: Global Pumps Market Revenue Million Forecast, by End User 2020 & 2033
- Table 22: Global Pumps Market Volume K Unit Forecast, by End User 2020 & 2033
- Table 23: Global Pumps Market Revenue Million Forecast, by Country 2020 & 2033
- Table 24: Global Pumps Market Volume K Unit Forecast, by Country 2020 & 2033
- Table 25: Germany Pumps Market Revenue (Million) Forecast, by Application 2020 & 2033
- Table 26: Germany Pumps Market Volume (K Unit) Forecast, by Application 2020 & 2033
- Table 27: France Pumps Market Revenue (Million) Forecast, by Application 2020 & 2033
- Table 28: France Pumps Market Volume (K Unit) Forecast, by Application 2020 & 2033
- Table 29: Spain Pumps Market Revenue (Million) Forecast, by Application 2020 & 2033
- Table 30: Spain Pumps Market Volume (K Unit) Forecast, by Application 2020 & 2033
- Table 31: United Kingdom Pumps Market Revenue (Million) Forecast, by Application 2020 & 2033
- Table 32: United Kingdom Pumps Market Volume (K Unit) Forecast, by Application 2020 & 2033
- Table 33: Russia Pumps Market Revenue (Million) Forecast, by Application 2020 & 2033
- Table 34: Russia Pumps Market Volume (K Unit) Forecast, by Application 2020 & 2033
- Table 35: NORDIC Pumps Market Revenue (Million) Forecast, by Application 2020 & 2033
- Table 36: NORDIC Pumps Market Volume (K Unit) Forecast, by Application 2020 & 2033
- Table 37: Italy Pumps Market Revenue (Million) Forecast, by Application 2020 & 2033
- Table 38: Italy Pumps Market Volume (K Unit) Forecast, by Application 2020 & 2033
- Table 39: Turkey Pumps Market Revenue (Million) Forecast, by Application 2020 & 2033
- Table 40: Turkey Pumps Market Volume (K Unit) Forecast, by Application 2020 & 2033
- Table 41: Rest of Europe Pumps Market Revenue (Million) Forecast, by Application 2020 & 2033
- Table 42: Rest of Europe Pumps Market Volume (K Unit) Forecast, by Application 2020 & 2033
- Table 43: Global Pumps Market Revenue Million Forecast, by Type 2020 & 2033
- Table 44: Global Pumps Market Volume K Unit Forecast, by Type 2020 & 2033
- Table 45: Global Pumps Market Revenue Million Forecast, by End User 2020 & 2033
- Table 46: Global Pumps Market Volume K Unit Forecast, by End User 2020 & 2033
- Table 47: Global Pumps Market Revenue Million Forecast, by Country 2020 & 2033
- Table 48: Global Pumps Market Volume K Unit Forecast, by Country 2020 & 2033
- Table 49: China Pumps Market Revenue (Million) Forecast, by Application 2020 & 2033
- Table 50: China Pumps Market Volume (K Unit) Forecast, by Application 2020 & 2033
- Table 51: India Pumps Market Revenue (Million) Forecast, by Application 2020 & 2033
- Table 52: India Pumps Market Volume (K Unit) Forecast, by Application 2020 & 2033
- Table 53: Japan Pumps Market Revenue (Million) Forecast, by Application 2020 & 2033
- Table 54: Japan Pumps Market Volume (K Unit) Forecast, by Application 2020 & 2033
- Table 55: South Korea Pumps Market Revenue (Million) Forecast, by Application 2020 & 2033
- Table 56: South Korea Pumps Market Volume (K Unit) Forecast, by Application 2020 & 2033
- Table 57: Australia Pumps Market Revenue (Million) Forecast, by Application 2020 & 2033
- Table 58: Australia Pumps Market Volume (K Unit) Forecast, by Application 2020 & 2033
- Table 59: Malaysia Pumps Market Revenue (Million) Forecast, by Application 2020 & 2033
- Table 60: Malaysia Pumps Market Volume (K Unit) Forecast, by Application 2020 & 2033
- Table 61: Thailand Pumps Market Revenue (Million) Forecast, by Application 2020 & 2033
- Table 62: Thailand Pumps Market Volume (K Unit) Forecast, by Application 2020 & 2033
- Table 63: Indonesia Pumps Market Revenue (Million) Forecast, by Application 2020 & 2033
- Table 64: Indonesia Pumps Market Volume (K Unit) Forecast, by Application 2020 & 2033
- Table 65: Vietnam Pumps Market Revenue (Million) Forecast, by Application 2020 & 2033
- Table 66: Vietnam Pumps Market Volume (K Unit) Forecast, by Application 2020 & 2033
- Table 67: Rest of Asia Pacific Pumps Market Revenue (Million) Forecast, by Application 2020 & 2033
- Table 68: Rest of Asia Pacific Pumps Market Volume (K Unit) Forecast, by Application 2020 & 2033
- Table 69: Global Pumps Market Revenue Million Forecast, by Type 2020 & 2033
- Table 70: Global Pumps Market Volume K Unit Forecast, by Type 2020 & 2033
- Table 71: Global Pumps Market Revenue Million Forecast, by End User 2020 & 2033
- Table 72: Global Pumps Market Volume K Unit Forecast, by End User 2020 & 2033
- Table 73: Global Pumps Market Revenue Million Forecast, by Country 2020 & 2033
- Table 74: Global Pumps Market Volume K Unit Forecast, by Country 2020 & 2033
- Table 75: Brazil Pumps Market Revenue (Million) Forecast, by Application 2020 & 2033
- Table 76: Brazil Pumps Market Volume (K Unit) Forecast, by Application 2020 & 2033
- Table 77: Argentina Pumps Market Revenue (Million) Forecast, by Application 2020 & 2033
- Table 78: Argentina Pumps Market Volume (K Unit) Forecast, by Application 2020 & 2033
- Table 79: Colombia Pumps Market Revenue (Million) Forecast, by Application 2020 & 2033
- Table 80: Colombia Pumps Market Volume (K Unit) Forecast, by Application 2020 & 2033
- Table 81: Rest of South America Pumps Market Revenue (Million) Forecast, by Application 2020 & 2033
- Table 82: Rest of South America Pumps Market Volume (K Unit) Forecast, by Application 2020 & 2033
- Table 83: Global Pumps Market Revenue Million Forecast, by Type 2020 & 2033
- Table 84: Global Pumps Market Volume K Unit Forecast, by Type 2020 & 2033
- Table 85: Global Pumps Market Revenue Million Forecast, by End User 2020 & 2033
- Table 86: Global Pumps Market Volume K Unit Forecast, by End User 2020 & 2033
- Table 87: Global Pumps Market Revenue Million Forecast, by Country 2020 & 2033
- Table 88: Global Pumps Market Volume K Unit Forecast, by Country 2020 & 2033
- Table 89: Saudi Arabia Pumps Market Revenue (Million) Forecast, by Application 2020 & 2033
- Table 90: Saudi Arabia Pumps Market Volume (K Unit) Forecast, by Application 2020 & 2033
- Table 91: United Arab Emirates Pumps Market Revenue (Million) Forecast, by Application 2020 & 2033
- Table 92: United Arab Emirates Pumps Market Volume (K Unit) Forecast, by Application 2020 & 2033
- Table 93: South Africa Pumps Market Revenue (Million) Forecast, by Application 2020 & 2033
- Table 94: South Africa Pumps Market Volume (K Unit) Forecast, by Application 2020 & 2033
- Table 95: Nigeria Pumps Market Revenue (Million) Forecast, by Application 2020 & 2033
- Table 96: Nigeria Pumps Market Volume (K Unit) Forecast, by Application 2020 & 2033
- Table 97: Qatar Pumps Market Revenue (Million) Forecast, by Application 2020 & 2033
- Table 98: Qatar Pumps Market Volume (K Unit) Forecast, by Application 2020 & 2033
- Table 99: Egypt Pumps Market Revenue (Million) Forecast, by Application 2020 & 2033
- Table 100: Egypt Pumps Market Volume (K Unit) Forecast, by Application 2020 & 2033
- Table 101: Rest of the Middle East and Africa Pumps Market Revenue (Million) Forecast, by Application 2020 & 2033
- Table 102: Rest of the Middle East and Africa Pumps Market Volume (K Unit) Forecast, by Application 2020 & 2033
Frequently Asked Questions
1. What is the projected Compound Annual Growth Rate (CAGR) of the Pumps Market?
The projected CAGR is approximately 3.60%.
2. Which companies are prominent players in the Pumps Market?
Key companies in the market include Sulzer Ltd, Ebara Corporation, Flowserve Corporation, Weir Group PLC, Dover Corporation*List Not Exhaustive 6 4 Market Ranking/Share (%) Analysi, Clyde Union Inc, Schlumberger Ltd, KSB SE & Co KGaA, ITT Inc, Grundfos Holding AS, Baker Hughes Company.
3. What are the main segments of the Pumps Market?
The market segments include Type, End User.
4. Can you provide details about the market size?
The market size is estimated to be USD 110.22 Million as of 2022.
5. What are some drivers contributing to market growth?
Increasing Infrastructure Development4.; Rising Emphasis Water and Wastewater Management.
6. What are the notable trends driving market growth?
Oil and Gas Sector Expected to Witness Significant Growth.
7. Are there any restraints impacting market growth?
Volatility in Raw Material Prices.
8. Can you provide examples of recent developments in the market?
December 2023: The Packo Pumps website merged with the Verder Liquids website. The collaboration aims to reinforce the relationship between Verder and Packo and provide customers with a broader range of pump technologies.
9. What pricing options are available for accessing the report?
Pricing options include single-user, multi-user, and enterprise licenses priced at USD 4750, USD 5250, and USD 8750 respectively.
10. Is the market size provided in terms of value or volume?
The market size is provided in terms of value, measured in Million and volume, measured in K Unit.
11. Are there any specific market keywords associated with the report?
Yes, the market keyword associated with the report is "Pumps Market," which aids in identifying and referencing the specific market segment covered.
12. How do I determine which pricing option suits my needs best?
The pricing options vary based on user requirements and access needs. Individual users may opt for single-user licenses, while businesses requiring broader access may choose multi-user or enterprise licenses for cost-effective access to the report.
13. Are there any additional resources or data provided in the Pumps Market report?
While the report offers comprehensive insights, it's advisable to review the specific contents or supplementary materials provided to ascertain if additional resources or data are available.
14. How can I stay updated on further developments or reports in the Pumps Market?
To stay informed about further developments, trends, and reports in the Pumps Market, consider subscribing to industry newsletters, following relevant companies and organizations, or regularly checking reputable industry news sources and publications.
Methodology
Step 1 - Identification of Relevant Samples Size from Population Database


Step 2 - Approaches for Defining Global Market Size (Value, Volume* & Price*)

Note*: In applicable scenarios
Step 3 - Data Sources
Primary Research
- Web Analytics
- Survey Reports
- Research Institute
- Latest Research Reports
- Opinion Leaders
Secondary Research
- Annual Reports
- White Paper
- Latest Press Release
- Industry Association
- Paid Database
- Investor Presentations

Step 4 - Data Triangulation
Involves using different sources of information in order to increase the validity of a study
These sources are likely to be stakeholders in a program - participants, other researchers, program staff, other community members, and so on.
Then we put all data in single framework & apply various statistical tools to find out the dynamic on the market.
During the analysis stage, feedback from the stakeholder groups would be compared to determine areas of agreement as well as areas of divergence