

Key Insights
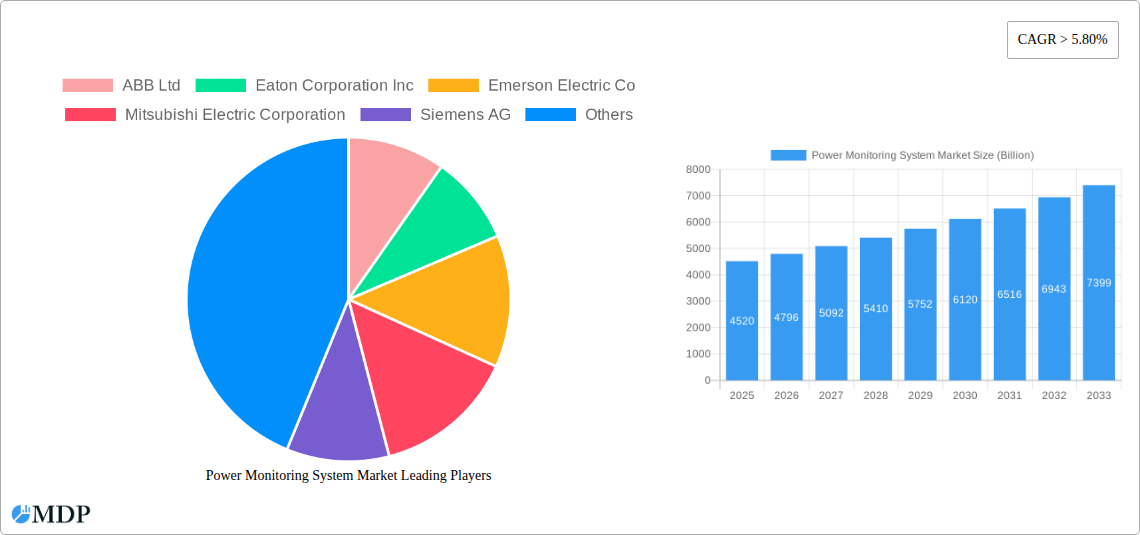
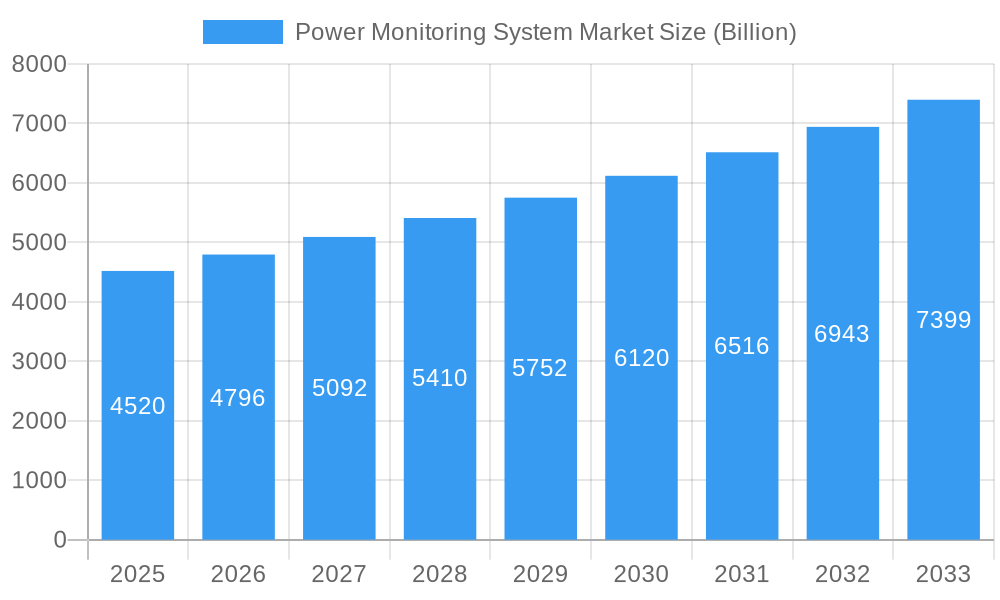
The global Power Monitoring System market is experiencing robust growth, projected to reach a market size of $4.52 billion in 2025 and maintain a Compound Annual Growth Rate (CAGR) exceeding 5.80% from 2025 to 2033. This expansion is fueled by several key drivers. The increasing demand for energy efficiency across commercial and industrial sectors is a primary factor, with businesses actively seeking solutions to optimize energy consumption and reduce operational costs. Furthermore, the rising adoption of smart grids and renewable energy sources necessitates advanced power monitoring capabilities for efficient grid management and integration of distributed generation. Stringent government regulations promoting energy conservation and improved grid reliability also contribute to market growth. Technological advancements, such as the development of sophisticated sensors, advanced analytics, and improved data communication technologies, are enhancing the capabilities of power monitoring systems, making them more effective and user-friendly. The market is segmented by end-user into Commercial and Industrial, Utilities, and Others, with the Commercial and Industrial segment currently holding a significant share due to the high concentration of energy-intensive operations. Key players like ABB, Eaton, Emerson, Mitsubishi Electric, Siemens, Schneider Electric, and others are driving innovation and competition within the market, constantly improving product offerings and expanding their geographic reach.
Power Monitoring System Market Market Size (In Billion)
Geographic expansion presents a significant opportunity for growth. North America currently holds a substantial market share, primarily driven by the US, followed by Europe and the Asia-Pacific region. However, developing economies in Asia-Pacific, particularly in countries like India and China, are experiencing rapid industrialization and urbanization, creating substantial demand for improved power management infrastructure. This is fueling substantial growth in these regions, alongside the increasing adoption of smart city initiatives. While the market enjoys significant growth potential, challenges exist. High initial investment costs for implementing sophisticated power monitoring systems can act as a barrier to entry for smaller businesses. Furthermore, ensuring data security and system reliability in the face of cyber threats remains a critical concern. Overcoming these challenges through strategic partnerships, technological innovation, and effective cybersecurity measures will be crucial for sustained market growth.
Power Monitoring System Market Company Market Share
Power Monitoring System Market: A Comprehensive Report (2019-2033)
This in-depth report provides a comprehensive analysis of the global Power Monitoring System market, projecting a market valuation of $XX Billion by 2033. The study covers the period from 2019 to 2033, with 2025 serving as the base and estimated year. This report is essential for industry stakeholders, investors, and businesses seeking actionable insights to navigate this dynamic market. Key players like ABB Ltd, Eaton Corporation Inc, Emerson Electric Co, Mitsubishi Electric Corporation, Siemens AG, Schneider Electric SE, Fuji Electric FA Components & Systems Co Ltd, Fluke Corporation, Rockwell Automation Inc, Yokogawa Electric Corporation, and General Electric Company are analyzed, revealing their market share, strategies, and competitive landscape. The report segments the market by end-user (Commercial and Industrial, Utilities, Others) and provides a detailed forecast, highlighting key growth drivers, challenges, and emerging opportunities.
Power Monitoring System Market Dynamics & Concentration
The Power Monitoring System market exhibits a moderately consolidated structure, with the top five players holding approximately XX% of the global market share in 2025. Market concentration is influenced by factors such as stringent regulatory frameworks, technological advancements, and increasing demand for energy efficiency. Innovation drives market growth, with companies continuously developing advanced monitoring systems incorporating IoT, AI, and Big Data analytics. The prevalence of product substitutes, such as traditional manual monitoring methods, presents a competitive challenge. End-user trends toward smart grids and digital transformation fuel market demand.
- Market Concentration: Top 5 players hold ~XX% market share (2025).
- M&A Activity: XX major M&A deals recorded between 2019 and 2024.
- Innovation Drivers: IoT integration, AI-powered analytics, advanced metering infrastructure (AMI).
- Regulatory Frameworks: Stringent energy efficiency standards and grid modernization initiatives.
- Product Substitutes: Traditional manual monitoring methods.
- End-User Trends: Growing adoption of smart grids and digital transformation.
Power Monitoring System Market Industry Trends & Analysis
The Power Monitoring System market is experiencing robust growth, with a projected CAGR of XX% during the forecast period (2025-2033). This growth is driven by the increasing adoption of renewable energy sources, the rising demand for energy efficiency, and the expanding implementation of smart grids globally. Technological disruptions, such as the advent of advanced sensors and cloud-based platforms, are revolutionizing the industry. Consumer preferences are shifting towards real-time monitoring capabilities, remote access, and data-driven insights. The competitive dynamics are intense, with companies focusing on product differentiation, strategic partnerships, and technological advancements to maintain their market share. Market penetration is expected to reach XX% by 2033, driven by factors such as government incentives and the increasing awareness of energy management.
Leading Markets & Segments in Power Monitoring System Market
The Commercial and Industrial segment dominates the Power Monitoring System market, driven by the increasing need for energy optimization in commercial buildings and industrial facilities. North America currently holds the largest market share, propelled by robust infrastructure development and government support for energy efficiency initiatives.
Key Drivers for Commercial and Industrial Segment:
- Stringent energy regulations and incentives.
- Growing awareness of energy cost savings.
- Increasing adoption of smart building technologies.
Key Drivers for North American Market Dominance:
- Advanced infrastructure and technological adoption.
- Favorable government policies and investments.
- High industrial activity and energy consumption.
Detailed Dominance Analysis: North America's robust economy, strong regulatory framework promoting energy efficiency, and high adoption of advanced technologies position it as the leading market. The substantial presence of major players and the early adoption of smart grid technologies further solidify its dominance. Asia-Pacific is expected to show significant growth in the coming years due to increasing urbanization and industrialization.
Power Monitoring System Market Product Developments
Recent product innovations have focused on enhancing system functionalities, improving data analytics capabilities, and integrating advanced communication protocols. New products incorporate IoT sensors, cloud-based platforms, and advanced algorithms to deliver real-time monitoring, predictive maintenance, and improved energy management capabilities. These developments cater to the growing demand for sophisticated power monitoring solutions that enable increased efficiency and optimized energy consumption. Competitive advantages are achieved through superior data analytics, user-friendly interfaces, and seamless integration with existing systems.
Key Drivers of Power Monitoring System Market Growth
The Power Monitoring System market is fueled by several key factors: Firstly, the increasing need for energy efficiency and cost optimization is driving demand. Secondly, technological advancements such as the Internet of Things (IoT), Artificial Intelligence (AI), and Big Data analytics are enhancing monitoring capabilities and providing valuable insights. Finally, supportive government policies and regulations promoting renewable energy adoption and smart grid development contribute significantly to market growth.
Challenges in the Power Monitoring System Market
The Power Monitoring System market faces certain challenges, including the high initial investment costs associated with implementing these systems, potential cybersecurity risks related to data transmission and storage, and the complexities of integrating these systems with existing infrastructure. Supply chain disruptions can also impact the availability and pricing of components, while intense competition among established players and emerging entrants create pricing pressures.
Emerging Opportunities in Power Monitoring System Market
Emerging opportunities include the expansion into developing economies with burgeoning energy demands, the integration of power monitoring systems with renewable energy sources like solar and wind, and the development of advanced predictive maintenance capabilities to reduce downtime and operational costs. Strategic partnerships and collaborations among technology providers and energy companies can unlock new market segments and drive innovation.
Leading Players in the Power Monitoring System Market Sector
- ABB Ltd (ABB)
- Eaton Corporation Inc (Eaton)
- Emerson Electric Co (Emerson)
- Mitsubishi Electric Corporation (Mitsubishi Electric)
- Siemens AG (Siemens)
- Schneider Electric SE (Schneider Electric)
- Fuji Electric FA Components & Systems Co Ltd
- Fluke Corporation (Fluke)
- Rockwell Automation Inc (Rockwell Automation)
- Yokogawa Electric Corporation (Yokogawa)
- General Electric Company (GE)
Key Milestones in Power Monitoring System Market Industry
- 2020: ABB launches a new line of smart power meters with advanced communication capabilities.
- 2021: Siemens and Schneider Electric form a strategic partnership to develop integrated energy management solutions.
- 2022: Eaton Corporation acquires a smaller power monitoring systems company, expanding its product portfolio.
- 2023: Significant investments are made in R&D to improve the AI and machine learning capabilities of power monitoring systems by multiple players.
- 2024: Several new product launches showcasing enhanced cybersecurity features and cloud-based data analytics.
Strategic Outlook for Power Monitoring System Market Market
The Power Monitoring System market is poised for significant growth driven by the increasing adoption of smart grids, the rising demand for energy efficiency, and the advancements in power electronics and sensor technologies. Strategic partnerships, mergers and acquisitions, and focused investments in R&D will continue to shape the market landscape, while proactive measures to address cybersecurity concerns and ensure seamless integration with existing infrastructure will be critical for success. The future holds significant potential for growth, particularly in developing economies and emerging applications within diverse sectors.
Power Monitoring System Market Segmentation
-
1. End-User
- 1.1. Commercial and Industrial
- 1.2. Utilities
- 1.3. Others
Power Monitoring System Market Segmentation By Geography
- 1. North America
- 2. Europe
- 3. Asia Pacific
- 4. South America
- 5. Middle East and Africa
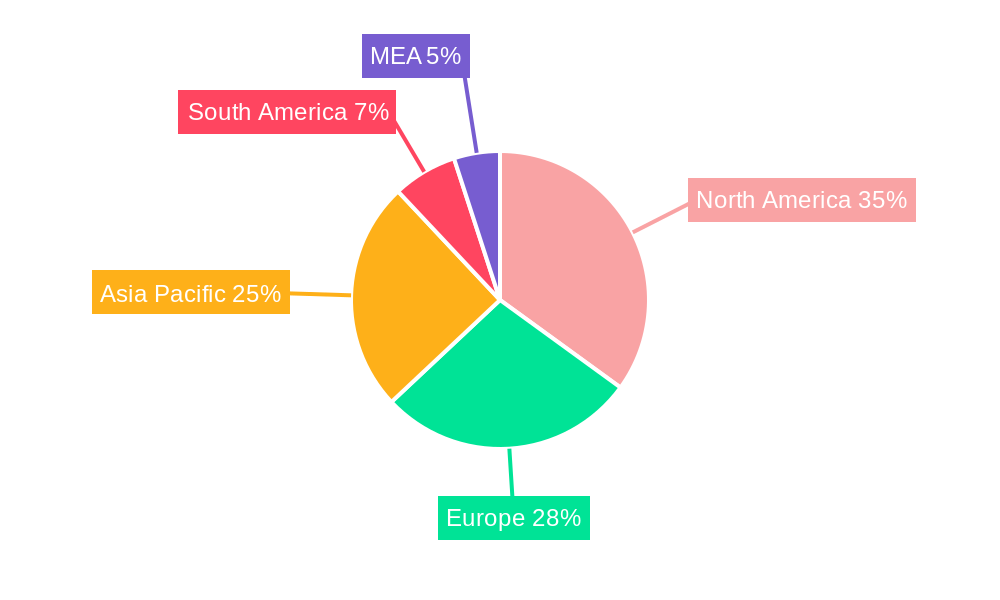
Power Monitoring System Market Regional Market Share
Geographic Coverage of Power Monitoring System Market
Power Monitoring System Market REPORT HIGHLIGHTS
| Aspects | Details |
|---|---|
| Study Period | 2020-2034 |
| Base Year | 2025 |
| Estimated Year | 2026 |
| Forecast Period | 2026-2034 |
| Historical Period | 2020-2025 |
| Growth Rate | CAGR of > 5.80% from 2020-2034 |
| Segmentation |
|
Table of Contents
- 1. Introduction
- 1.1. Research Scope
- 1.2. Market Segmentation
- 1.3. Research Objective
- 1.4. Definitions and Assumptions
- 2. Executive Summary
- 2.1. Market Snapshot
- 3. Market Dynamics
- 3.1. Market Drivers
- 3.2. Market Restrains
- 3.3. Market Trends
- 3.4. Market Opportunities
- 4. Market Factor Analysis
- 4.1. Porters Five Forces
- 4.1.1. Bargaining Power of Suppliers
- 4.1.2. Bargaining Power of Buyers
- 4.1.3. Threat of New Entrants
- 4.1.4. Threat of Substitutes
- 4.1.5. Competitive Rivalry
- 4.2. PESTEL analysis
- 4.3. BCG Analysis
- 4.3.1. Stars (High Growth, High Market Share)
- 4.3.2. Cash Cows (Low Growth, High Market Share)
- 4.3.3. Question Mark (High Growth, Low Market Share)
- 4.3.4. Dogs (Low Growth, Low Market Share)
- 4.4. Ansoff Matrix Analysis
- 4.5. Supply Chain Analysis
- 4.6. Regulatory Landscape
- 4.7. Current Market Potential and Opportunity Assessment (TAM–SAM–SOM Framework)
- 4.8. MDP Analyst Note
- 4.1. Porters Five Forces
- 5. Market Analysis, Insights and Forecast 2021-2033
- 5.1. Market Analysis, Insights and Forecast - by End-User
- 5.1.1. Commercial and Industrial
- 5.1.2. Utilities
- 5.1.3. Others
- 5.2. Market Analysis, Insights and Forecast - by Region
- 5.2.1. North America
- 5.2.2. Europe
- 5.2.3. Asia Pacific
- 5.2.4. South America
- 5.2.5. Middle East and Africa
- 5.1. Market Analysis, Insights and Forecast - by End-User
- 6. Global Power Monitoring System Market Analysis, Insights and Forecast, 2021-2033
- 6.1. Market Analysis, Insights and Forecast - by End-User
- 6.1.1. Commercial and Industrial
- 6.1.2. Utilities
- 6.1.3. Others
- 6.1. Market Analysis, Insights and Forecast - by End-User
- 7. North America Power Monitoring System Market Analysis, Insights and Forecast, 2020-2032
- 7.1. Market Analysis, Insights and Forecast - by End-User
- 7.1.1. Commercial and Industrial
- 7.1.2. Utilities
- 7.1.3. Others
- 7.1. Market Analysis, Insights and Forecast - by End-User
- 8. Europe Power Monitoring System Market Analysis, Insights and Forecast, 2020-2032
- 8.1. Market Analysis, Insights and Forecast - by End-User
- 8.1.1. Commercial and Industrial
- 8.1.2. Utilities
- 8.1.3. Others
- 8.1. Market Analysis, Insights and Forecast - by End-User
- 9. Asia Pacific Power Monitoring System Market Analysis, Insights and Forecast, 2020-2032
- 9.1. Market Analysis, Insights and Forecast - by End-User
- 9.1.1. Commercial and Industrial
- 9.1.2. Utilities
- 9.1.3. Others
- 9.1. Market Analysis, Insights and Forecast - by End-User
- 10. South America Power Monitoring System Market Analysis, Insights and Forecast, 2020-2032
- 10.1. Market Analysis, Insights and Forecast - by End-User
- 10.1.1. Commercial and Industrial
- 10.1.2. Utilities
- 10.1.3. Others
- 10.1. Market Analysis, Insights and Forecast - by End-User
- 11. Middle East and Africa Power Monitoring System Market Analysis, Insights and Forecast, 2020-2032
- 11.1. Market Analysis, Insights and Forecast - by End-User
- 11.1.1. Commercial and Industrial
- 11.1.2. Utilities
- 11.1.3. Others
- 11.1. Market Analysis, Insights and Forecast - by End-User
- 12. Competitive Analysis
- 12.1. Company Profiles
- 12.1.1 ABB Ltd
- 12.1.1.1. Company Overview
- 12.1.1.2. Products
- 12.1.1.3. Company Financials
- 12.1.1.4. SWOT Analysis
- 12.1.2 Eaton Corporation Inc
- 12.1.2.1. Company Overview
- 12.1.2.2. Products
- 12.1.2.3. Company Financials
- 12.1.2.4. SWOT Analysis
- 12.1.3 Emerson Electric Co
- 12.1.3.1. Company Overview
- 12.1.3.2. Products
- 12.1.3.3. Company Financials
- 12.1.3.4. SWOT Analysis
- 12.1.4 Mitsubishi Electric Corporation
- 12.1.4.1. Company Overview
- 12.1.4.2. Products
- 12.1.4.3. Company Financials
- 12.1.4.4. SWOT Analysis
- 12.1.5 Siemens AG
- 12.1.5.1. Company Overview
- 12.1.5.2. Products
- 12.1.5.3. Company Financials
- 12.1.5.4. SWOT Analysis
- 12.1.6 Schneider Electric SE
- 12.1.6.1. Company Overview
- 12.1.6.2. Products
- 12.1.6.3. Company Financials
- 12.1.6.4. SWOT Analysis
- 12.1.7 Fuji Electric FA Components & Systems Co Ltd *List Not Exhaustive
- 12.1.7.1. Company Overview
- 12.1.7.2. Products
- 12.1.7.3. Company Financials
- 12.1.7.4. SWOT Analysis
- 12.1.8 Fluke Corporation
- 12.1.8.1. Company Overview
- 12.1.8.2. Products
- 12.1.8.3. Company Financials
- 12.1.8.4. SWOT Analysis
- 12.1.9 Rockwell Automation Inc
- 12.1.9.1. Company Overview
- 12.1.9.2. Products
- 12.1.9.3. Company Financials
- 12.1.9.4. SWOT Analysis
- 12.1.10 Yokogawa Electric Corporation
- 12.1.10.1. Company Overview
- 12.1.10.2. Products
- 12.1.10.3. Company Financials
- 12.1.10.4. SWOT Analysis
- 12.1.11 General Electric Company
- 12.1.11.1. Company Overview
- 12.1.11.2. Products
- 12.1.11.3. Company Financials
- 12.1.11.4. SWOT Analysis
- 12.1.1 ABB Ltd
- 12.2. Market Entropy
- 12.2.1 Company's Key Areas Served
- 12.2.2 Recent Developments
- 12.3. Company Market Share Analysis 2025
- 12.3.1 Top 5 Companies Market Share Analysis
- 12.3.2 Top 3 Companies Market Share Analysis
- 12.4. List of Potential Customers
- 13. Research Methodology
List of Figures
- Figure 1: Global Power Monitoring System Market Revenue Breakdown (Billion, %) by Region 2025 & 2033
- Figure 2: North America Power Monitoring System Market Revenue (Billion), by End-User 2025 & 2033
- Figure 3: North America Power Monitoring System Market Revenue Share (%), by End-User 2025 & 2033
- Figure 4: North America Power Monitoring System Market Revenue (Billion), by Country 2025 & 2033
- Figure 5: North America Power Monitoring System Market Revenue Share (%), by Country 2025 & 2033
- Figure 6: Europe Power Monitoring System Market Revenue (Billion), by End-User 2025 & 2033
- Figure 7: Europe Power Monitoring System Market Revenue Share (%), by End-User 2025 & 2033
- Figure 8: Europe Power Monitoring System Market Revenue (Billion), by Country 2025 & 2033
- Figure 9: Europe Power Monitoring System Market Revenue Share (%), by Country 2025 & 2033
- Figure 10: Asia Pacific Power Monitoring System Market Revenue (Billion), by End-User 2025 & 2033
- Figure 11: Asia Pacific Power Monitoring System Market Revenue Share (%), by End-User 2025 & 2033
- Figure 12: Asia Pacific Power Monitoring System Market Revenue (Billion), by Country 2025 & 2033
- Figure 13: Asia Pacific Power Monitoring System Market Revenue Share (%), by Country 2025 & 2033
- Figure 14: South America Power Monitoring System Market Revenue (Billion), by End-User 2025 & 2033
- Figure 15: South America Power Monitoring System Market Revenue Share (%), by End-User 2025 & 2033
- Figure 16: South America Power Monitoring System Market Revenue (Billion), by Country 2025 & 2033
- Figure 17: South America Power Monitoring System Market Revenue Share (%), by Country 2025 & 2033
- Figure 18: Middle East and Africa Power Monitoring System Market Revenue (Billion), by End-User 2025 & 2033
- Figure 19: Middle East and Africa Power Monitoring System Market Revenue Share (%), by End-User 2025 & 2033
- Figure 20: Middle East and Africa Power Monitoring System Market Revenue (Billion), by Country 2025 & 2033
- Figure 21: Middle East and Africa Power Monitoring System Market Revenue Share (%), by Country 2025 & 2033
List of Tables
- Table 1: Global Power Monitoring System Market Revenue Billion Forecast, by End-User 2020 & 2033
- Table 2: Global Power Monitoring System Market Revenue Billion Forecast, by Region 2020 & 2033
- Table 3: Global Power Monitoring System Market Revenue Billion Forecast, by End-User 2020 & 2033
- Table 4: Global Power Monitoring System Market Revenue Billion Forecast, by Country 2020 & 2033
- Table 5: Global Power Monitoring System Market Revenue Billion Forecast, by End-User 2020 & 2033
- Table 6: Global Power Monitoring System Market Revenue Billion Forecast, by Country 2020 & 2033
- Table 7: Global Power Monitoring System Market Revenue Billion Forecast, by End-User 2020 & 2033
- Table 8: Global Power Monitoring System Market Revenue Billion Forecast, by Country 2020 & 2033
- Table 9: Global Power Monitoring System Market Revenue Billion Forecast, by End-User 2020 & 2033
- Table 10: Global Power Monitoring System Market Revenue Billion Forecast, by Country 2020 & 2033
- Table 11: Global Power Monitoring System Market Revenue Billion Forecast, by End-User 2020 & 2033
- Table 12: Global Power Monitoring System Market Revenue Billion Forecast, by Country 2020 & 2033
Frequently Asked Questions
1. What is the projected Compound Annual Growth Rate (CAGR) of the Power Monitoring System Market?
The projected CAGR is approximately > 5.80%.
2. Which companies are prominent players in the Power Monitoring System Market?
Key companies in the market include ABB Ltd, Eaton Corporation Inc, Emerson Electric Co, Mitsubishi Electric Corporation, Siemens AG, Schneider Electric SE, Fuji Electric FA Components & Systems Co Ltd *List Not Exhaustive, Fluke Corporation, Rockwell Automation Inc, Yokogawa Electric Corporation, General Electric Company.
3. What are the main segments of the Power Monitoring System Market?
The market segments include End-User.
4. Can you provide details about the market size?
The market size is estimated to be USD 4.52 Billion as of 2022.
5. What are some drivers contributing to market growth?
4.; Growing Energy Demand4.; Renewable Energy Transition.
6. What are the notable trends driving market growth?
Commercial and Industrial Segment to Witness Significant Growth.
7. Are there any restraints impacting market growth?
4.; Phasing out of Conventional Sources of Electricity.
8. Can you provide examples of recent developments in the market?
New product launches: Major players are introducing innovative products with advanced features and functionality.
9. What pricing options are available for accessing the report?
Pricing options include single-user, multi-user, and enterprise licenses priced at USD 4750, USD 5250, and USD 8750 respectively.
10. Is the market size provided in terms of value or volume?
The market size is provided in terms of value, measured in Billion.
11. Are there any specific market keywords associated with the report?
Yes, the market keyword associated with the report is "Power Monitoring System Market," which aids in identifying and referencing the specific market segment covered.
12. How do I determine which pricing option suits my needs best?
The pricing options vary based on user requirements and access needs. Individual users may opt for single-user licenses, while businesses requiring broader access may choose multi-user or enterprise licenses for cost-effective access to the report.
13. Are there any additional resources or data provided in the Power Monitoring System Market report?
While the report offers comprehensive insights, it's advisable to review the specific contents or supplementary materials provided to ascertain if additional resources or data are available.
14. How can I stay updated on further developments or reports in the Power Monitoring System Market?
To stay informed about further developments, trends, and reports in the Power Monitoring System Market, consider subscribing to industry newsletters, following relevant companies and organizations, or regularly checking reputable industry news sources and publications.
Methodology
Step 1 - Identification of Relevant Samples Size from Population Database


Step 2 - Approaches for Defining Global Market Size (Value, Volume* & Price*)

Note*: In applicable scenarios
Step 3 - Data Sources
Primary Research
- Web Analytics
- Survey Reports
- Research Institute
- Latest Research Reports
- Opinion Leaders
Secondary Research
- Annual Reports
- White Paper
- Latest Press Release
- Industry Association
- Paid Database
- Investor Presentations

Step 4 - Data Triangulation
Involves using different sources of information in order to increase the validity of a study
These sources are likely to be stakeholders in a program - participants, other researchers, program staff, other community members, and so on.
Then we put all data in single framework & apply various statistical tools to find out the dynamic on the market.
During the analysis stage, feedback from the stakeholder groups would be compared to determine areas of agreement as well as areas of divergence