

Key Insights
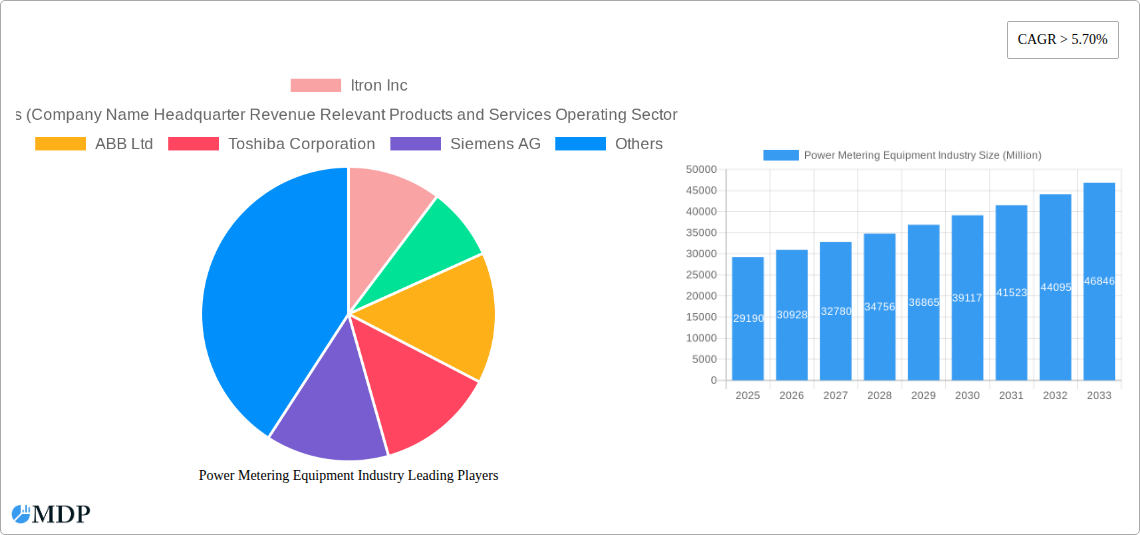
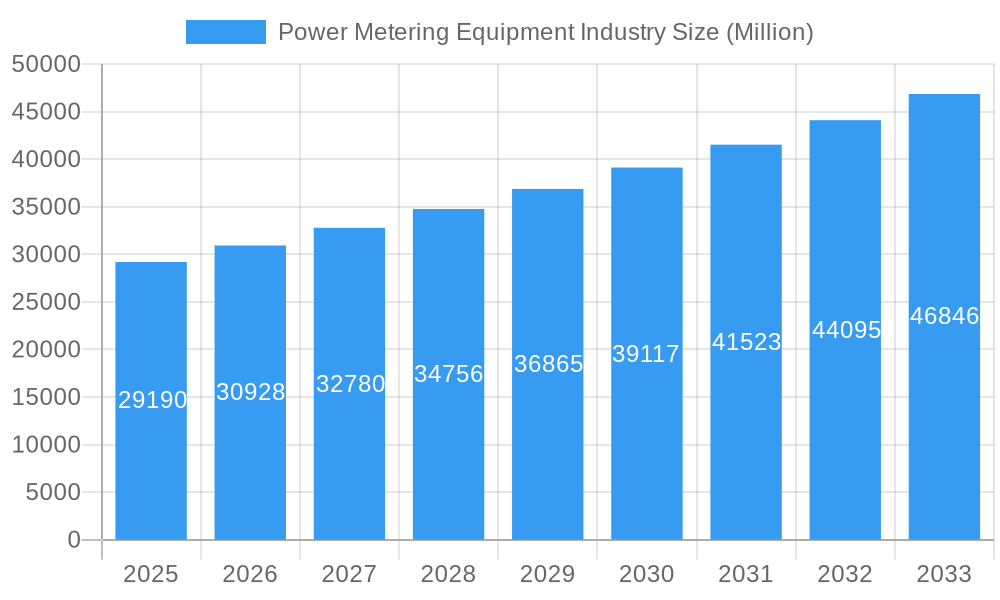
The global power metering equipment market, valued at $29.19 billion in 2025, is projected to experience robust growth, exhibiting a Compound Annual Growth Rate (CAGR) exceeding 5.70% from 2025 to 2033. This expansion is driven by several key factors. The increasing demand for reliable and efficient energy management solutions across residential, commercial, and industrial sectors is a primary driver. The global shift towards smart grids and the integration of advanced metering infrastructure (AMI) are significantly contributing to market growth. Governments worldwide are actively promoting energy efficiency initiatives and smart metering deployments, further fueling market expansion. The rising adoption of renewable energy sources also necessitates sophisticated metering solutions to effectively monitor and manage distributed generation. Technological advancements, particularly in the development of smart meters with enhanced data analytics capabilities, are creating new opportunities within the market. Competition among leading players like Itron, Honeywell, ABB, Siemens, and others is fostering innovation and driving down costs, making advanced metering technologies more accessible.
Power Metering Equipment Industry Market Size (In Billion)
Significant segmental growth is anticipated within the smart meter technology segment, driven by its superior capabilities in data acquisition, remote monitoring, and enhanced grid management. While the analog and digital meter segments will continue to maintain a presence, particularly in less developed regions, their market share is expected to gradually decline as smart meter adoption accelerates. Regionally, North America and Europe are currently leading the market due to established smart grid infrastructure and stringent energy regulations. However, substantial growth potential exists within Asia-Pacific, driven by rapid urbanization and industrialization, creating opportunities for market expansion in developing economies. While challenges such as high initial investment costs for smart meter deployments and cybersecurity concerns related to data security persist, the long-term benefits of improved energy efficiency and grid management are expected to outweigh these constraints, ensuring continued market expansion throughout the forecast period.
Power Metering Equipment Industry Company Market Share
Power Metering Equipment Industry Market Report: 2019-2033
This comprehensive report provides an in-depth analysis of the global power metering equipment industry, covering market dynamics, leading players, technological advancements, and future growth prospects. The study period spans from 2019 to 2033, with 2025 serving as both the base and estimated year. This report is essential for industry stakeholders, investors, and strategic decision-makers seeking actionable insights into this rapidly evolving sector. The market is projected to reach xx Million by 2033.
Power Metering Equipment Industry Market Dynamics & Concentration
The power metering equipment market is characterized by a moderately concentrated landscape, with a few major players holding significant market share. Market concentration is influenced by factors such as technological innovation, stringent regulatory frameworks, the emergence of product substitutes (like smart meters), evolving end-user preferences (a shift toward smart grids and energy efficiency), and ongoing mergers and acquisitions (M&A) activity. Over the historical period (2019-2024), the industry witnessed approximately xx M&A deals, consolidating market power and driving innovation. The market share of the top 5 players is estimated at xx%, indicating room for growth for both established and emerging players. Key innovation drivers include the rising adoption of smart meters, advancements in communication technologies (e.g., LTE-M, NB-IoT), and the growing need for precise energy monitoring and management. Regulatory frameworks, particularly those focusing on renewable energy integration and grid modernization, play a crucial role in shaping market growth.
Power Metering Equipment Industry Industry Trends & Analysis
The global power metering equipment market is experiencing robust growth, driven by several key factors. The increasing demand for improved grid management, coupled with the escalating adoption of renewable energy sources, is fueling the need for accurate and efficient metering solutions. Technological disruptions, particularly the widespread adoption of smart meters, are transforming the industry landscape. Smart meters offer advanced functionalities, including real-time data monitoring, remote meter reading, and improved billing accuracy, leading to increased operational efficiency and reduced energy losses. Consumer preferences are shifting towards energy-efficient solutions, further boosting demand for smart meters and other advanced metering technologies. The CAGR for the power metering equipment market during the forecast period (2025-2033) is estimated to be xx%, indicating a significant growth trajectory. Market penetration of smart meters is expected to reach xx% by 2033, signifying a considerable shift from traditional analog meters. Competitive dynamics are characterized by ongoing innovation, strategic partnerships, and intense competition among established players and emerging technology providers.
Leading Markets & Segments in Power Metering Equipment Industry
The Industrial segment currently dominates the power metering equipment market, driven by the high energy consumption and complex metering requirements of industrial facilities. However, the Residential and Commercial segments are expected to experience significant growth in the coming years due to government initiatives promoting energy efficiency and smart grid development. Geographically, North America and Europe currently hold a significant market share. Key drivers for market dominance include:
- Strong regulatory frameworks: Governments in these regions are actively promoting the adoption of smart meters through various initiatives and incentives.
- Well-established grid infrastructure: This facilitates the seamless integration of smart meters and other advanced metering technologies.
- High consumer awareness: Greater awareness regarding energy efficiency and sustainability fosters higher demand for advanced metering solutions.
However, Asia-Pacific is poised for rapid growth, driven by large-scale infrastructure development projects and increasing government support for smart grid deployment.
Power Metering Equipment Industry Product Developments
Recent product innovations focus on enhancing the functionalities of smart meters, including improved communication capabilities, advanced data analytics, and enhanced security features. New applications of power metering equipment extend beyond traditional electricity metering to encompass other utilities like water and gas, supporting integrated smart city infrastructure development. The key competitive advantage lies in providing comprehensive solutions that combine advanced metering infrastructure (AMI) with data analytics platforms, offering end-users valuable insights into their energy consumption patterns. This focus on data-driven solutions is a core technological trend shaping the industry’s evolution.
Key Drivers of Power Metering Equipment Industry Growth
The power metering equipment market's growth is fueled by several key factors:
- Government initiatives: Programs like the Smart Meter National Program (SMNP) in India are driving substantial demand for smart meters.
- Technological advancements: The development of more efficient and cost-effective smart meters and improved data analytics capabilities are enhancing market appeal.
- Growing energy awareness: Increasing consumer and corporate awareness of energy conservation is pushing the adoption of smart metering solutions.
Challenges in the Power Metering Equipment Industry Market
The industry faces challenges, including:
- High initial investment costs: The implementation of smart metering infrastructure requires substantial upfront investment, posing a barrier for some utilities.
- Cybersecurity concerns: The increased connectivity of smart meters raises concerns about data security and vulnerability to cyberattacks.
- Interoperability issues: Ensuring seamless communication and data exchange between different metering systems remains a challenge. This affects the estimated xx Million market losses annually.
Emerging Opportunities in Power Metering Equipment Industry
Significant long-term growth opportunities exist in emerging markets experiencing rapid urbanization and industrialization, which need to upgrade their aging power infrastructure. Strategic partnerships between power metering equipment manufacturers and data analytics companies are generating new market entries and opportunities. The development of advanced metering solutions integrating renewable energy sources and supporting microgrids promises to unlock considerable growth potential.
Leading Players in the Power Metering Equipment Industry Sector
- Itron Inc
- Honeywell International
- ABB Ltd
- Toshiba Corporation
- Siemens AG
- Schneider Electric SE
- Kamstrup AS
- Eaton Corporation PLC
- Aclara Technologies LLC
- General Electric Company
Key Milestones in Power Metering Equipment Industry Industry
- March 2024: The Government of India launched the Smart Meter National Program (SMNP), aiming to replace 250 million conventional meters with smart meters, representing a significant market expansion opportunity.
- February 2024: The Enre regulator in Buenos Aires established a public-private working group to accelerate smart meter deployment, highlighting the growing global interest in AMI solutions.
Strategic Outlook for Power Metering Equipment Industry Market
The future of the power metering equipment market is bright, driven by ongoing technological advancements, increasing regulatory support, and growing consumer demand for energy efficiency. Strategic opportunities lie in developing innovative, cost-effective smart metering solutions tailored to the specific needs of different market segments. Expanding into emerging markets and forging strategic partnerships with utility companies and data analytics providers will be crucial for securing long-term growth. The market's potential for expansion is considerable, with significant growth predicted across all segments throughout the forecast period.
Power Metering Equipment Industry Segmentation
-
1. End User
- 1.1. Residential
- 1.2. Commercial
- 1.3. Industrial
-
2. Technology
- 2.1. Analog Meters
- 2.2. Digital Meters
- 2.3. Smart Meters
Power Metering Equipment Industry Segmentation By Geography
-
1. North America
- 1.1. United States
- 1.2. Canada
- 1.3. Rest of North America
-
2. Asia Pacific
- 2.1. China
- 2.2. India
- 2.3. Japan
- 2.4. South Korea
- 2.5. Malaysia
- 2.6. Thailand
- 2.7. Indonesia
- 2.8. Vietnam
- 2.9. Rest of Asia Pacific
-
3. Europe
- 3.1. Germany
- 3.2. France
- 3.3. United Kingdom
- 3.4. Spain
- 3.5. Nordic
- 3.6. Turkey
- 3.7. Russia
- 3.8. Rest of Europe
-
4. South America
- 4.1. Brazil
- 4.2. Argentina
- 4.3. Colombia
- 4.4. Rest of South America
-
5. Middle East and Africa
- 5.1. Saudi Arabia
- 5.2. United Arab Emirates
- 5.3. Qatar
- 5.4. South Africa
- 5.5. Nigeria
- 5.6. Oman
- 5.7. Egypt
- 5.8. Algeria
- 5.9. Rest of Middle East and Africa
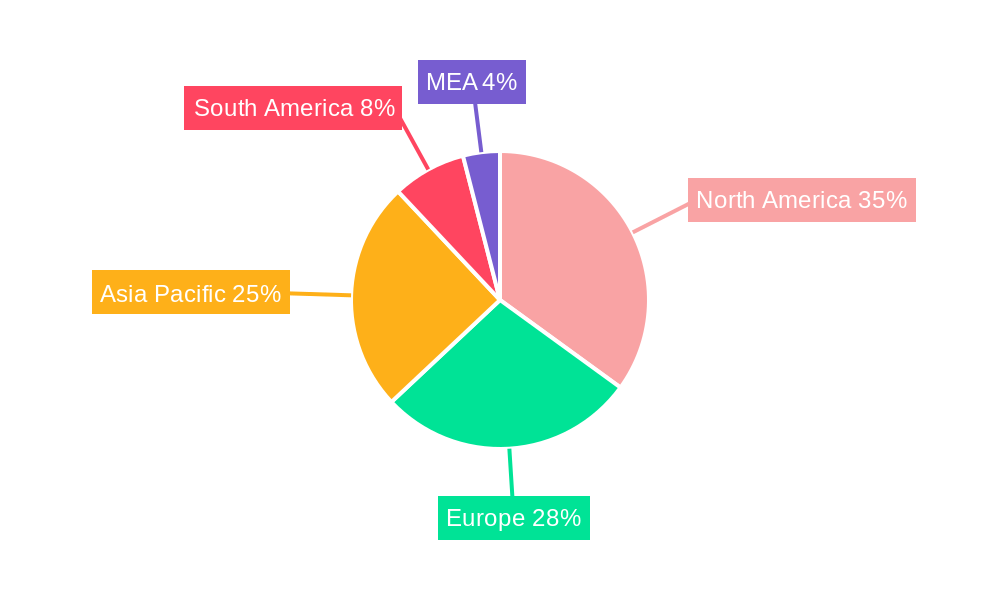
Power Metering Equipment Industry Regional Market Share
Geographic Coverage of Power Metering Equipment Industry
Power Metering Equipment Industry REPORT HIGHLIGHTS
| Aspects | Details |
|---|---|
| Study Period | 2020-2034 |
| Base Year | 2025 |
| Estimated Year | 2026 |
| Forecast Period | 2026-2034 |
| Historical Period | 2020-2025 |
| Growth Rate | CAGR of > 5.70% from 2020-2034 |
| Segmentation |
|
Table of Contents
- 1. Introduction
- 1.1. Research Scope
- 1.2. Market Segmentation
- 1.3. Research Objective
- 1.4. Definitions and Assumptions
- 2. Executive Summary
- 2.1. Market Snapshot
- 3. Market Dynamics
- 3.1. Market Drivers
- 3.2. Market Restrains
- 3.3. Market Trends
- 3.4. Market Opportunities
- 4. Market Factor Analysis
- 4.1. Porters Five Forces
- 4.1.1. Bargaining Power of Suppliers
- 4.1.2. Bargaining Power of Buyers
- 4.1.3. Threat of New Entrants
- 4.1.4. Threat of Substitutes
- 4.1.5. Competitive Rivalry
- 4.2. PESTEL analysis
- 4.3. BCG Analysis
- 4.3.1. Stars (High Growth, High Market Share)
- 4.3.2. Cash Cows (Low Growth, High Market Share)
- 4.3.3. Question Mark (High Growth, Low Market Share)
- 4.3.4. Dogs (Low Growth, Low Market Share)
- 4.4. Ansoff Matrix Analysis
- 4.5. Supply Chain Analysis
- 4.6. Regulatory Landscape
- 4.7. Current Market Potential and Opportunity Assessment (TAM–SAM–SOM Framework)
- 4.8. MDP Analyst Note
- 4.1. Porters Five Forces
- 5. Market Analysis, Insights and Forecast 2021-2033
- 5.1. Market Analysis, Insights and Forecast - by End User
- 5.1.1. Residential
- 5.1.2. Commercial
- 5.1.3. Industrial
- 5.2. Market Analysis, Insights and Forecast - by Technology
- 5.2.1. Analog Meters
- 5.2.2. Digital Meters
- 5.2.3. Smart Meters
- 5.3. Market Analysis, Insights and Forecast - by Region
- 5.3.1. North America
- 5.3.2. Asia Pacific
- 5.3.3. Europe
- 5.3.4. South America
- 5.3.5. Middle East and Africa
- 5.1. Market Analysis, Insights and Forecast - by End User
- 6. Global Power Metering Equipment Industry Analysis, Insights and Forecast, 2021-2033
- 6.1. Market Analysis, Insights and Forecast - by End User
- 6.1.1. Residential
- 6.1.2. Commercial
- 6.1.3. Industrial
- 6.2. Market Analysis, Insights and Forecast - by Technology
- 6.2.1. Analog Meters
- 6.2.2. Digital Meters
- 6.2.3. Smart Meters
- 6.1. Market Analysis, Insights and Forecast - by End User
- 7. North America Power Metering Equipment Industry Analysis, Insights and Forecast, 2020-2032
- 7.1. Market Analysis, Insights and Forecast - by End User
- 7.1.1. Residential
- 7.1.2. Commercial
- 7.1.3. Industrial
- 7.2. Market Analysis, Insights and Forecast - by Technology
- 7.2.1. Analog Meters
- 7.2.2. Digital Meters
- 7.2.3. Smart Meters
- 7.1. Market Analysis, Insights and Forecast - by End User
- 8. Asia Pacific Power Metering Equipment Industry Analysis, Insights and Forecast, 2020-2032
- 8.1. Market Analysis, Insights and Forecast - by End User
- 8.1.1. Residential
- 8.1.2. Commercial
- 8.1.3. Industrial
- 8.2. Market Analysis, Insights and Forecast - by Technology
- 8.2.1. Analog Meters
- 8.2.2. Digital Meters
- 8.2.3. Smart Meters
- 8.1. Market Analysis, Insights and Forecast - by End User
- 9. Europe Power Metering Equipment Industry Analysis, Insights and Forecast, 2020-2032
- 9.1. Market Analysis, Insights and Forecast - by End User
- 9.1.1. Residential
- 9.1.2. Commercial
- 9.1.3. Industrial
- 9.2. Market Analysis, Insights and Forecast - by Technology
- 9.2.1. Analog Meters
- 9.2.2. Digital Meters
- 9.2.3. Smart Meters
- 9.1. Market Analysis, Insights and Forecast - by End User
- 10. South America Power Metering Equipment Industry Analysis, Insights and Forecast, 2020-2032
- 10.1. Market Analysis, Insights and Forecast - by End User
- 10.1.1. Residential
- 10.1.2. Commercial
- 10.1.3. Industrial
- 10.2. Market Analysis, Insights and Forecast - by Technology
- 10.2.1. Analog Meters
- 10.2.2. Digital Meters
- 10.2.3. Smart Meters
- 10.1. Market Analysis, Insights and Forecast - by End User
- 11. Middle East and Africa Power Metering Equipment Industry Analysis, Insights and Forecast, 2020-2032
- 11.1. Market Analysis, Insights and Forecast - by End User
- 11.1.1. Residential
- 11.1.2. Commercial
- 11.1.3. Industrial
- 11.2. Market Analysis, Insights and Forecast - by Technology
- 11.2.1. Analog Meters
- 11.2.2. Digital Meters
- 11.2.3. Smart Meters
- 11.1. Market Analysis, Insights and Forecast - by End User
- 12. Competitive Analysis
- 12.1. Company Profiles
- 12.1.1 Itron Inc
- 12.1.1.1. Company Overview
- 12.1.1.2. Products
- 12.1.1.3. Company Financials
- 12.1.1.4. SWOT Analysis
- 12.1.2 Honeywell International*List Not Exhaustive 6 4 List of Other Prominent Companies (Company Name Headquarter Revenue Relevant Products and Services Operating Sector Recent Trends and Technology or Projects Contact Details etc )6 5 Market Ranking Analysi
- 12.1.2.1. Company Overview
- 12.1.2.2. Products
- 12.1.2.3. Company Financials
- 12.1.2.4. SWOT Analysis
- 12.1.3 ABB Ltd
- 12.1.3.1. Company Overview
- 12.1.3.2. Products
- 12.1.3.3. Company Financials
- 12.1.3.4. SWOT Analysis
- 12.1.4 Toshiba Corporation
- 12.1.4.1. Company Overview
- 12.1.4.2. Products
- 12.1.4.3. Company Financials
- 12.1.4.4. SWOT Analysis
- 12.1.5 Siemens AG
- 12.1.5.1. Company Overview
- 12.1.5.2. Products
- 12.1.5.3. Company Financials
- 12.1.5.4. SWOT Analysis
- 12.1.6 Schneider Electric SE
- 12.1.6.1. Company Overview
- 12.1.6.2. Products
- 12.1.6.3. Company Financials
- 12.1.6.4. SWOT Analysis
- 12.1.7 Kamstrup AS
- 12.1.7.1. Company Overview
- 12.1.7.2. Products
- 12.1.7.3. Company Financials
- 12.1.7.4. SWOT Analysis
- 12.1.8 Eaton Corporation PLC
- 12.1.8.1. Company Overview
- 12.1.8.2. Products
- 12.1.8.3. Company Financials
- 12.1.8.4. SWOT Analysis
- 12.1.9 Aclara Technologies LLC
- 12.1.9.1. Company Overview
- 12.1.9.2. Products
- 12.1.9.3. Company Financials
- 12.1.9.4. SWOT Analysis
- 12.1.10 General Electric Company
- 12.1.10.1. Company Overview
- 12.1.10.2. Products
- 12.1.10.3. Company Financials
- 12.1.10.4. SWOT Analysis
- 12.1.1 Itron Inc
- 12.2. Market Entropy
- 12.2.1 Company's Key Areas Served
- 12.2.2 Recent Developments
- 12.3. Company Market Share Analysis 2025
- 12.3.1 Top 5 Companies Market Share Analysis
- 12.3.2 Top 3 Companies Market Share Analysis
- 12.4. List of Potential Customers
- 13. Research Methodology
List of Figures
- Figure 1: Global Power Metering Equipment Industry Revenue Breakdown (Million, %) by Region 2025 & 2033
- Figure 2: North America Power Metering Equipment Industry Revenue (Million), by End User 2025 & 2033
- Figure 3: North America Power Metering Equipment Industry Revenue Share (%), by End User 2025 & 2033
- Figure 4: North America Power Metering Equipment Industry Revenue (Million), by Technology 2025 & 2033
- Figure 5: North America Power Metering Equipment Industry Revenue Share (%), by Technology 2025 & 2033
- Figure 6: North America Power Metering Equipment Industry Revenue (Million), by Country 2025 & 2033
- Figure 7: North America Power Metering Equipment Industry Revenue Share (%), by Country 2025 & 2033
- Figure 8: Asia Pacific Power Metering Equipment Industry Revenue (Million), by End User 2025 & 2033
- Figure 9: Asia Pacific Power Metering Equipment Industry Revenue Share (%), by End User 2025 & 2033
- Figure 10: Asia Pacific Power Metering Equipment Industry Revenue (Million), by Technology 2025 & 2033
- Figure 11: Asia Pacific Power Metering Equipment Industry Revenue Share (%), by Technology 2025 & 2033
- Figure 12: Asia Pacific Power Metering Equipment Industry Revenue (Million), by Country 2025 & 2033
- Figure 13: Asia Pacific Power Metering Equipment Industry Revenue Share (%), by Country 2025 & 2033
- Figure 14: Europe Power Metering Equipment Industry Revenue (Million), by End User 2025 & 2033
- Figure 15: Europe Power Metering Equipment Industry Revenue Share (%), by End User 2025 & 2033
- Figure 16: Europe Power Metering Equipment Industry Revenue (Million), by Technology 2025 & 2033
- Figure 17: Europe Power Metering Equipment Industry Revenue Share (%), by Technology 2025 & 2033
- Figure 18: Europe Power Metering Equipment Industry Revenue (Million), by Country 2025 & 2033
- Figure 19: Europe Power Metering Equipment Industry Revenue Share (%), by Country 2025 & 2033
- Figure 20: South America Power Metering Equipment Industry Revenue (Million), by End User 2025 & 2033
- Figure 21: South America Power Metering Equipment Industry Revenue Share (%), by End User 2025 & 2033
- Figure 22: South America Power Metering Equipment Industry Revenue (Million), by Technology 2025 & 2033
- Figure 23: South America Power Metering Equipment Industry Revenue Share (%), by Technology 2025 & 2033
- Figure 24: South America Power Metering Equipment Industry Revenue (Million), by Country 2025 & 2033
- Figure 25: South America Power Metering Equipment Industry Revenue Share (%), by Country 2025 & 2033
- Figure 26: Middle East and Africa Power Metering Equipment Industry Revenue (Million), by End User 2025 & 2033
- Figure 27: Middle East and Africa Power Metering Equipment Industry Revenue Share (%), by End User 2025 & 2033
- Figure 28: Middle East and Africa Power Metering Equipment Industry Revenue (Million), by Technology 2025 & 2033
- Figure 29: Middle East and Africa Power Metering Equipment Industry Revenue Share (%), by Technology 2025 & 2033
- Figure 30: Middle East and Africa Power Metering Equipment Industry Revenue (Million), by Country 2025 & 2033
- Figure 31: Middle East and Africa Power Metering Equipment Industry Revenue Share (%), by Country 2025 & 2033
List of Tables
- Table 1: Global Power Metering Equipment Industry Revenue Million Forecast, by End User 2020 & 2033
- Table 2: Global Power Metering Equipment Industry Revenue Million Forecast, by Technology 2020 & 2033
- Table 3: Global Power Metering Equipment Industry Revenue Million Forecast, by Region 2020 & 2033
- Table 4: Global Power Metering Equipment Industry Revenue Million Forecast, by End User 2020 & 2033
- Table 5: Global Power Metering Equipment Industry Revenue Million Forecast, by Technology 2020 & 2033
- Table 6: Global Power Metering Equipment Industry Revenue Million Forecast, by Country 2020 & 2033
- Table 7: United States Power Metering Equipment Industry Revenue (Million) Forecast, by Application 2020 & 2033
- Table 8: Canada Power Metering Equipment Industry Revenue (Million) Forecast, by Application 2020 & 2033
- Table 9: Rest of North America Power Metering Equipment Industry Revenue (Million) Forecast, by Application 2020 & 2033
- Table 10: Global Power Metering Equipment Industry Revenue Million Forecast, by End User 2020 & 2033
- Table 11: Global Power Metering Equipment Industry Revenue Million Forecast, by Technology 2020 & 2033
- Table 12: Global Power Metering Equipment Industry Revenue Million Forecast, by Country 2020 & 2033
- Table 13: China Power Metering Equipment Industry Revenue (Million) Forecast, by Application 2020 & 2033
- Table 14: India Power Metering Equipment Industry Revenue (Million) Forecast, by Application 2020 & 2033
- Table 15: Japan Power Metering Equipment Industry Revenue (Million) Forecast, by Application 2020 & 2033
- Table 16: South Korea Power Metering Equipment Industry Revenue (Million) Forecast, by Application 2020 & 2033
- Table 17: Malaysia Power Metering Equipment Industry Revenue (Million) Forecast, by Application 2020 & 2033
- Table 18: Thailand Power Metering Equipment Industry Revenue (Million) Forecast, by Application 2020 & 2033
- Table 19: Indonesia Power Metering Equipment Industry Revenue (Million) Forecast, by Application 2020 & 2033
- Table 20: Vietnam Power Metering Equipment Industry Revenue (Million) Forecast, by Application 2020 & 2033
- Table 21: Rest of Asia Pacific Power Metering Equipment Industry Revenue (Million) Forecast, by Application 2020 & 2033
- Table 22: Global Power Metering Equipment Industry Revenue Million Forecast, by End User 2020 & 2033
- Table 23: Global Power Metering Equipment Industry Revenue Million Forecast, by Technology 2020 & 2033
- Table 24: Global Power Metering Equipment Industry Revenue Million Forecast, by Country 2020 & 2033
- Table 25: Germany Power Metering Equipment Industry Revenue (Million) Forecast, by Application 2020 & 2033
- Table 26: France Power Metering Equipment Industry Revenue (Million) Forecast, by Application 2020 & 2033
- Table 27: United Kingdom Power Metering Equipment Industry Revenue (Million) Forecast, by Application 2020 & 2033
- Table 28: Spain Power Metering Equipment Industry Revenue (Million) Forecast, by Application 2020 & 2033
- Table 29: Nordic Power Metering Equipment Industry Revenue (Million) Forecast, by Application 2020 & 2033
- Table 30: Turkey Power Metering Equipment Industry Revenue (Million) Forecast, by Application 2020 & 2033
- Table 31: Russia Power Metering Equipment Industry Revenue (Million) Forecast, by Application 2020 & 2033
- Table 32: Rest of Europe Power Metering Equipment Industry Revenue (Million) Forecast, by Application 2020 & 2033
- Table 33: Global Power Metering Equipment Industry Revenue Million Forecast, by End User 2020 & 2033
- Table 34: Global Power Metering Equipment Industry Revenue Million Forecast, by Technology 2020 & 2033
- Table 35: Global Power Metering Equipment Industry Revenue Million Forecast, by Country 2020 & 2033
- Table 36: Brazil Power Metering Equipment Industry Revenue (Million) Forecast, by Application 2020 & 2033
- Table 37: Argentina Power Metering Equipment Industry Revenue (Million) Forecast, by Application 2020 & 2033
- Table 38: Colombia Power Metering Equipment Industry Revenue (Million) Forecast, by Application 2020 & 2033
- Table 39: Rest of South America Power Metering Equipment Industry Revenue (Million) Forecast, by Application 2020 & 2033
- Table 40: Global Power Metering Equipment Industry Revenue Million Forecast, by End User 2020 & 2033
- Table 41: Global Power Metering Equipment Industry Revenue Million Forecast, by Technology 2020 & 2033
- Table 42: Global Power Metering Equipment Industry Revenue Million Forecast, by Country 2020 & 2033
- Table 43: Saudi Arabia Power Metering Equipment Industry Revenue (Million) Forecast, by Application 2020 & 2033
- Table 44: United Arab Emirates Power Metering Equipment Industry Revenue (Million) Forecast, by Application 2020 & 2033
- Table 45: Qatar Power Metering Equipment Industry Revenue (Million) Forecast, by Application 2020 & 2033
- Table 46: South Africa Power Metering Equipment Industry Revenue (Million) Forecast, by Application 2020 & 2033
- Table 47: Nigeria Power Metering Equipment Industry Revenue (Million) Forecast, by Application 2020 & 2033
- Table 48: Oman Power Metering Equipment Industry Revenue (Million) Forecast, by Application 2020 & 2033
- Table 49: Egypt Power Metering Equipment Industry Revenue (Million) Forecast, by Application 2020 & 2033
- Table 50: Algeria Power Metering Equipment Industry Revenue (Million) Forecast, by Application 2020 & 2033
- Table 51: Rest of Middle East and Africa Power Metering Equipment Industry Revenue (Million) Forecast, by Application 2020 & 2033
Frequently Asked Questions
1. What is the projected Compound Annual Growth Rate (CAGR) of the Power Metering Equipment Industry?
The projected CAGR is approximately > 5.70%.
2. Which companies are prominent players in the Power Metering Equipment Industry?
Key companies in the market include Itron Inc, Honeywell International*List Not Exhaustive 6 4 List of Other Prominent Companies (Company Name Headquarter Revenue Relevant Products and Services Operating Sector Recent Trends and Technology or Projects Contact Details etc )6 5 Market Ranking Analysi, ABB Ltd, Toshiba Corporation, Siemens AG, Schneider Electric SE, Kamstrup AS, Eaton Corporation PLC, Aclara Technologies LLC, General Electric Company.
3. What are the main segments of the Power Metering Equipment Industry?
The market segments include End User, Technology.
4. Can you provide details about the market size?
The market size is estimated to be USD 29.19 Million as of 2022.
5. What are some drivers contributing to market growth?
4.; Increasing Government Focus on the Development of Smart Grid Infrastructure 4.; Increase in Investments to Deploy Smart Meters.
6. What are the notable trends driving market growth?
Smart Meters Technology is Expected to Dominate the Market during the Forecast Period.
7. Are there any restraints impacting market growth?
4.; Issues Related to Privacy and Standardization of Power Meters.
8. Can you provide examples of recent developments in the market?
March 2024: The Government of India announced the Smart Meter National Program (SMNP). The program aims to replace 250 million conventional electricity meters with prepaid smart meters, along with upgrading infrastructure such as feeders and transformers. The project will be funded with an estimated capital expenditure of INR 1.5 trillion (approximately USD 17.97 billion) and is slated for implementation over the next five fiscal years.
9. What pricing options are available for accessing the report?
Pricing options include single-user, multi-user, and enterprise licenses priced at USD 4750, USD 5250, and USD 8750 respectively.
10. Is the market size provided in terms of value or volume?
The market size is provided in terms of value, measured in Million.
11. Are there any specific market keywords associated with the report?
Yes, the market keyword associated with the report is "Power Metering Equipment Industry," which aids in identifying and referencing the specific market segment covered.
12. How do I determine which pricing option suits my needs best?
The pricing options vary based on user requirements and access needs. Individual users may opt for single-user licenses, while businesses requiring broader access may choose multi-user or enterprise licenses for cost-effective access to the report.
13. Are there any additional resources or data provided in the Power Metering Equipment Industry report?
While the report offers comprehensive insights, it's advisable to review the specific contents or supplementary materials provided to ascertain if additional resources or data are available.
14. How can I stay updated on further developments or reports in the Power Metering Equipment Industry?
To stay informed about further developments, trends, and reports in the Power Metering Equipment Industry, consider subscribing to industry newsletters, following relevant companies and organizations, or regularly checking reputable industry news sources and publications.
Methodology
Step 1 - Identification of Relevant Samples Size from Population Database


Step 2 - Approaches for Defining Global Market Size (Value, Volume* & Price*)

Note*: In applicable scenarios
Step 3 - Data Sources
Primary Research
- Web Analytics
- Survey Reports
- Research Institute
- Latest Research Reports
- Opinion Leaders
Secondary Research
- Annual Reports
- White Paper
- Latest Press Release
- Industry Association
- Paid Database
- Investor Presentations

Step 4 - Data Triangulation
Involves using different sources of information in order to increase the validity of a study
These sources are likely to be stakeholders in a program - participants, other researchers, program staff, other community members, and so on.
Then we put all data in single framework & apply various statistical tools to find out the dynamic on the market.
During the analysis stage, feedback from the stakeholder groups would be compared to determine areas of agreement as well as areas of divergence