

Key Insights
The Positive Displacement Pumps (PDP) market is projected to reach a size of $29.38 billion by 2025, expanding at a compound annual growth rate (CAGR) of 4.42% from 2025 to 2033. This growth is driven by escalating demand for efficient fluid handling solutions across key sectors such as oil and gas, power generation, and water treatment. Technological innovations offering enhanced efficiency, durability, and reduced maintenance costs, coupled with the increasing adoption of automation and digitalization in industrial processes, are significant market accelerators. Robust regional growth is expected in North America, Europe, and the Asia-Pacific, fueled by infrastructure development and industrial expansion.
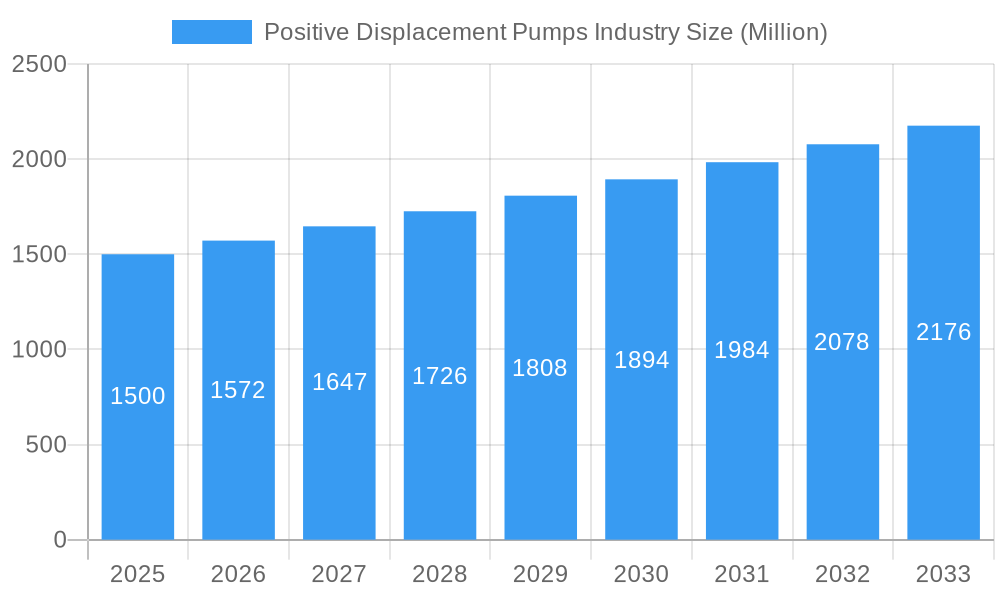
Positive Displacement Pumps Industry Market Size (In Billion)
Market growth may be tempered by raw material price volatility and economic uncertainties. Additionally, evolving environmental regulations and a strong emphasis on sustainability could influence technology adoption. Despite these challenges, the market outlook remains favorable, underpinned by the continuous need for dependable fluid handling systems. Reciprocating and rotary pumps represent a substantial market share, with the oil and gas industry being a primary end-user. Leading companies such as Ampco Pumps Company Inc, Flowserve Corp, and KSB SE & Co KGaA are poised to leverage market expansion through innovation, strategic partnerships, and global reach. The 2025-2033 forecast period offers significant opportunities for market growth and consolidation.
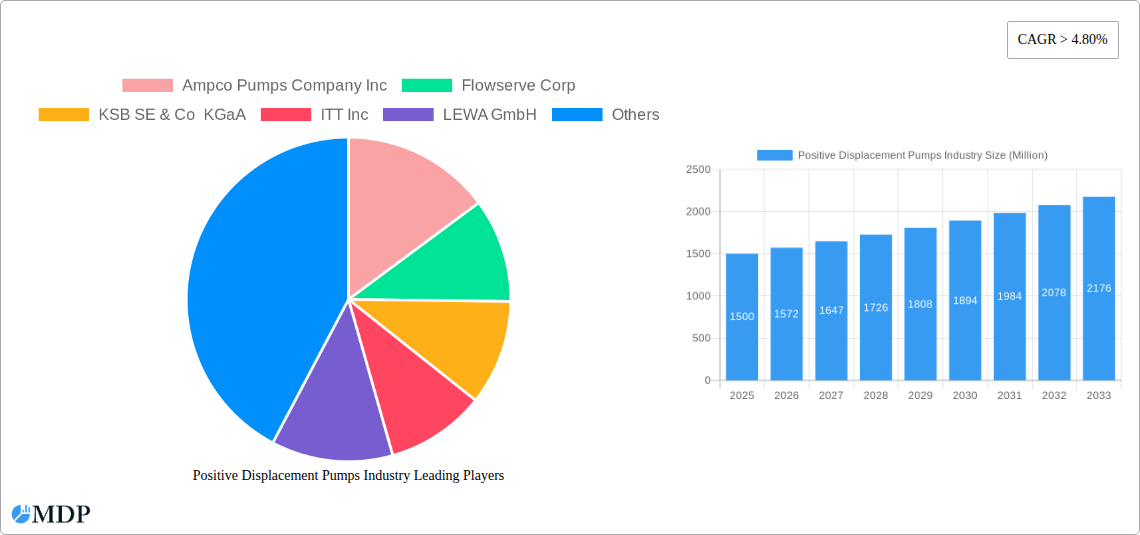
Positive Displacement Pumps Industry Company Market Share
Positive Displacement Pumps Industry Report: 2019-2033 Forecast
This comprehensive report provides a detailed analysis of the Positive Displacement Pumps industry, offering invaluable insights for stakeholders seeking to navigate this dynamic market. The study period covers 2019-2033, with a base year of 2025 and a forecast period of 2025-2033. The report leverages extensive data analysis to present a robust understanding of market dynamics, key trends, and future growth potential, encompassing a market value of xx Million.
Positive Displacement Pumps Industry Market Dynamics & Concentration
The global positive displacement pumps market exhibits a moderately concentrated structure, with several major players holding significant market share. Ampco Pumps Company Inc, Flowserve Corp, KSB SE & Co KGaA, ITT Inc, LEWA GmbH, SPX Flow Inc, NETZSCH Holding, Xylem Inc, Sulzer AG, and Pentair PLC are among the key players, although the market also includes numerous smaller, specialized manufacturers. The market share of the top 5 players is estimated at xx%, indicating a competitive landscape.
Innovation is a crucial driver, with ongoing development in materials (like CDI Energy Product's thermoplastic polymer composite), pump designs, and control systems enhancing efficiency and expanding applications. Stringent environmental regulations, particularly concerning emissions and energy efficiency, exert significant influence, driving demand for more sustainable and efficient pump technologies. Product substitution primarily comes from centrifugal pumps in certain applications, though positive displacement pumps maintain a strong position due to their superior handling of viscous fluids and precise flow control. M&A activity, such as the Atlas Copco acquisition of LEWA GmbH in 2022, highlights industry consolidation and expansion strategies. Over the historical period (2019-2024), approximately xx M&A deals were recorded in the sector.
- Market Concentration: Top 5 players hold approximately xx% market share.
- Innovation Drivers: New materials, design improvements, advanced control systems.
- Regulatory Framework: Stringent environmental regulations driving efficiency improvements.
- Product Substitutes: Competition from centrifugal pumps in specific applications.
- End-User Trends: Increasing demand from Oil & Gas, Water & Wastewater, and Chemical sectors.
- M&A Activity: Approximately xx M&A deals during 2019-2024.
Positive Displacement Pumps Industry Industry Trends & Analysis
The positive displacement pumps market is experiencing robust growth, driven by expanding industrialization, rising infrastructure development, and increasing demand across various end-user sectors. The CAGR during the forecast period (2025-2033) is projected to be xx%, with the market expected to reach xx Million by 2033. Technological advancements, such as the integration of smart sensors and digital control systems, are enhancing pump efficiency, reliability, and predictive maintenance capabilities. This is leading to higher market penetration of advanced pumps in several applications. Consumer preferences are increasingly shifting towards energy-efficient and environmentally friendly solutions, creating opportunities for manufacturers offering sustainable pump technologies. Competitive dynamics are characterized by both intense competition among established players and the emergence of innovative startups focusing on niche applications. Market penetration of smart pumps is expected to reach xx% by 2033.
Leading Markets & Segments in Positive Displacement Pumps Industry
The Oil and Gas sector represents the largest end-user segment, accounting for approximately xx% of the market, driven by robust upstream and downstream activities. The Chemical industry holds significant importance, consuming roughly xx% of the global production due to the widespread use of pumps in various chemical processing applications. Geographically, North America and Europe are the leading markets currently, with significant growth potential in emerging economies like Asia-Pacific.
- Key Drivers for Oil & Gas: Growing oil and gas exploration and production activities.
- Key Drivers for Chemical: Expanding chemical production capacity and processing needs.
- Key Drivers for North America: Robust industrial activity and investment in infrastructure.
- Key Drivers for Europe: Stringent environmental regulations driving adoption of advanced pumps.
- Key Drivers for Asia-Pacific: Rapid industrialization and infrastructure development.
The rotary segment dominates the pump type market, holding approximately xx% market share due to its versatility and suitability for various applications. Reciprocating pumps, while smaller in market share (xx%), maintain strong demand in niche applications requiring precise flow control.
Positive Displacement Pumps Industry Product Developments
Recent product innovations focus on improving energy efficiency, reducing noise levels, and enhancing reliability. The development of new materials, like the thermoplastic polymer composite launched by CDI Energy Products, enhances the durability and lifespan of pumps operating in harsh environments. Advanced control systems and smart sensors allow for predictive maintenance, preventing downtime and reducing operational costs. These advancements are improving the market fit for positive displacement pumps in various demanding applications, broadening the overall market potential.
Key Drivers of Positive Displacement Pumps Industry Growth
Several factors contribute to the industry's growth. Technological advancements are making pumps more efficient, reliable, and adaptable to different applications. Rising infrastructure investment in water treatment, oil & gas extraction, and chemical processing fuels demand. Moreover, supportive government policies and regulations aimed at promoting energy efficiency are encouraging the adoption of advanced pump technologies.
Challenges in the Positive Displacement Pumps Industry Market
The industry faces several challenges. Fluctuations in raw material prices impact production costs. Supply chain disruptions, particularly in the sourcing of specialized components, can affect manufacturing timelines. Furthermore, intense competition from established players and new entrants necessitates ongoing innovation and cost optimization strategies. These issues combined are projected to create a yearly loss of approximately xx Million by 2033.
Emerging Opportunities in Positive Displacement Pumps Industry
Long-term growth is driven by several factors. The development of highly efficient and sustainable pump technologies will attract environmentally conscious customers. Strategic partnerships and collaborations between pump manufacturers and technology providers will accelerate innovation and improve product offerings. Expansion into emerging markets with growing industrial and infrastructure development presents significant market penetration opportunities.
Leading Players in the Positive Displacement Pumps Industry Sector
- Ampco Pumps Company Inc
- Flowserve Corp
- KSB SE & Co KGaA
- ITT Inc
- LEWA GmbH
- SPX Flow Inc
- NETZSCH Holding
- Xylem Inc
- Sulzer AG
- Pentair PLC
Key Milestones in Positive Displacement Pumps Industry Industry
- May 2021: CDI Energy Products launched a new thermoplastic polymer composite for pumps.
- March 2022: Atlas Copco acquired LEWA GmbH, a significant player in positive displacement pumps.
Strategic Outlook for Positive Displacement Pumps Industry Market
The positive displacement pumps market is poised for sustained growth, driven by technological innovation, increasing demand from key end-user sectors, and expansion into emerging markets. Strategic investments in R&D, focusing on energy efficiency and sustainability, along with strategic partnerships to expand market reach, will be crucial for success in this competitive landscape. The market's potential for growth remains significant, with opportunities for both established players and new entrants to capture market share.
Positive Displacement Pumps Industry Segmentation
-
1. Type
- 1.1. Reciprocating
- 1.2. Rotary
-
2. End-user Industry
- 2.1. Oil and Gas
- 2.2. Power Generation
- 2.3. Water and Wastewater
- 2.4. Chemical
- 2.5. Other End-user Industries
Positive Displacement Pumps Industry Segmentation By Geography
- 1. North America
- 2. Europe
- 3. Asia Pacific
- 4. South America
- 5. Middle East
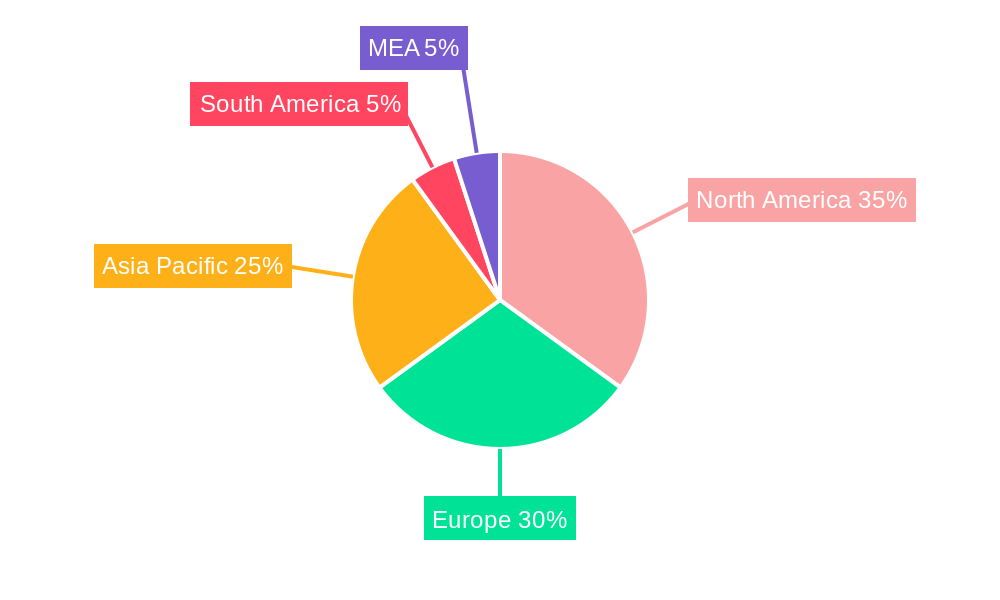
Positive Displacement Pumps Industry Regional Market Share
Geographic Coverage of Positive Displacement Pumps Industry
Positive Displacement Pumps Industry REPORT HIGHLIGHTS
| Aspects | Details |
|---|---|
| Study Period | 2020-2034 |
| Base Year | 2025 |
| Estimated Year | 2026 |
| Forecast Period | 2026-2034 |
| Historical Period | 2020-2025 |
| Growth Rate | CAGR of 4.42% from 2020-2034 |
| Segmentation |
|
Table of Contents
- 1. Introduction
- 1.1. Research Scope
- 1.2. Market Segmentation
- 1.3. Research Objective
- 1.4. Definitions and Assumptions
- 2. Executive Summary
- 2.1. Market Snapshot
- 3. Market Dynamics
- 3.1. Market Drivers
- 3.2. Market Restrains
- 3.3. Market Trends
- 3.4. Market Opportunities
- 4. Market Factor Analysis
- 4.1. Porters Five Forces
- 4.1.1. Bargaining Power of Suppliers
- 4.1.2. Bargaining Power of Buyers
- 4.1.3. Threat of New Entrants
- 4.1.4. Threat of Substitutes
- 4.1.5. Competitive Rivalry
- 4.2. PESTEL analysis
- 4.3. BCG Analysis
- 4.3.1. Stars (High Growth, High Market Share)
- 4.3.2. Cash Cows (Low Growth, High Market Share)
- 4.3.3. Question Mark (High Growth, Low Market Share)
- 4.3.4. Dogs (Low Growth, Low Market Share)
- 4.4. Ansoff Matrix Analysis
- 4.5. Supply Chain Analysis
- 4.6. Regulatory Landscape
- 4.7. Current Market Potential and Opportunity Assessment (TAM–SAM–SOM Framework)
- 4.8. MDP Analyst Note
- 4.1. Porters Five Forces
- 5. Market Analysis, Insights and Forecast 2021-2033
- 5.1. Market Analysis, Insights and Forecast - by Type
- 5.1.1. Reciprocating
- 5.1.2. Rotary
- 5.2. Market Analysis, Insights and Forecast - by End-user Industry
- 5.2.1. Oil and Gas
- 5.2.2. Power Generation
- 5.2.3. Water and Wastewater
- 5.2.4. Chemical
- 5.2.5. Other End-user Industries
- 5.3. Market Analysis, Insights and Forecast - by Region
- 5.3.1. North America
- 5.3.2. Europe
- 5.3.3. Asia Pacific
- 5.3.4. South America
- 5.3.5. Middle East
- 5.1. Market Analysis, Insights and Forecast - by Type
- 6. Global Positive Displacement Pumps Industry Analysis, Insights and Forecast, 2021-2033
- 6.1. Market Analysis, Insights and Forecast - by Type
- 6.1.1. Reciprocating
- 6.1.2. Rotary
- 6.2. Market Analysis, Insights and Forecast - by End-user Industry
- 6.2.1. Oil and Gas
- 6.2.2. Power Generation
- 6.2.3. Water and Wastewater
- 6.2.4. Chemical
- 6.2.5. Other End-user Industries
- 6.1. Market Analysis, Insights and Forecast - by Type
- 7. North America Positive Displacement Pumps Industry Analysis, Insights and Forecast, 2020-2032
- 7.1. Market Analysis, Insights and Forecast - by Type
- 7.1.1. Reciprocating
- 7.1.2. Rotary
- 7.2. Market Analysis, Insights and Forecast - by End-user Industry
- 7.2.1. Oil and Gas
- 7.2.2. Power Generation
- 7.2.3. Water and Wastewater
- 7.2.4. Chemical
- 7.2.5. Other End-user Industries
- 7.1. Market Analysis, Insights and Forecast - by Type
- 8. Europe Positive Displacement Pumps Industry Analysis, Insights and Forecast, 2020-2032
- 8.1. Market Analysis, Insights and Forecast - by Type
- 8.1.1. Reciprocating
- 8.1.2. Rotary
- 8.2. Market Analysis, Insights and Forecast - by End-user Industry
- 8.2.1. Oil and Gas
- 8.2.2. Power Generation
- 8.2.3. Water and Wastewater
- 8.2.4. Chemical
- 8.2.5. Other End-user Industries
- 8.1. Market Analysis, Insights and Forecast - by Type
- 9. Asia Pacific Positive Displacement Pumps Industry Analysis, Insights and Forecast, 2020-2032
- 9.1. Market Analysis, Insights and Forecast - by Type
- 9.1.1. Reciprocating
- 9.1.2. Rotary
- 9.2. Market Analysis, Insights and Forecast - by End-user Industry
- 9.2.1. Oil and Gas
- 9.2.2. Power Generation
- 9.2.3. Water and Wastewater
- 9.2.4. Chemical
- 9.2.5. Other End-user Industries
- 9.1. Market Analysis, Insights and Forecast - by Type
- 10. South America Positive Displacement Pumps Industry Analysis, Insights and Forecast, 2020-2032
- 10.1. Market Analysis, Insights and Forecast - by Type
- 10.1.1. Reciprocating
- 10.1.2. Rotary
- 10.2. Market Analysis, Insights and Forecast - by End-user Industry
- 10.2.1. Oil and Gas
- 10.2.2. Power Generation
- 10.2.3. Water and Wastewater
- 10.2.4. Chemical
- 10.2.5. Other End-user Industries
- 10.1. Market Analysis, Insights and Forecast - by Type
- 11. Middle East Positive Displacement Pumps Industry Analysis, Insights and Forecast, 2020-2032
- 11.1. Market Analysis, Insights and Forecast - by Type
- 11.1.1. Reciprocating
- 11.1.2. Rotary
- 11.2. Market Analysis, Insights and Forecast - by End-user Industry
- 11.2.1. Oil and Gas
- 11.2.2. Power Generation
- 11.2.3. Water and Wastewater
- 11.2.4. Chemical
- 11.2.5. Other End-user Industries
- 11.1. Market Analysis, Insights and Forecast - by Type
- 12. Competitive Analysis
- 12.1. Company Profiles
- 12.1.1 Ampco Pumps Company Inc
- 12.1.1.1. Company Overview
- 12.1.1.2. Products
- 12.1.1.3. Company Financials
- 12.1.1.4. SWOT Analysis
- 12.1.2 Flowserve Corp
- 12.1.2.1. Company Overview
- 12.1.2.2. Products
- 12.1.2.3. Company Financials
- 12.1.2.4. SWOT Analysis
- 12.1.3 KSB SE & Co KGaA
- 12.1.3.1. Company Overview
- 12.1.3.2. Products
- 12.1.3.3. Company Financials
- 12.1.3.4. SWOT Analysis
- 12.1.4 ITT Inc
- 12.1.4.1. Company Overview
- 12.1.4.2. Products
- 12.1.4.3. Company Financials
- 12.1.4.4. SWOT Analysis
- 12.1.5 LEWA GmbH
- 12.1.5.1. Company Overview
- 12.1.5.2. Products
- 12.1.5.3. Company Financials
- 12.1.5.4. SWOT Analysis
- 12.1.6 SPX Flow Inc
- 12.1.6.1. Company Overview
- 12.1.6.2. Products
- 12.1.6.3. Company Financials
- 12.1.6.4. SWOT Analysis
- 12.1.7 NETZSCH Holding
- 12.1.7.1. Company Overview
- 12.1.7.2. Products
- 12.1.7.3. Company Financials
- 12.1.7.4. SWOT Analysis
- 12.1.8 Xylem Inc *List Not Exhaustive
- 12.1.8.1. Company Overview
- 12.1.8.2. Products
- 12.1.8.3. Company Financials
- 12.1.8.4. SWOT Analysis
- 12.1.9 Sulzer AG
- 12.1.9.1. Company Overview
- 12.1.9.2. Products
- 12.1.9.3. Company Financials
- 12.1.9.4. SWOT Analysis
- 12.1.10 Pentair PLC
- 12.1.10.1. Company Overview
- 12.1.10.2. Products
- 12.1.10.3. Company Financials
- 12.1.10.4. SWOT Analysis
- 12.1.1 Ampco Pumps Company Inc
- 12.2. Market Entropy
- 12.2.1 Company's Key Areas Served
- 12.2.2 Recent Developments
- 12.3. Company Market Share Analysis 2025
- 12.3.1 Top 5 Companies Market Share Analysis
- 12.3.2 Top 3 Companies Market Share Analysis
- 12.4. List of Potential Customers
- 13. Research Methodology
List of Figures
- Figure 1: Global Positive Displacement Pumps Industry Revenue Breakdown (billion, %) by Region 2025 & 2033
- Figure 2: North America Positive Displacement Pumps Industry Revenue (billion), by Type 2025 & 2033
- Figure 3: North America Positive Displacement Pumps Industry Revenue Share (%), by Type 2025 & 2033
- Figure 4: North America Positive Displacement Pumps Industry Revenue (billion), by End-user Industry 2025 & 2033
- Figure 5: North America Positive Displacement Pumps Industry Revenue Share (%), by End-user Industry 2025 & 2033
- Figure 6: North America Positive Displacement Pumps Industry Revenue (billion), by Country 2025 & 2033
- Figure 7: North America Positive Displacement Pumps Industry Revenue Share (%), by Country 2025 & 2033
- Figure 8: Europe Positive Displacement Pumps Industry Revenue (billion), by Type 2025 & 2033
- Figure 9: Europe Positive Displacement Pumps Industry Revenue Share (%), by Type 2025 & 2033
- Figure 10: Europe Positive Displacement Pumps Industry Revenue (billion), by End-user Industry 2025 & 2033
- Figure 11: Europe Positive Displacement Pumps Industry Revenue Share (%), by End-user Industry 2025 & 2033
- Figure 12: Europe Positive Displacement Pumps Industry Revenue (billion), by Country 2025 & 2033
- Figure 13: Europe Positive Displacement Pumps Industry Revenue Share (%), by Country 2025 & 2033
- Figure 14: Asia Pacific Positive Displacement Pumps Industry Revenue (billion), by Type 2025 & 2033
- Figure 15: Asia Pacific Positive Displacement Pumps Industry Revenue Share (%), by Type 2025 & 2033
- Figure 16: Asia Pacific Positive Displacement Pumps Industry Revenue (billion), by End-user Industry 2025 & 2033
- Figure 17: Asia Pacific Positive Displacement Pumps Industry Revenue Share (%), by End-user Industry 2025 & 2033
- Figure 18: Asia Pacific Positive Displacement Pumps Industry Revenue (billion), by Country 2025 & 2033
- Figure 19: Asia Pacific Positive Displacement Pumps Industry Revenue Share (%), by Country 2025 & 2033
- Figure 20: South America Positive Displacement Pumps Industry Revenue (billion), by Type 2025 & 2033
- Figure 21: South America Positive Displacement Pumps Industry Revenue Share (%), by Type 2025 & 2033
- Figure 22: South America Positive Displacement Pumps Industry Revenue (billion), by End-user Industry 2025 & 2033
- Figure 23: South America Positive Displacement Pumps Industry Revenue Share (%), by End-user Industry 2025 & 2033
- Figure 24: South America Positive Displacement Pumps Industry Revenue (billion), by Country 2025 & 2033
- Figure 25: South America Positive Displacement Pumps Industry Revenue Share (%), by Country 2025 & 2033
- Figure 26: Middle East Positive Displacement Pumps Industry Revenue (billion), by Type 2025 & 2033
- Figure 27: Middle East Positive Displacement Pumps Industry Revenue Share (%), by Type 2025 & 2033
- Figure 28: Middle East Positive Displacement Pumps Industry Revenue (billion), by End-user Industry 2025 & 2033
- Figure 29: Middle East Positive Displacement Pumps Industry Revenue Share (%), by End-user Industry 2025 & 2033
- Figure 30: Middle East Positive Displacement Pumps Industry Revenue (billion), by Country 2025 & 2033
- Figure 31: Middle East Positive Displacement Pumps Industry Revenue Share (%), by Country 2025 & 2033
List of Tables
- Table 1: Global Positive Displacement Pumps Industry Revenue billion Forecast, by Type 2020 & 2033
- Table 2: Global Positive Displacement Pumps Industry Revenue billion Forecast, by End-user Industry 2020 & 2033
- Table 3: Global Positive Displacement Pumps Industry Revenue billion Forecast, by Region 2020 & 2033
- Table 4: Global Positive Displacement Pumps Industry Revenue billion Forecast, by Type 2020 & 2033
- Table 5: Global Positive Displacement Pumps Industry Revenue billion Forecast, by End-user Industry 2020 & 2033
- Table 6: Global Positive Displacement Pumps Industry Revenue billion Forecast, by Country 2020 & 2033
- Table 7: Global Positive Displacement Pumps Industry Revenue billion Forecast, by Type 2020 & 2033
- Table 8: Global Positive Displacement Pumps Industry Revenue billion Forecast, by End-user Industry 2020 & 2033
- Table 9: Global Positive Displacement Pumps Industry Revenue billion Forecast, by Country 2020 & 2033
- Table 10: Global Positive Displacement Pumps Industry Revenue billion Forecast, by Type 2020 & 2033
- Table 11: Global Positive Displacement Pumps Industry Revenue billion Forecast, by End-user Industry 2020 & 2033
- Table 12: Global Positive Displacement Pumps Industry Revenue billion Forecast, by Country 2020 & 2033
- Table 13: Global Positive Displacement Pumps Industry Revenue billion Forecast, by Type 2020 & 2033
- Table 14: Global Positive Displacement Pumps Industry Revenue billion Forecast, by End-user Industry 2020 & 2033
- Table 15: Global Positive Displacement Pumps Industry Revenue billion Forecast, by Country 2020 & 2033
- Table 16: Global Positive Displacement Pumps Industry Revenue billion Forecast, by Type 2020 & 2033
- Table 17: Global Positive Displacement Pumps Industry Revenue billion Forecast, by End-user Industry 2020 & 2033
- Table 18: Global Positive Displacement Pumps Industry Revenue billion Forecast, by Country 2020 & 2033
Frequently Asked Questions
1. What is the projected Compound Annual Growth Rate (CAGR) of the Positive Displacement Pumps Industry?
The projected CAGR is approximately 4.42%.
2. Which companies are prominent players in the Positive Displacement Pumps Industry?
Key companies in the market include Ampco Pumps Company Inc, Flowserve Corp, KSB SE & Co KGaA, ITT Inc, LEWA GmbH, SPX Flow Inc, NETZSCH Holding, Xylem Inc *List Not Exhaustive, Sulzer AG, Pentair PLC.
3. What are the main segments of the Positive Displacement Pumps Industry?
The market segments include Type, End-user Industry.
4. Can you provide details about the market size?
The market size is estimated to be USD 29.38 billion as of 2022.
5. What are some drivers contributing to market growth?
4.; The Increasing Demand from the EV4.; Growing Renewable Energy Market.
6. What are the notable trends driving market growth?
Water and Wastewater Sector to Witness Significant Market Growth.
7. Are there any restraints impacting market growth?
4.; Demand-Supply Mismatch for Raw Materials.
8. Can you provide examples of recent developments in the market?
In March 2022, Atlas Copco agreed to acquire LEWA GmbH and subsidiaries and Geveke BV and subsidiaries. LEWA is a leading manufacturer of diaphragm metering pumps, process pumps, and positive displacement pumps.
9. What pricing options are available for accessing the report?
Pricing options include single-user, multi-user, and enterprise licenses priced at USD 4750, USD 5250, and USD 8750 respectively.
10. Is the market size provided in terms of value or volume?
The market size is provided in terms of value, measured in billion.
11. Are there any specific market keywords associated with the report?
Yes, the market keyword associated with the report is "Positive Displacement Pumps Industry," which aids in identifying and referencing the specific market segment covered.
12. How do I determine which pricing option suits my needs best?
The pricing options vary based on user requirements and access needs. Individual users may opt for single-user licenses, while businesses requiring broader access may choose multi-user or enterprise licenses for cost-effective access to the report.
13. Are there any additional resources or data provided in the Positive Displacement Pumps Industry report?
While the report offers comprehensive insights, it's advisable to review the specific contents or supplementary materials provided to ascertain if additional resources or data are available.
14. How can I stay updated on further developments or reports in the Positive Displacement Pumps Industry?
To stay informed about further developments, trends, and reports in the Positive Displacement Pumps Industry, consider subscribing to industry newsletters, following relevant companies and organizations, or regularly checking reputable industry news sources and publications.
Methodology
Step 1 - Identification of Relevant Samples Size from Population Database


Step 2 - Approaches for Defining Global Market Size (Value, Volume* & Price*)

Note*: In applicable scenarios
Step 3 - Data Sources
Primary Research
- Web Analytics
- Survey Reports
- Research Institute
- Latest Research Reports
- Opinion Leaders
Secondary Research
- Annual Reports
- White Paper
- Latest Press Release
- Industry Association
- Paid Database
- Investor Presentations

Step 4 - Data Triangulation
Involves using different sources of information in order to increase the validity of a study
These sources are likely to be stakeholders in a program - participants, other researchers, program staff, other community members, and so on.
Then we put all data in single framework & apply various statistical tools to find out the dynamic on the market.
During the analysis stage, feedback from the stakeholder groups would be compared to determine areas of agreement as well as areas of divergence