

Key Insights
The offshore decommissioning services market is experiencing substantial growth, propelled by aging global offshore oil and gas infrastructure and increasingly stringent environmental regulations. With a projected compound annual growth rate (CAGR) of 6.5%, the market is set to expand significantly from its current valuation. Segmentation by water depth—shallow, deepwater, and ultra-deepwater—underscores the diverse technological challenges and associated costs inherent in decommissioning across various offshore environments. Deepwater and ultra-deepwater projects, in particular, demand specialized vessels and advanced technologies, contributing to elevated service expenses. Key growth catalysts include the imperative for regulatory compliance, mitigation of environmental risks from abandoned platforms, and the recovery of valuable assets.
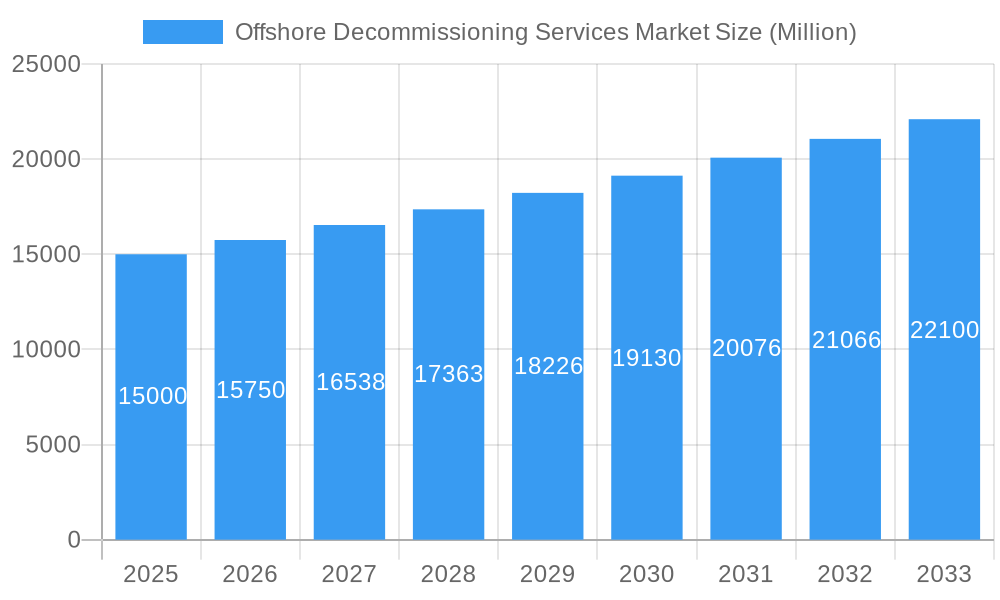
Offshore Decommissioning Services Market Market Size (In Billion)
However, market expansion is tempered by restraints such as volatile oil prices, which influence operator investment decisions, and potential technological limitations in addressing highly complex decommissioning tasks. Regional market dynamics are shaped by the concentration of existing offshore infrastructure and governmental policies. North America, Europe, and the Asia-Pacific region currently dominate market share, with emerging markets also indicating promising growth trajectories. The presence of major industry players such as Aker Solutions, DNV GL, and TechnipFMC highlights the critical need for sophisticated technological expertise and robust project management capabilities in successful decommissioning operations.
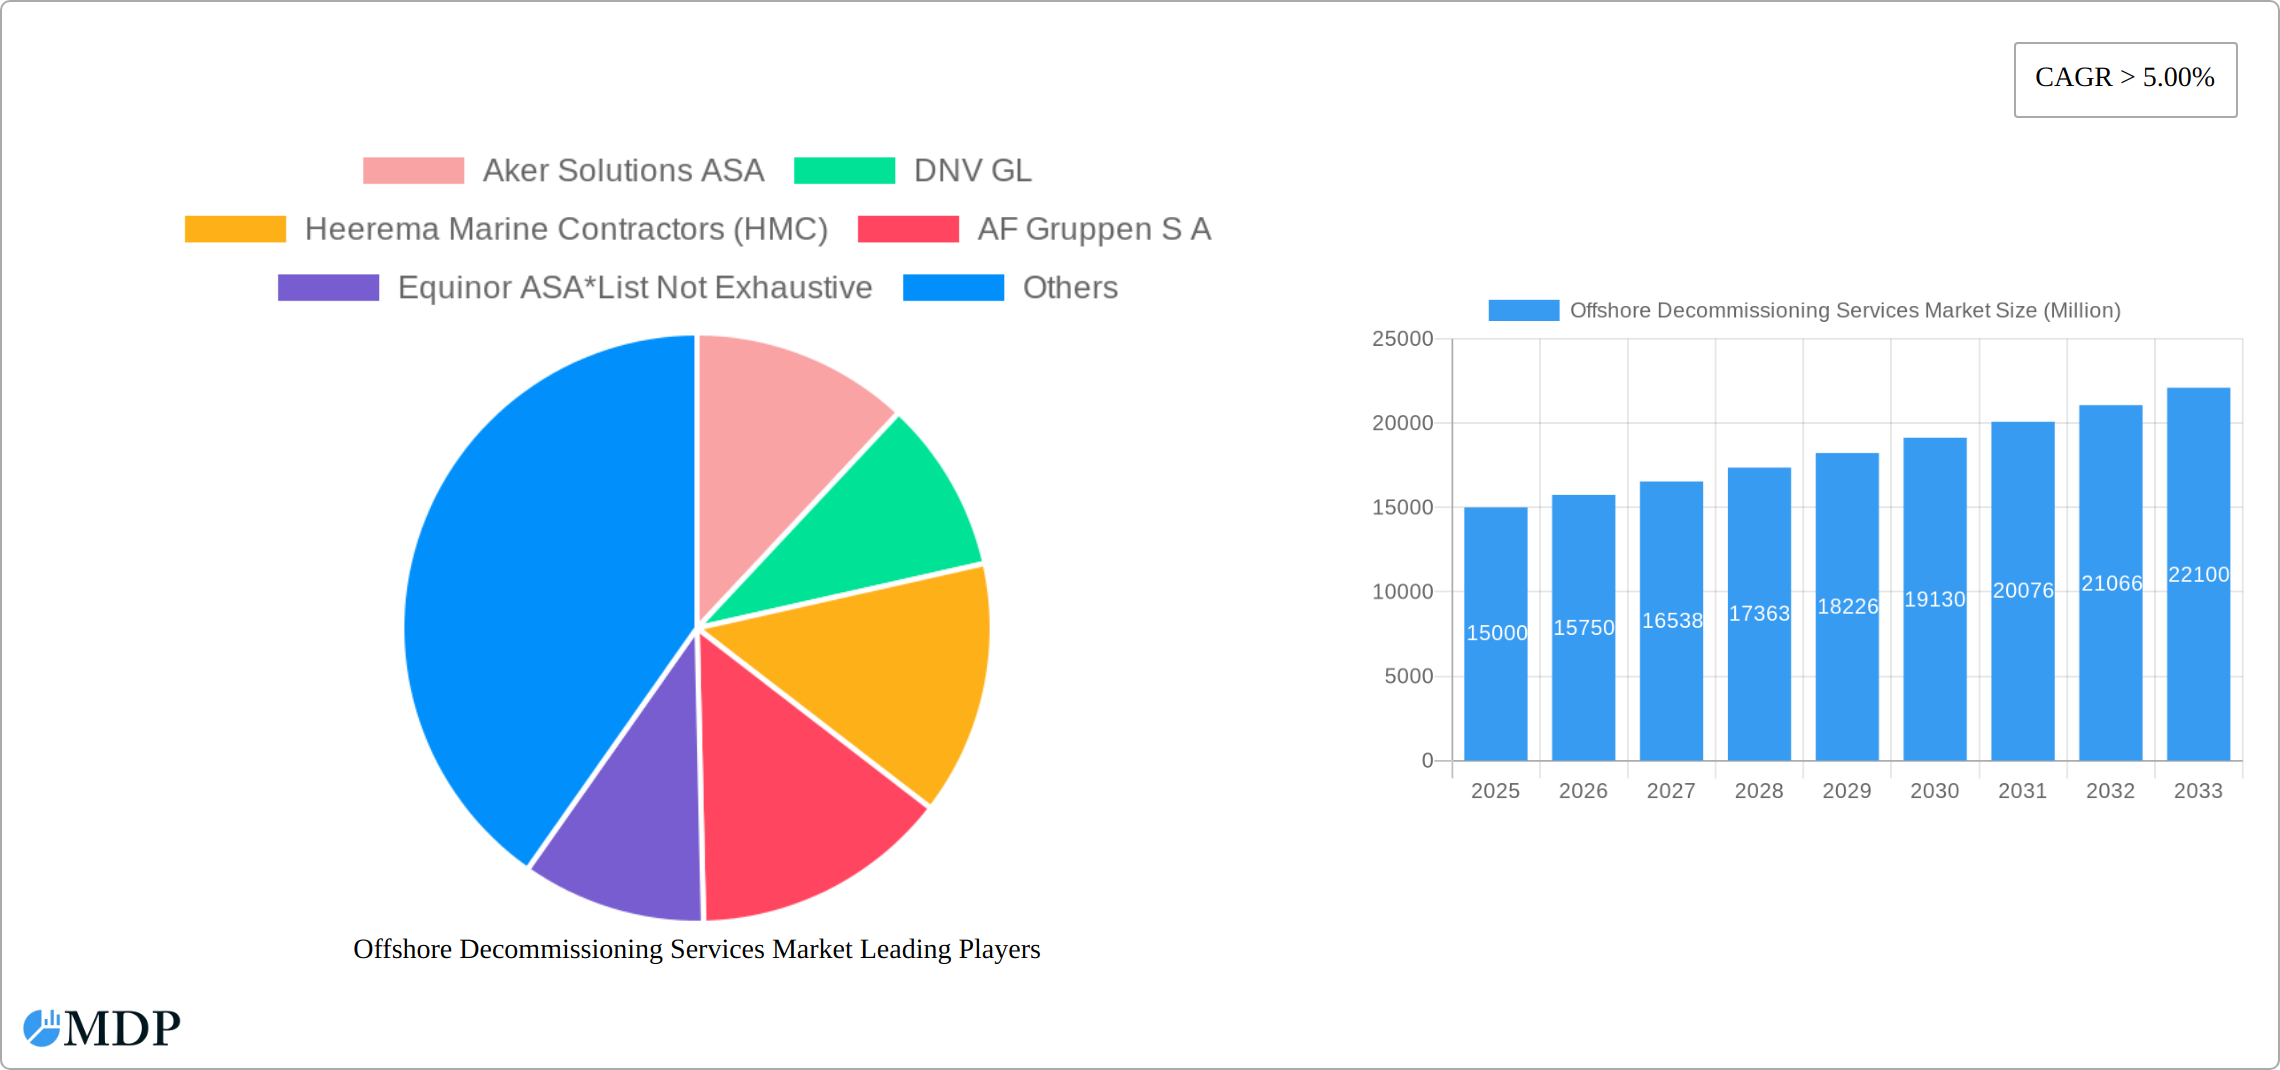
Offshore Decommissioning Services Market Company Market Share
The competitive landscape features a blend of large international contractors and specialized service providers. Strategic alliances and mergers and acquisitions are anticipated to reshape the industry as companies seek to broaden their service offerings and global reach. Advancements in robotics, remotely operated vehicles (ROVs), and cutting-edge subsea intervention technologies are consistently enhancing efficiency and safety in decommissioning. While initial technology investments can be considerable, they promise long-term cost savings and improved environmental outcomes. The forecast period, spanning from 2025 to 2033, is expected to witness greater adoption of innovative technologies and optimized project management strategies, further accelerating market expansion. We estimate the market size in 2025 to be $11.1 billion, with robust expansion anticipated throughout the forecast period.
Unlock Growth in the Offshore Decommissioning Services Market: A Comprehensive Report (2019-2033)
This comprehensive report provides an in-depth analysis of the Offshore Decommissioning Services Market, offering invaluable insights for stakeholders seeking to navigate this rapidly evolving sector. With a study period spanning 2019-2033, a base year of 2025, and a forecast period of 2025-2033, this report delivers crucial data and strategic recommendations to maximize investment returns. The market is segmented by water depth: Shallow Water, Deepwater, and Ultra-Deepwater. Key players analyzed include Aker Solutions ASA, DNV GL, Heerema Marine Contractors (HMC), AF Gruppen S A, Equinor ASA, Able UK, John Wood Group PLC, DeepOcean Group Holding B V, TechnipFMC PLC, and Allseas Group. This is not an exhaustive list. The report reveals a market valued at xx Million in 2025, projected to reach xx Million by 2033, exhibiting a CAGR of xx%.
Offshore Decommissioning Services Market Market Dynamics & Concentration
The Offshore Decommissioning Services market is characterized by moderate concentration, with several major players holding significant market share. Aker Solutions ASA and TechnipFMC PLC, for example, individually hold approximately xx% and xx% market share respectively in 2025 (estimated). However, the market also features a number of smaller, specialized firms. Innovation is a key driver, fueled by the need for more efficient and environmentally friendly decommissioning technologies. Stringent regulatory frameworks, particularly concerning environmental protection and worker safety, heavily influence market activities. The increasing cost of operating offshore assets is driving demand for cost-effective decommissioning solutions, while advancements in robotics and automation are creating new market opportunities. Substitutes for existing decommissioning methods are limited, as specialized equipment and expertise are required. End-user trends show a growing preference for sustainable decommissioning practices. M&A activity has been moderate, with approximately xx deals recorded between 2019 and 2024, indicative of consolidation within the sector.
- Market Share Concentration: High concentration in the top 5 players (estimated at xx%).
- M&A Activity: xx deals recorded between 2019 and 2024.
- Regulatory Landscape: Stringent environmental regulations are a major driver shaping the market.
- Innovation Drivers: Technological advancements in robotics and automation are key.
Offshore Decommissioning Services Market Industry Trends & Analysis
The Offshore Decommissioning Services market is experiencing robust growth, driven by several key factors. Aging offshore oil and gas infrastructure necessitates widespread decommissioning, creating substantial demand. Furthermore, stringent environmental regulations and growing public awareness of environmental concerns are pushing operators toward faster and more responsible decommissioning. Technological advancements, such as remotely operated vehicles (ROVs) and advanced underwater cutting techniques, enhance efficiency and safety, thus accelerating market growth. The competitive landscape is dynamic, with established players continually investing in R&D and smaller companies specializing in niche technologies. The market penetration of advanced decommissioning technologies is steadily increasing, with a projected xx% penetration by 2033. Consumer preferences, largely driven by environmental concerns and regulatory compliance, favor eco-friendly methods. The market is expected to witness a CAGR of xx% during the forecast period (2025-2033).
Leading Markets & Segments in Offshore Decommissioning Services Market
The North Sea region, specifically the UK and Norway, currently dominates the Offshore Decommissioning Services market. This dominance is largely attributed to the extensive aging infrastructure in the area and proactive government policies encouraging responsible decommissioning. Deepwater projects represent a significant segment, reflecting the large number of deepwater installations nearing the end of their operational lifespan. Shallow-water decommissioning, however, also represents a substantial market share, particularly in regions with older, less complex platforms. The ultra-deepwater segment is emerging, but currently represents a smaller portion.
- Key Drivers for North Sea Dominance:
- High concentration of aging offshore assets.
- Supportive regulatory framework encouraging responsible decommissioning.
- Robust investment in decommissioning infrastructure.
- Well-established supply chain.
- Deepwater Segment Analysis:
- Significant market share due to the high number of deepwater assets approaching decommissioning.
- Higher technical complexity and cost compared to shallow water projects.
- Shallow Water Segment Analysis:
- Represents a substantial market due to the large number of aging platforms.
- Typically involves simpler and less costly decommissioning processes.
- Ultra-Deepwater Segment Analysis:
- Represents a comparatively smaller but growing market segment.
- Presents unique technical and logistical challenges.
Offshore Decommissioning Services Market Product Developments
The offshore decommissioning services market is experiencing a surge in innovative product developments focused on enhancing efficiency, safety, and environmental sustainability. This includes the development and deployment of advanced robotics and autonomous underwater vehicles (AUVs), sophisticated automation systems minimizing human intervention in hazardous environments, and improved underwater cutting and separation techniques for precise and controlled dismantling of offshore structures. Furthermore, the industry is witnessing significant advancements in waste management solutions, encompassing efficient collection, processing, and disposal or repurposing of decommissioned materials, significantly reducing the environmental footprint of these projects. Data analytics and real-time remote monitoring technologies play a crucial role in improving risk assessment, optimizing resource allocation, and enhancing overall operational efficiency. This technological evolution enables better decision-making, cost reduction, and streamlined project execution, ultimately making decommissioning projects more attractive and economically viable.
Key Drivers of Offshore Decommissioning Services Market Growth
Several factors fuel market expansion. Firstly, the aging infrastructure of offshore oil and gas installations necessitates large-scale decommissioning projects. Secondly, stricter environmental regulations incentivize the adoption of eco-friendly decommissioning methods. Thirdly, technological advancements improve efficiency and cost-effectiveness. Finally, government incentives and support programs in key regions further accelerate market growth.
Challenges in the Offshore Decommissioning Services Market Market
Significant challenges hinder market growth. Regulatory hurdles, including obtaining necessary permits and approvals, can delay projects. Supply chain complexities, with the need for specialized equipment and skilled labor, can result in cost overruns and project delays. Furthermore, intense competition amongst service providers puts downward pressure on prices. The inherent risks associated with deepwater operations, such as harsh environmental conditions and potential for accidents, pose challenges in managing project timelines and costs.
Emerging Opportunities in Offshore Decommissioning Services Market
The long-term growth prospects for the offshore decommissioning services market are fueled by several key factors. Technological breakthroughs in autonomous underwater vehicles (AUVs), artificial intelligence (AI)-powered solutions for data analysis and predictive maintenance, and the development of sustainable decommissioning practices are driving innovation and efficiency gains. Strategic partnerships between established service providers and technology developers are fostering the creation of innovative solutions and expanding market reach. Market expansion into new regions with aging offshore infrastructure, particularly in the Asia-Pacific region, presents significant growth potential. The increasing global focus on the circular economy and the potential for repurposing and recycling decommissioned materials offer substantial opportunities for value creation and sustainable development within the industry.
Leading Players in the Offshore Decommissioning Services Market Sector
- Aker Solutions ASA
- DNV GL
- Heerema Marine Contractors (HMC)
- AF Gruppen S A
- Equinor ASA
- Able UK
- John Wood Group PLC
- DeepOcean Group Holding B V
- TechnipFMC PLC
- Allseas Group
Key Milestones in Offshore Decommissioning Services Market Industry
- 2020: Introduction of new robotic decommissioning technology by Aker Solutions ASA.
- 2022: DNV GL publishes updated guidelines for environmentally responsible decommissioning.
- 2023: Merger between two major decommissioning service providers in the North Sea. (Companies not specified due to lack of publicly available data)
- 2024: Successful completion of a large-scale deepwater decommissioning project using AI-powered monitoring. (Project details not available publicly.)
Strategic Outlook for Offshore Decommissioning Services Market Market
The Offshore Decommissioning Services market presents significant opportunities for companies that can adapt to evolving industry demands and proactively embrace technological innovation. Future growth will be driven by continued investment in automation, the development of sustainable decommissioning practices, and expansion into new geographic markets. Strategic partnerships and collaborations will be crucial for companies seeking to thrive in this dynamic sector. The increasing focus on recycling and repurposing of materials will lead to substantial value creation.
Offshore Decommissioning Services Market Segmentation
-
1. Water Depth
- 1.1. Shallow Water
- 1.2. Deepwater and Ultra-Deepwater
Offshore Decommissioning Services Market Segmentation By Geography
- 1. North America
- 2. Europe
- 3. Asia Pacific
- 4. South America
- 5. Middle East and Africa
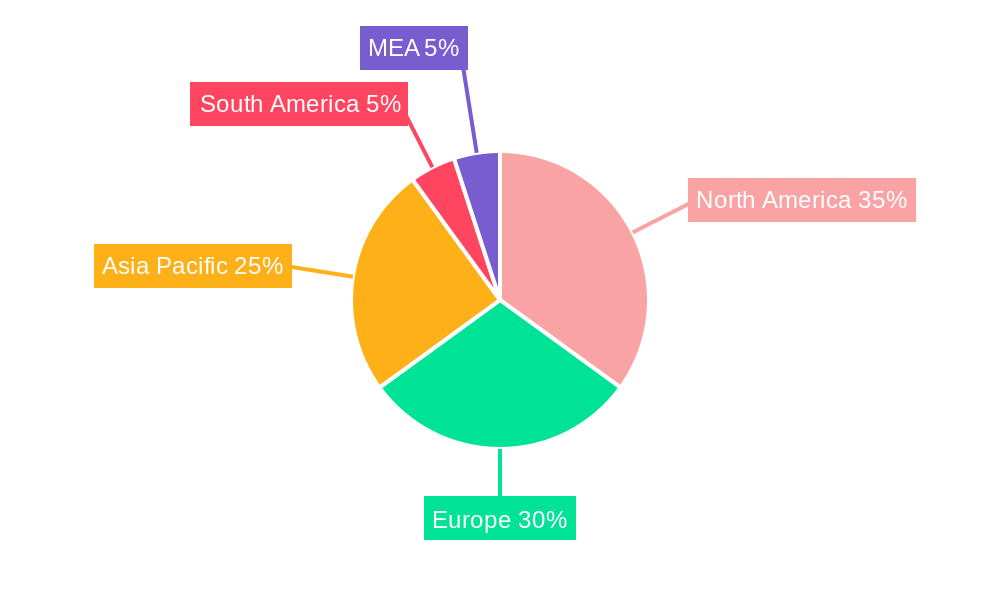
Offshore Decommissioning Services Market Regional Market Share
Geographic Coverage of Offshore Decommissioning Services Market
Offshore Decommissioning Services Market REPORT HIGHLIGHTS
| Aspects | Details |
|---|---|
| Study Period | 2020-2034 |
| Base Year | 2025 |
| Estimated Year | 2026 |
| Forecast Period | 2026-2034 |
| Historical Period | 2020-2025 |
| Growth Rate | CAGR of 6.5% from 2020-2034 |
| Segmentation |
|
Table of Contents
- 1. Introduction
- 1.1. Research Scope
- 1.2. Market Segmentation
- 1.3. Research Objective
- 1.4. Definitions and Assumptions
- 2. Executive Summary
- 2.1. Market Snapshot
- 3. Market Dynamics
- 3.1. Market Drivers
- 3.2. Market Restrains
- 3.3. Market Trends
- 3.4. Market Opportunities
- 4. Market Factor Analysis
- 4.1. Porters Five Forces
- 4.1.1. Bargaining Power of Suppliers
- 4.1.2. Bargaining Power of Buyers
- 4.1.3. Threat of New Entrants
- 4.1.4. Threat of Substitutes
- 4.1.5. Competitive Rivalry
- 4.2. PESTEL analysis
- 4.3. BCG Analysis
- 4.3.1. Stars (High Growth, High Market Share)
- 4.3.2. Cash Cows (Low Growth, High Market Share)
- 4.3.3. Question Mark (High Growth, Low Market Share)
- 4.3.4. Dogs (Low Growth, Low Market Share)
- 4.4. Ansoff Matrix Analysis
- 4.5. Supply Chain Analysis
- 4.6. Regulatory Landscape
- 4.7. Current Market Potential and Opportunity Assessment (TAM–SAM–SOM Framework)
- 4.8. MDP Analyst Note
- 4.1. Porters Five Forces
- 5. Market Analysis, Insights and Forecast 2021-2033
- 5.1. Market Analysis, Insights and Forecast - by Water Depth
- 5.1.1. Shallow Water
- 5.1.2. Deepwater and Ultra-Deepwater
- 5.2. Market Analysis, Insights and Forecast - by Region
- 5.2.1. North America
- 5.2.2. Europe
- 5.2.3. Asia Pacific
- 5.2.4. South America
- 5.2.5. Middle East and Africa
- 5.1. Market Analysis, Insights and Forecast - by Water Depth
- 6. Global Offshore Decommissioning Services Market Analysis, Insights and Forecast, 2021-2033
- 6.1. Market Analysis, Insights and Forecast - by Water Depth
- 6.1.1. Shallow Water
- 6.1.2. Deepwater and Ultra-Deepwater
- 6.1. Market Analysis, Insights and Forecast - by Water Depth
- 7. North America Offshore Decommissioning Services Market Analysis, Insights and Forecast, 2020-2032
- 7.1. Market Analysis, Insights and Forecast - by Water Depth
- 7.1.1. Shallow Water
- 7.1.2. Deepwater and Ultra-Deepwater
- 7.1. Market Analysis, Insights and Forecast - by Water Depth
- 8. Europe Offshore Decommissioning Services Market Analysis, Insights and Forecast, 2020-2032
- 8.1. Market Analysis, Insights and Forecast - by Water Depth
- 8.1.1. Shallow Water
- 8.1.2. Deepwater and Ultra-Deepwater
- 8.1. Market Analysis, Insights and Forecast - by Water Depth
- 9. Asia Pacific Offshore Decommissioning Services Market Analysis, Insights and Forecast, 2020-2032
- 9.1. Market Analysis, Insights and Forecast - by Water Depth
- 9.1.1. Shallow Water
- 9.1.2. Deepwater and Ultra-Deepwater
- 9.1. Market Analysis, Insights and Forecast - by Water Depth
- 10. South America Offshore Decommissioning Services Market Analysis, Insights and Forecast, 2020-2032
- 10.1. Market Analysis, Insights and Forecast - by Water Depth
- 10.1.1. Shallow Water
- 10.1.2. Deepwater and Ultra-Deepwater
- 10.1. Market Analysis, Insights and Forecast - by Water Depth
- 11. Middle East and Africa Offshore Decommissioning Services Market Analysis, Insights and Forecast, 2020-2032
- 11.1. Market Analysis, Insights and Forecast - by Water Depth
- 11.1.1. Shallow Water
- 11.1.2. Deepwater and Ultra-Deepwater
- 11.1. Market Analysis, Insights and Forecast - by Water Depth
- 12. Competitive Analysis
- 12.1. Company Profiles
- 12.1.1 Aker Solutions ASA
- 12.1.1.1. Company Overview
- 12.1.1.2. Products
- 12.1.1.3. Company Financials
- 12.1.1.4. SWOT Analysis
- 12.1.2 DNV GL
- 12.1.2.1. Company Overview
- 12.1.2.2. Products
- 12.1.2.3. Company Financials
- 12.1.2.4. SWOT Analysis
- 12.1.3 Heerema Marine Contractors (HMC)
- 12.1.3.1. Company Overview
- 12.1.3.2. Products
- 12.1.3.3. Company Financials
- 12.1.3.4. SWOT Analysis
- 12.1.4 AF Gruppen S A
- 12.1.4.1. Company Overview
- 12.1.4.2. Products
- 12.1.4.3. Company Financials
- 12.1.4.4. SWOT Analysis
- 12.1.5 Equinor ASA*List Not Exhaustive
- 12.1.5.1. Company Overview
- 12.1.5.2. Products
- 12.1.5.3. Company Financials
- 12.1.5.4. SWOT Analysis
- 12.1.6 Able UK
- 12.1.6.1. Company Overview
- 12.1.6.2. Products
- 12.1.6.3. Company Financials
- 12.1.6.4. SWOT Analysis
- 12.1.7 John Wood Group PLC
- 12.1.7.1. Company Overview
- 12.1.7.2. Products
- 12.1.7.3. Company Financials
- 12.1.7.4. SWOT Analysis
- 12.1.8 DeepOcean Group Holding B V
- 12.1.8.1. Company Overview
- 12.1.8.2. Products
- 12.1.8.3. Company Financials
- 12.1.8.4. SWOT Analysis
- 12.1.9 TechnipFMC PLC
- 12.1.9.1. Company Overview
- 12.1.9.2. Products
- 12.1.9.3. Company Financials
- 12.1.9.4. SWOT Analysis
- 12.1.10 Allseas Group
- 12.1.10.1. Company Overview
- 12.1.10.2. Products
- 12.1.10.3. Company Financials
- 12.1.10.4. SWOT Analysis
- 12.1.1 Aker Solutions ASA
- 12.2. Market Entropy
- 12.2.1 Company's Key Areas Served
- 12.2.2 Recent Developments
- 12.3. Company Market Share Analysis 2025
- 12.3.1 Top 5 Companies Market Share Analysis
- 12.3.2 Top 3 Companies Market Share Analysis
- 12.4. List of Potential Customers
- 13. Research Methodology
List of Figures
- Figure 1: Global Offshore Decommissioning Services Market Revenue Breakdown (billion, %) by Region 2025 & 2033
- Figure 2: North America Offshore Decommissioning Services Market Revenue (billion), by Water Depth 2025 & 2033
- Figure 3: North America Offshore Decommissioning Services Market Revenue Share (%), by Water Depth 2025 & 2033
- Figure 4: North America Offshore Decommissioning Services Market Revenue (billion), by Country 2025 & 2033
- Figure 5: North America Offshore Decommissioning Services Market Revenue Share (%), by Country 2025 & 2033
- Figure 6: Europe Offshore Decommissioning Services Market Revenue (billion), by Water Depth 2025 & 2033
- Figure 7: Europe Offshore Decommissioning Services Market Revenue Share (%), by Water Depth 2025 & 2033
- Figure 8: Europe Offshore Decommissioning Services Market Revenue (billion), by Country 2025 & 2033
- Figure 9: Europe Offshore Decommissioning Services Market Revenue Share (%), by Country 2025 & 2033
- Figure 10: Asia Pacific Offshore Decommissioning Services Market Revenue (billion), by Water Depth 2025 & 2033
- Figure 11: Asia Pacific Offshore Decommissioning Services Market Revenue Share (%), by Water Depth 2025 & 2033
- Figure 12: Asia Pacific Offshore Decommissioning Services Market Revenue (billion), by Country 2025 & 2033
- Figure 13: Asia Pacific Offshore Decommissioning Services Market Revenue Share (%), by Country 2025 & 2033
- Figure 14: South America Offshore Decommissioning Services Market Revenue (billion), by Water Depth 2025 & 2033
- Figure 15: South America Offshore Decommissioning Services Market Revenue Share (%), by Water Depth 2025 & 2033
- Figure 16: South America Offshore Decommissioning Services Market Revenue (billion), by Country 2025 & 2033
- Figure 17: South America Offshore Decommissioning Services Market Revenue Share (%), by Country 2025 & 2033
- Figure 18: Middle East and Africa Offshore Decommissioning Services Market Revenue (billion), by Water Depth 2025 & 2033
- Figure 19: Middle East and Africa Offshore Decommissioning Services Market Revenue Share (%), by Water Depth 2025 & 2033
- Figure 20: Middle East and Africa Offshore Decommissioning Services Market Revenue (billion), by Country 2025 & 2033
- Figure 21: Middle East and Africa Offshore Decommissioning Services Market Revenue Share (%), by Country 2025 & 2033
List of Tables
- Table 1: Global Offshore Decommissioning Services Market Revenue billion Forecast, by Water Depth 2020 & 2033
- Table 2: Global Offshore Decommissioning Services Market Revenue billion Forecast, by Region 2020 & 2033
- Table 3: Global Offshore Decommissioning Services Market Revenue billion Forecast, by Water Depth 2020 & 2033
- Table 4: Global Offshore Decommissioning Services Market Revenue billion Forecast, by Country 2020 & 2033
- Table 5: Global Offshore Decommissioning Services Market Revenue billion Forecast, by Water Depth 2020 & 2033
- Table 6: Global Offshore Decommissioning Services Market Revenue billion Forecast, by Country 2020 & 2033
- Table 7: Global Offshore Decommissioning Services Market Revenue billion Forecast, by Water Depth 2020 & 2033
- Table 8: Global Offshore Decommissioning Services Market Revenue billion Forecast, by Country 2020 & 2033
- Table 9: Global Offshore Decommissioning Services Market Revenue billion Forecast, by Water Depth 2020 & 2033
- Table 10: Global Offshore Decommissioning Services Market Revenue billion Forecast, by Country 2020 & 2033
- Table 11: Global Offshore Decommissioning Services Market Revenue billion Forecast, by Water Depth 2020 & 2033
- Table 12: Global Offshore Decommissioning Services Market Revenue billion Forecast, by Country 2020 & 2033
Frequently Asked Questions
1. What is the projected Compound Annual Growth Rate (CAGR) of the Offshore Decommissioning Services Market?
The projected CAGR is approximately 6.5%.
2. Which companies are prominent players in the Offshore Decommissioning Services Market?
Key companies in the market include Aker Solutions ASA, DNV GL, Heerema Marine Contractors (HMC), AF Gruppen S A, Equinor ASA*List Not Exhaustive, Able UK, John Wood Group PLC, DeepOcean Group Holding B V, TechnipFMC PLC, Allseas Group.
3. What are the main segments of the Offshore Decommissioning Services Market?
The market segments include Water Depth.
4. Can you provide details about the market size?
The market size is estimated to be USD 11.1 billion as of 2022.
5. What are some drivers contributing to market growth?
4.; Increasing Demand for Secure. Sustainable. and Clean Energy.
6. What are the notable trends driving market growth?
Shallow Water to Dominate the Market.
7. Are there any restraints impacting market growth?
4.; High Cost of Production of Biofuels.
8. Can you provide examples of recent developments in the market?
N/A
9. What pricing options are available for accessing the report?
Pricing options include single-user, multi-user, and enterprise licenses priced at USD 4750, USD 5250, and USD 8750 respectively.
10. Is the market size provided in terms of value or volume?
The market size is provided in terms of value, measured in billion.
11. Are there any specific market keywords associated with the report?
Yes, the market keyword associated with the report is "Offshore Decommissioning Services Market," which aids in identifying and referencing the specific market segment covered.
12. How do I determine which pricing option suits my needs best?
The pricing options vary based on user requirements and access needs. Individual users may opt for single-user licenses, while businesses requiring broader access may choose multi-user or enterprise licenses for cost-effective access to the report.
13. Are there any additional resources or data provided in the Offshore Decommissioning Services Market report?
While the report offers comprehensive insights, it's advisable to review the specific contents or supplementary materials provided to ascertain if additional resources or data are available.
14. How can I stay updated on further developments or reports in the Offshore Decommissioning Services Market?
To stay informed about further developments, trends, and reports in the Offshore Decommissioning Services Market, consider subscribing to industry newsletters, following relevant companies and organizations, or regularly checking reputable industry news sources and publications.
Methodology
Step 1 - Identification of Relevant Samples Size from Population Database


Step 2 - Approaches for Defining Global Market Size (Value, Volume* & Price*)

Note*: In applicable scenarios
Step 3 - Data Sources
Primary Research
- Web Analytics
- Survey Reports
- Research Institute
- Latest Research Reports
- Opinion Leaders
Secondary Research
- Annual Reports
- White Paper
- Latest Press Release
- Industry Association
- Paid Database
- Investor Presentations

Step 4 - Data Triangulation
Involves using different sources of information in order to increase the validity of a study
These sources are likely to be stakeholders in a program - participants, other researchers, program staff, other community members, and so on.
Then we put all data in single framework & apply various statistical tools to find out the dynamic on the market.
During the analysis stage, feedback from the stakeholder groups would be compared to determine areas of agreement as well as areas of divergence