

Key Insights
The nuclear reactor construction market is poised for robust expansion, with a projected Compound Annual Growth Rate (CAGR) of 2.47% from 2025 to 2033. This growth is underpinned by a global surge in demand for secure, low-carbon energy solutions. Nations are increasingly prioritizing nuclear power, especially in high-consumption regions with limited renewable alternatives. Technological advancements, including Small Modular Reactors (SMRs) and enhanced safety systems, further bolster nuclear energy's appeal. Supportive government policies, encompassing subsidies and streamlined regulations, are also key growth catalysts. Key industry participants such as Dongfang Electric, SKODA JS, Larsen & Toubro, and Westinghouse are actively driving market dynamics through competition and innovation. However, significant challenges persist, including substantial initial capital investment, public concerns regarding nuclear safety, and extended project development timelines. Fluctuations in raw material costs and geopolitical influences may also impact market trajectory. The market is segmented by service (equipment and auxiliary equipment installation), reactor type (Pressurized Water Reactor, Pressurized Heavy Water Reactor, Boiling Water Reactor, High-temperature Gas-cooled Reactor, and Liquid-metal Fast-Breeder Reactor), and geography. The Asia-Pacific region, particularly China, Japan, and India, is expected to lead growth due to escalating energy demands and ongoing nuclear plant development.
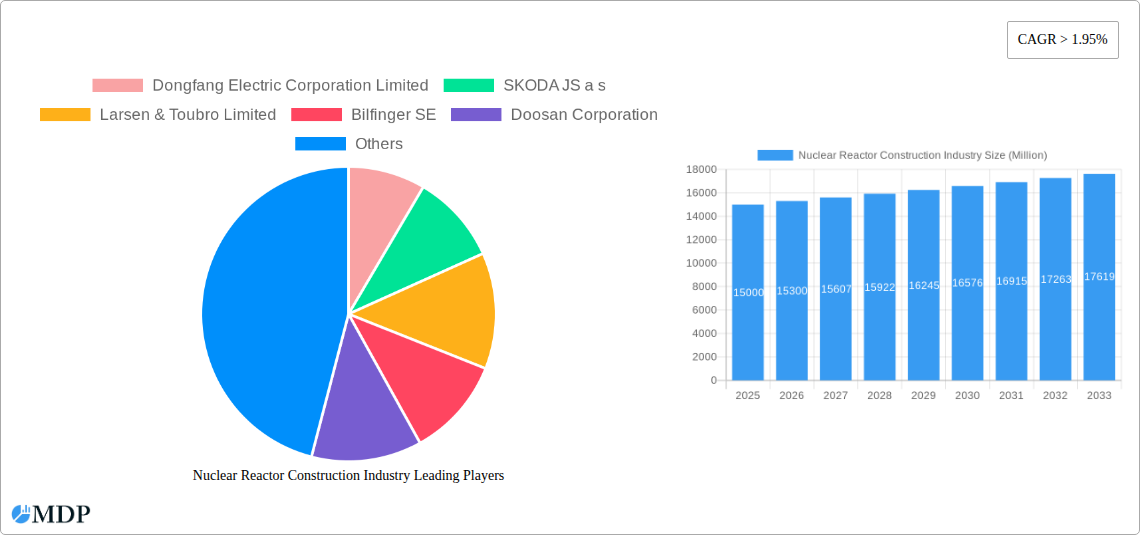
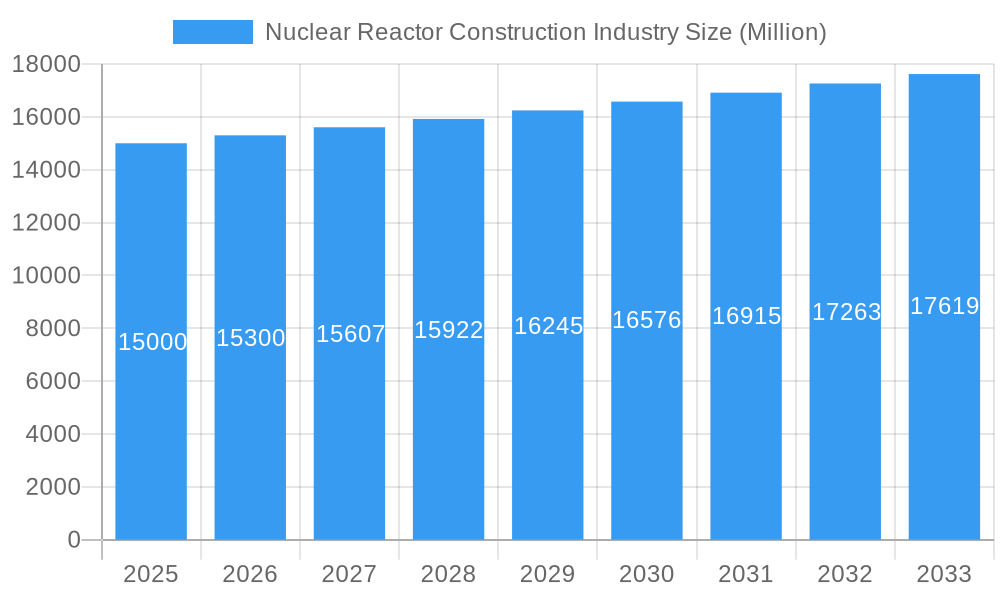
Nuclear Reactor Construction Industry Market Size (In Billion)
The competitive arena features a blend of established global corporations and state-owned enterprises. Strategic alliances, mergers, and acquisitions are anticipated to reshape the industry landscape as companies aim to solidify market share and enhance competitive advantages. Innovation in reactor design, emphasizing improved efficiency, safety, and waste management, will be critical for success. The market's future is intrinsically tied to global energy policy shifts, technological evolution, and the evolving regulatory frameworks in major markets. Close observation of these elements is crucial for accurate market forecasting. The estimated market size in 2025 is 7.73 billion.
Nuclear Reactor Construction Industry Company Market Share
Nuclear Reactor Construction Industry: Market Analysis & Forecast (2019-2033)
This comprehensive report provides a detailed analysis of the global nuclear reactor construction industry, offering invaluable insights for stakeholders, investors, and industry professionals. With a study period spanning 2019-2033, a base year of 2025, and a forecast period of 2025-2033, this report leverages historical data (2019-2024) to project future market trends and growth opportunities. The report covers key segments, leading players, and significant industry developments, providing a 360-degree view of this dynamic sector. Expect detailed analysis of market size (in Millions), CAGR, and market share, enabling informed decision-making.
Nuclear Reactor Construction Industry Market Dynamics & Concentration
The global nuclear reactor construction market is characterized by a moderately concentrated landscape, with a few major players holding significant market share. In 2025, the top five companies are estimated to hold approximately xx% of the global market, while the remaining market share is distributed among numerous smaller players and regional contractors. Market concentration is influenced by factors like technological expertise, financial capabilities, and regulatory compliance. Innovation is a key driver, with companies continuously investing in advanced reactor designs, improved safety features, and efficient construction methodologies. Stringent regulatory frameworks, varying by region, significantly impact market access and operational costs. The presence of substitute energy sources, such as renewable energy technologies, introduces competitive pressures. End-user trends towards sustainable and reliable energy sources create demand for nuclear power, particularly in regions experiencing energy security challenges. Mergers and acquisitions (M&A) activity has been relatively moderate in recent years, but strategic partnerships and joint ventures are becoming increasingly prevalent. In the period 2019-2024, approximately xx M&A deals were recorded, resulting in an estimated xx% increase in market consolidation.
- Market Concentration: Top 5 companies hold xx% market share in 2025.
- Innovation Drivers: Advanced reactor designs, safety features, efficient construction.
- Regulatory Frameworks: Stringent regulations vary significantly by region.
- Product Substitutes: Renewable energy sources pose competitive pressures.
- End-User Trends: Growing demand for reliable and sustainable energy.
- M&A Activity: Approximately xx M&A deals between 2019-2024, resulting in xx% increase in market consolidation.
Nuclear Reactor Construction Industry Industry Trends & Analysis
The nuclear reactor construction industry is experiencing a period of transformation driven by several key factors. Market growth is projected to reach xx Million by 2033, with a CAGR of xx% during the forecast period. Technological advancements, such as the development of Small Modular Reactors (SMRs), are driving innovation and efficiency gains. Consumer preferences are shifting towards cleaner and more reliable energy sources, boosting the appeal of nuclear power. Competitive dynamics are intense, with established players facing competition from emerging companies and new technologies. Market penetration of SMRs is expected to increase significantly, from xx% in 2025 to xx% by 2033. The increasing focus on energy security and the need to decarbonize energy systems are major growth catalysts. Furthermore, government policies and incentives supporting nuclear power are propelling market expansion in several regions. However, challenges remain, including high capital costs, regulatory complexities, and public perception. These factors are carefully considered in the forecast and analyzed in detail.
Leading Markets & Segments in Nuclear Reactor Construction Industry
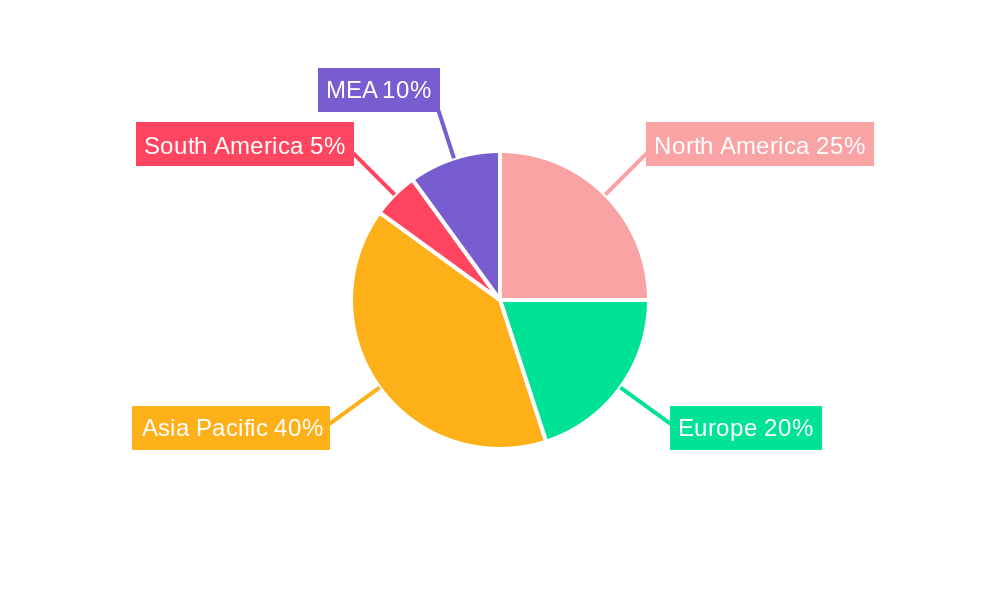
Asia-Pacific dominates the global nuclear reactor construction market, driven by strong economic growth, increasing energy demand, and supportive government policies in countries like India and China. Within segments, Pressurized Water Reactors (PWRs) and Pressurized Heavy Water Reactors (PHWRs) constitute the largest shares, with a combined market share of xx% in 2025. The equipment segment, encompassing reactors, turbines, and other critical components, holds the largest market share, while installation services are witnessing robust growth.
- Key Drivers in Asia-Pacific: Strong economic growth, rising energy demand, government support.
- Dominant Reactor Types: PWRs and PHWRs hold xx% combined market share in 2025.
- Leading Segments: Equipment and installation services are the largest segments.
- Other Reactor Types: Boiling Water Reactors (BWRs), High-temperature Gas-cooled Reactors (HTGRs), and Liquid-metal Fast-Breeder Reactors (LMFBRs) represent niche but growing markets.
Nuclear Reactor Construction Industry Product Developments
Recent advancements in reactor technology focus on improving safety, efficiency, and cost-effectiveness. The development of SMRs is a significant innovation, offering advantages in terms of scalability, modularity, and reduced construction times. These advancements are enhancing the competitive landscape by offering improved safety, reduced construction times and lower capital costs. The market is also witnessing the development of advanced fuel cycles and waste management solutions, addressing concerns about nuclear waste disposal.
Key Drivers of Nuclear Reactor Construction Industry Growth
The growth of the nuclear reactor construction industry is primarily driven by the increasing global demand for energy, concerns about climate change, and the need for reliable and baseload power sources. Governments in various countries are actively promoting nuclear power through policy support and financial incentives, further fueling the market's expansion. Technological advancements, such as SMRs, are also making nuclear power more viable and economically competitive.
Challenges in the Nuclear Reactor Construction Industry Market
The nuclear reactor construction industry faces several significant challenges, including high capital costs, lengthy construction timelines, stringent regulatory requirements, and concerns about nuclear safety and waste management. These challenges can lead to project delays and cost overruns, impacting the overall market growth. Supply chain disruptions can also affect the availability of necessary components and materials. Furthermore, public perception and acceptance of nuclear power continue to be crucial considerations.
Emerging Opportunities in Nuclear Reactor Construction Industry
The emergence of SMR technology presents a significant opportunity for the nuclear reactor construction industry, offering greater flexibility, reduced costs, and improved safety features. Strategic partnerships and collaborations among industry players are also creating new opportunities for innovation and market expansion. Growth in developing economies with rising energy demands offers considerable potential for market expansion.
Leading Players in the Nuclear Reactor Construction Industry Sector
- Dongfang Electric Corporation Limited
- SKODA JS a.s.
- Larsen & Toubro Limited
- Bilfinger SE
- Doosan Corporation
- China National Nuclear Corporation
- Shanghai Electric Group Company Limited
- KEPCO Engineering & Construction
- Westinghouse Electric Company LLC (Toshiba)
- Rosatom Corp
- Mitsubishi Heavy Industries Ltd
- GE-Hitachi Nuclear Energy Inc
Key Milestones in Nuclear Reactor Construction Industry Industry
- October 2022: The United States and Japan partnered with Ghana to support the deployment of Small Modular Reactors (SMRs), signifying growing international collaboration in the nuclear energy sector and a potential boost for SMR technology adoption in Africa.
- March 2022: India announced plans to build reactors in "fleet mode," indicating a significant increase in construction activity and potential market expansion for PHWR technology. This highlights India's commitment to expanding its nuclear energy capacity.
Strategic Outlook for Nuclear Reactor Construction Industry Market
The future of the nuclear reactor construction industry is promising, driven by the increasing need for clean and reliable energy sources, technological advancements, and supportive government policies. The growth of SMR technology and strategic collaborations will shape the market landscape in the coming years. Companies that can effectively adapt to evolving regulatory landscapes, embrace technological innovations, and address public concerns about nuclear safety will be well-positioned to capitalize on future opportunities and drive sustainable growth within this critical sector.
Nuclear Reactor Construction Industry Segmentation
-
1. Service
-
1.1. Equipment
- 1.1.1. Island Equipment
- 1.1.2. Auxiliary Equipment
- 1.2. Installation
-
1.1. Equipment
-
2. Reactor Type
- 2.1. Pressuri
- 2.2. Boiling Water Reactor
- 2.3. High-temperature Gas Cooled Reactor
- 2.4. Liquid-metal Fast-Breeder Reactor
Nuclear Reactor Construction Industry Segmentation By Geography
- 1. North America
- 2. Europe
- 3. Asia Pacific
- 4. South America
- 5. Middle East and Africa
Nuclear Reactor Construction Industry Regional Market Share
Geographic Coverage of Nuclear Reactor Construction Industry
Nuclear Reactor Construction Industry REPORT HIGHLIGHTS
| Aspects | Details |
|---|---|
| Study Period | 2020-2034 |
| Base Year | 2025 |
| Estimated Year | 2026 |
| Forecast Period | 2026-2034 |
| Historical Period | 2020-2025 |
| Growth Rate | CAGR of 2.47% from 2020-2034 |
| Segmentation |
|
Table of Contents
- 1. Introduction
- 1.1. Research Scope
- 1.2. Market Segmentation
- 1.3. Research Objective
- 1.4. Definitions and Assumptions
- 2. Executive Summary
- 2.1. Market Snapshot
- 3. Market Dynamics
- 3.1. Market Drivers
- 3.2. Market Restrains
- 3.3. Market Trends
- 3.4. Market Opportunities
- 4. Market Factor Analysis
- 4.1. Porters Five Forces
- 4.1.1. Bargaining Power of Suppliers
- 4.1.2. Bargaining Power of Buyers
- 4.1.3. Threat of New Entrants
- 4.1.4. Threat of Substitutes
- 4.1.5. Competitive Rivalry
- 4.2. PESTEL analysis
- 4.3. BCG Analysis
- 4.3.1. Stars (High Growth, High Market Share)
- 4.3.2. Cash Cows (Low Growth, High Market Share)
- 4.3.3. Question Mark (High Growth, Low Market Share)
- 4.3.4. Dogs (Low Growth, Low Market Share)
- 4.4. Ansoff Matrix Analysis
- 4.5. Supply Chain Analysis
- 4.6. Regulatory Landscape
- 4.7. Current Market Potential and Opportunity Assessment (TAM–SAM–SOM Framework)
- 4.8. MDP Analyst Note
- 4.1. Porters Five Forces
- 5. Market Analysis, Insights and Forecast 2021-2033
- 5.1. Market Analysis, Insights and Forecast - by Service
- 5.1.1. Equipment
- 5.1.1.1. Island Equipment
- 5.1.1.2. Auxiliary Equipment
- 5.1.2. Installation
- 5.1.1. Equipment
- 5.2. Market Analysis, Insights and Forecast - by Reactor Type
- 5.2.1. Pressuri
- 5.2.2. Boiling Water Reactor
- 5.2.3. High-temperature Gas Cooled Reactor
- 5.2.4. Liquid-metal Fast-Breeder Reactor
- 5.3. Market Analysis, Insights and Forecast - by Region
- 5.3.1. North America
- 5.3.2. Europe
- 5.3.3. Asia Pacific
- 5.3.4. South America
- 5.3.5. Middle East and Africa
- 5.1. Market Analysis, Insights and Forecast - by Service
- 6. Global Nuclear Reactor Construction Industry Analysis, Insights and Forecast, 2021-2033
- 6.1. Market Analysis, Insights and Forecast - by Service
- 6.1.1. Equipment
- 6.1.1.1. Island Equipment
- 6.1.1.2. Auxiliary Equipment
- 6.1.2. Installation
- 6.1.1. Equipment
- 6.2. Market Analysis, Insights and Forecast - by Reactor Type
- 6.2.1. Pressuri
- 6.2.2. Boiling Water Reactor
- 6.2.3. High-temperature Gas Cooled Reactor
- 6.2.4. Liquid-metal Fast-Breeder Reactor
- 6.1. Market Analysis, Insights and Forecast - by Service
- 7. North America Nuclear Reactor Construction Industry Analysis, Insights and Forecast, 2020-2032
- 7.1. Market Analysis, Insights and Forecast - by Service
- 7.1.1. Equipment
- 7.1.1.1. Island Equipment
- 7.1.1.2. Auxiliary Equipment
- 7.1.2. Installation
- 7.1.1. Equipment
- 7.2. Market Analysis, Insights and Forecast - by Reactor Type
- 7.2.1. Pressuri
- 7.2.2. Boiling Water Reactor
- 7.2.3. High-temperature Gas Cooled Reactor
- 7.2.4. Liquid-metal Fast-Breeder Reactor
- 7.1. Market Analysis, Insights and Forecast - by Service
- 8. Europe Nuclear Reactor Construction Industry Analysis, Insights and Forecast, 2020-2032
- 8.1. Market Analysis, Insights and Forecast - by Service
- 8.1.1. Equipment
- 8.1.1.1. Island Equipment
- 8.1.1.2. Auxiliary Equipment
- 8.1.2. Installation
- 8.1.1. Equipment
- 8.2. Market Analysis, Insights and Forecast - by Reactor Type
- 8.2.1. Pressuri
- 8.2.2. Boiling Water Reactor
- 8.2.3. High-temperature Gas Cooled Reactor
- 8.2.4. Liquid-metal Fast-Breeder Reactor
- 8.1. Market Analysis, Insights and Forecast - by Service
- 9. Asia Pacific Nuclear Reactor Construction Industry Analysis, Insights and Forecast, 2020-2032
- 9.1. Market Analysis, Insights and Forecast - by Service
- 9.1.1. Equipment
- 9.1.1.1. Island Equipment
- 9.1.1.2. Auxiliary Equipment
- 9.1.2. Installation
- 9.1.1. Equipment
- 9.2. Market Analysis, Insights and Forecast - by Reactor Type
- 9.2.1. Pressuri
- 9.2.2. Boiling Water Reactor
- 9.2.3. High-temperature Gas Cooled Reactor
- 9.2.4. Liquid-metal Fast-Breeder Reactor
- 9.1. Market Analysis, Insights and Forecast - by Service
- 10. South America Nuclear Reactor Construction Industry Analysis, Insights and Forecast, 2020-2032
- 10.1. Market Analysis, Insights and Forecast - by Service
- 10.1.1. Equipment
- 10.1.1.1. Island Equipment
- 10.1.1.2. Auxiliary Equipment
- 10.1.2. Installation
- 10.1.1. Equipment
- 10.2. Market Analysis, Insights and Forecast - by Reactor Type
- 10.2.1. Pressuri
- 10.2.2. Boiling Water Reactor
- 10.2.3. High-temperature Gas Cooled Reactor
- 10.2.4. Liquid-metal Fast-Breeder Reactor
- 10.1. Market Analysis, Insights and Forecast - by Service
- 11. Middle East and Africa Nuclear Reactor Construction Industry Analysis, Insights and Forecast, 2020-2032
- 11.1. Market Analysis, Insights and Forecast - by Service
- 11.1.1. Equipment
- 11.1.1.1. Island Equipment
- 11.1.1.2. Auxiliary Equipment
- 11.1.2. Installation
- 11.1.1. Equipment
- 11.2. Market Analysis, Insights and Forecast - by Reactor Type
- 11.2.1. Pressuri
- 11.2.2. Boiling Water Reactor
- 11.2.3. High-temperature Gas Cooled Reactor
- 11.2.4. Liquid-metal Fast-Breeder Reactor
- 11.1. Market Analysis, Insights and Forecast - by Service
- 12. Competitive Analysis
- 12.1. Company Profiles
- 12.1.1 Dongfang Electric Corporation Limited
- 12.1.1.1. Company Overview
- 12.1.1.2. Products
- 12.1.1.3. Company Financials
- 12.1.1.4. SWOT Analysis
- 12.1.2 SKODA JS a s
- 12.1.2.1. Company Overview
- 12.1.2.2. Products
- 12.1.2.3. Company Financials
- 12.1.2.4. SWOT Analysis
- 12.1.3 Larsen & Toubro Limited
- 12.1.3.1. Company Overview
- 12.1.3.2. Products
- 12.1.3.3. Company Financials
- 12.1.3.4. SWOT Analysis
- 12.1.4 Bilfinger SE
- 12.1.4.1. Company Overview
- 12.1.4.2. Products
- 12.1.4.3. Company Financials
- 12.1.4.4. SWOT Analysis
- 12.1.5 Doosan Corporation
- 12.1.5.1. Company Overview
- 12.1.5.2. Products
- 12.1.5.3. Company Financials
- 12.1.5.4. SWOT Analysis
- 12.1.6 China National Nuclear Corporation
- 12.1.6.1. Company Overview
- 12.1.6.2. Products
- 12.1.6.3. Company Financials
- 12.1.6.4. SWOT Analysis
- 12.1.7 Shanghai Electric Group Company Limited
- 12.1.7.1. Company Overview
- 12.1.7.2. Products
- 12.1.7.3. Company Financials
- 12.1.7.4. SWOT Analysis
- 12.1.8 KEPCO Engineering & Construction
- 12.1.8.1. Company Overview
- 12.1.8.2. Products
- 12.1.8.3. Company Financials
- 12.1.8.4. SWOT Analysis
- 12.1.9 Westinghouse Electric Company LLC (Toshiba)
- 12.1.9.1. Company Overview
- 12.1.9.2. Products
- 12.1.9.3. Company Financials
- 12.1.9.4. SWOT Analysis
- 12.1.10 Rosatom Corp*List Not Exhaustive
- 12.1.10.1. Company Overview
- 12.1.10.2. Products
- 12.1.10.3. Company Financials
- 12.1.10.4. SWOT Analysis
- 12.1.11 Mitsubishi Heavy Industries Ltd
- 12.1.11.1. Company Overview
- 12.1.11.2. Products
- 12.1.11.3. Company Financials
- 12.1.11.4. SWOT Analysis
- 12.1.12 GE-Hitachi Nuclear Energy Inc
- 12.1.12.1. Company Overview
- 12.1.12.2. Products
- 12.1.12.3. Company Financials
- 12.1.12.4. SWOT Analysis
- 12.1.1 Dongfang Electric Corporation Limited
- 12.2. Market Entropy
- 12.2.1 Company's Key Areas Served
- 12.2.2 Recent Developments
- 12.3. Company Market Share Analysis 2025
- 12.3.1 Top 5 Companies Market Share Analysis
- 12.3.2 Top 3 Companies Market Share Analysis
- 12.4. List of Potential Customers
- 13. Research Methodology
List of Figures
- Figure 1: Global Nuclear Reactor Construction Industry Revenue Breakdown (billion, %) by Region 2025 & 2033
- Figure 2: North America Nuclear Reactor Construction Industry Revenue (billion), by Service 2025 & 2033
- Figure 3: North America Nuclear Reactor Construction Industry Revenue Share (%), by Service 2025 & 2033
- Figure 4: North America Nuclear Reactor Construction Industry Revenue (billion), by Reactor Type 2025 & 2033
- Figure 5: North America Nuclear Reactor Construction Industry Revenue Share (%), by Reactor Type 2025 & 2033
- Figure 6: North America Nuclear Reactor Construction Industry Revenue (billion), by Country 2025 & 2033
- Figure 7: North America Nuclear Reactor Construction Industry Revenue Share (%), by Country 2025 & 2033
- Figure 8: Europe Nuclear Reactor Construction Industry Revenue (billion), by Service 2025 & 2033
- Figure 9: Europe Nuclear Reactor Construction Industry Revenue Share (%), by Service 2025 & 2033
- Figure 10: Europe Nuclear Reactor Construction Industry Revenue (billion), by Reactor Type 2025 & 2033
- Figure 11: Europe Nuclear Reactor Construction Industry Revenue Share (%), by Reactor Type 2025 & 2033
- Figure 12: Europe Nuclear Reactor Construction Industry Revenue (billion), by Country 2025 & 2033
- Figure 13: Europe Nuclear Reactor Construction Industry Revenue Share (%), by Country 2025 & 2033
- Figure 14: Asia Pacific Nuclear Reactor Construction Industry Revenue (billion), by Service 2025 & 2033
- Figure 15: Asia Pacific Nuclear Reactor Construction Industry Revenue Share (%), by Service 2025 & 2033
- Figure 16: Asia Pacific Nuclear Reactor Construction Industry Revenue (billion), by Reactor Type 2025 & 2033
- Figure 17: Asia Pacific Nuclear Reactor Construction Industry Revenue Share (%), by Reactor Type 2025 & 2033
- Figure 18: Asia Pacific Nuclear Reactor Construction Industry Revenue (billion), by Country 2025 & 2033
- Figure 19: Asia Pacific Nuclear Reactor Construction Industry Revenue Share (%), by Country 2025 & 2033
- Figure 20: South America Nuclear Reactor Construction Industry Revenue (billion), by Service 2025 & 2033
- Figure 21: South America Nuclear Reactor Construction Industry Revenue Share (%), by Service 2025 & 2033
- Figure 22: South America Nuclear Reactor Construction Industry Revenue (billion), by Reactor Type 2025 & 2033
- Figure 23: South America Nuclear Reactor Construction Industry Revenue Share (%), by Reactor Type 2025 & 2033
- Figure 24: South America Nuclear Reactor Construction Industry Revenue (billion), by Country 2025 & 2033
- Figure 25: South America Nuclear Reactor Construction Industry Revenue Share (%), by Country 2025 & 2033
- Figure 26: Middle East and Africa Nuclear Reactor Construction Industry Revenue (billion), by Service 2025 & 2033
- Figure 27: Middle East and Africa Nuclear Reactor Construction Industry Revenue Share (%), by Service 2025 & 2033
- Figure 28: Middle East and Africa Nuclear Reactor Construction Industry Revenue (billion), by Reactor Type 2025 & 2033
- Figure 29: Middle East and Africa Nuclear Reactor Construction Industry Revenue Share (%), by Reactor Type 2025 & 2033
- Figure 30: Middle East and Africa Nuclear Reactor Construction Industry Revenue (billion), by Country 2025 & 2033
- Figure 31: Middle East and Africa Nuclear Reactor Construction Industry Revenue Share (%), by Country 2025 & 2033
List of Tables
- Table 1: Global Nuclear Reactor Construction Industry Revenue billion Forecast, by Service 2020 & 2033
- Table 2: Global Nuclear Reactor Construction Industry Revenue billion Forecast, by Reactor Type 2020 & 2033
- Table 3: Global Nuclear Reactor Construction Industry Revenue billion Forecast, by Region 2020 & 2033
- Table 4: Global Nuclear Reactor Construction Industry Revenue billion Forecast, by Service 2020 & 2033
- Table 5: Global Nuclear Reactor Construction Industry Revenue billion Forecast, by Reactor Type 2020 & 2033
- Table 6: Global Nuclear Reactor Construction Industry Revenue billion Forecast, by Country 2020 & 2033
- Table 7: Global Nuclear Reactor Construction Industry Revenue billion Forecast, by Service 2020 & 2033
- Table 8: Global Nuclear Reactor Construction Industry Revenue billion Forecast, by Reactor Type 2020 & 2033
- Table 9: Global Nuclear Reactor Construction Industry Revenue billion Forecast, by Country 2020 & 2033
- Table 10: Global Nuclear Reactor Construction Industry Revenue billion Forecast, by Service 2020 & 2033
- Table 11: Global Nuclear Reactor Construction Industry Revenue billion Forecast, by Reactor Type 2020 & 2033
- Table 12: Global Nuclear Reactor Construction Industry Revenue billion Forecast, by Country 2020 & 2033
- Table 13: Global Nuclear Reactor Construction Industry Revenue billion Forecast, by Service 2020 & 2033
- Table 14: Global Nuclear Reactor Construction Industry Revenue billion Forecast, by Reactor Type 2020 & 2033
- Table 15: Global Nuclear Reactor Construction Industry Revenue billion Forecast, by Country 2020 & 2033
- Table 16: Global Nuclear Reactor Construction Industry Revenue billion Forecast, by Service 2020 & 2033
- Table 17: Global Nuclear Reactor Construction Industry Revenue billion Forecast, by Reactor Type 2020 & 2033
- Table 18: Global Nuclear Reactor Construction Industry Revenue billion Forecast, by Country 2020 & 2033
Frequently Asked Questions
1. What is the projected Compound Annual Growth Rate (CAGR) of the Nuclear Reactor Construction Industry?
The projected CAGR is approximately 2.47%.
2. Which companies are prominent players in the Nuclear Reactor Construction Industry?
Key companies in the market include Dongfang Electric Corporation Limited, SKODA JS a s, Larsen & Toubro Limited, Bilfinger SE, Doosan Corporation, China National Nuclear Corporation, Shanghai Electric Group Company Limited, KEPCO Engineering & Construction, Westinghouse Electric Company LLC (Toshiba), Rosatom Corp*List Not Exhaustive, Mitsubishi Heavy Industries Ltd, GE-Hitachi Nuclear Energy Inc.
3. What are the main segments of the Nuclear Reactor Construction Industry?
The market segments include Service, Reactor Type.
4. Can you provide details about the market size?
The market size is estimated to be USD 7.73 billion as of 2022.
5. What are some drivers contributing to market growth?
4.; Rising Demand for Reliable Electricity4.; Increasing Government Support for Hydropower Gneeration.
6. What are the notable trends driving market growth?
Pressurized Water Reactor to Dominate the Market.
7. Are there any restraints impacting market growth?
4.; Negative Environmental Consequences of Hydropower Projects.
8. Can you provide examples of recent developments in the market?
October 2022: The United States and Japan announced a partnership with Ghana at the International Atomic Energy Agency Nuclear Power Ministerial Conference in Washington, DC, to support its goal of leading Africa to deploy small modular reactors. Since Ghana's nuclear power program is currently technology neutral, the collaboration will facilitate the deployment of Small Modular Reactor (SMR) technology in Ghana.
9. What pricing options are available for accessing the report?
Pricing options include single-user, multi-user, and enterprise licenses priced at USD 4750, USD 5250, and USD 8750 respectively.
10. Is the market size provided in terms of value or volume?
The market size is provided in terms of value, measured in billion.
11. Are there any specific market keywords associated with the report?
Yes, the market keyword associated with the report is "Nuclear Reactor Construction Industry," which aids in identifying and referencing the specific market segment covered.
12. How do I determine which pricing option suits my needs best?
The pricing options vary based on user requirements and access needs. Individual users may opt for single-user licenses, while businesses requiring broader access may choose multi-user or enterprise licenses for cost-effective access to the report.
13. Are there any additional resources or data provided in the Nuclear Reactor Construction Industry report?
While the report offers comprehensive insights, it's advisable to review the specific contents or supplementary materials provided to ascertain if additional resources or data are available.
14. How can I stay updated on further developments or reports in the Nuclear Reactor Construction Industry?
To stay informed about further developments, trends, and reports in the Nuclear Reactor Construction Industry, consider subscribing to industry newsletters, following relevant companies and organizations, or regularly checking reputable industry news sources and publications.
Methodology
Step 1 - Identification of Relevant Samples Size from Population Database


Step 2 - Approaches for Defining Global Market Size (Value, Volume* & Price*)

Note*: In applicable scenarios
Step 3 - Data Sources
Primary Research
- Web Analytics
- Survey Reports
- Research Institute
- Latest Research Reports
- Opinion Leaders
Secondary Research
- Annual Reports
- White Paper
- Latest Press Release
- Industry Association
- Paid Database
- Investor Presentations

Step 4 - Data Triangulation
Involves using different sources of information in order to increase the validity of a study
These sources are likely to be stakeholders in a program - participants, other researchers, program staff, other community members, and so on.
Then we put all data in single framework & apply various statistical tools to find out the dynamic on the market.
During the analysis stage, feedback from the stakeholder groups would be compared to determine areas of agreement as well as areas of divergence