

Key Insights
The MEA Power Rental Industry is poised for substantial growth, propelled by escalating infrastructure development, dynamic energy demand shifts, and the increasing adoption of temporary power solutions across key sectors. The market is projected to achieve a Compound Annual Growth Rate (CAGR) of 5.4%, reaching an estimated market size of 2.17 billion by the base year 2025. Significant drivers include the robust construction sector, particularly in the UAE and Saudi Arabia, necessitating reliable temporary power for project lifecycles. The oil and gas industry's need for dependable backup power, alongside the demand for emergency and remote power solutions, further fuels market expansion. Prime power rental applications lead the market, followed by peak shaving and emergency standby services. Natural gas generators are favored for their cost-effectiveness and environmental advantages over diesel alternatives. Leading entities such as Aggreko Middle East Ltd and Jubaili Bros LLC are strategically positioned to leverage this growth by offering comprehensive rental solutions. Despite challenges like fluctuating fuel prices and evolving regulations, the market outlook remains optimistic, with ongoing infrastructure investments expected to sustain demand through the forecast period (2025-2033). Competitive intensity is moderate, characterized by service portfolio expansion from established players and niche market entry by new competitors.
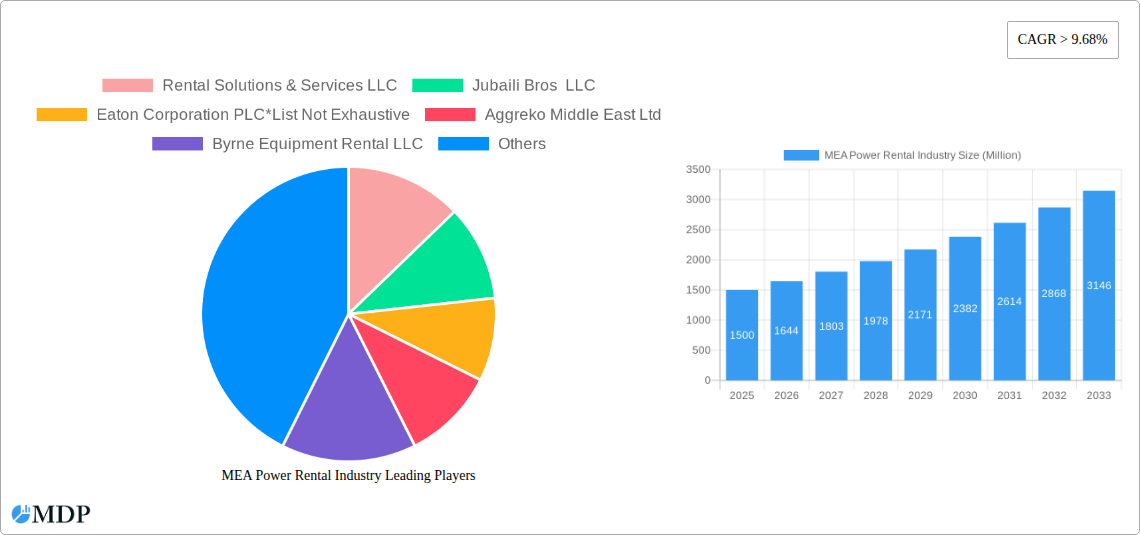
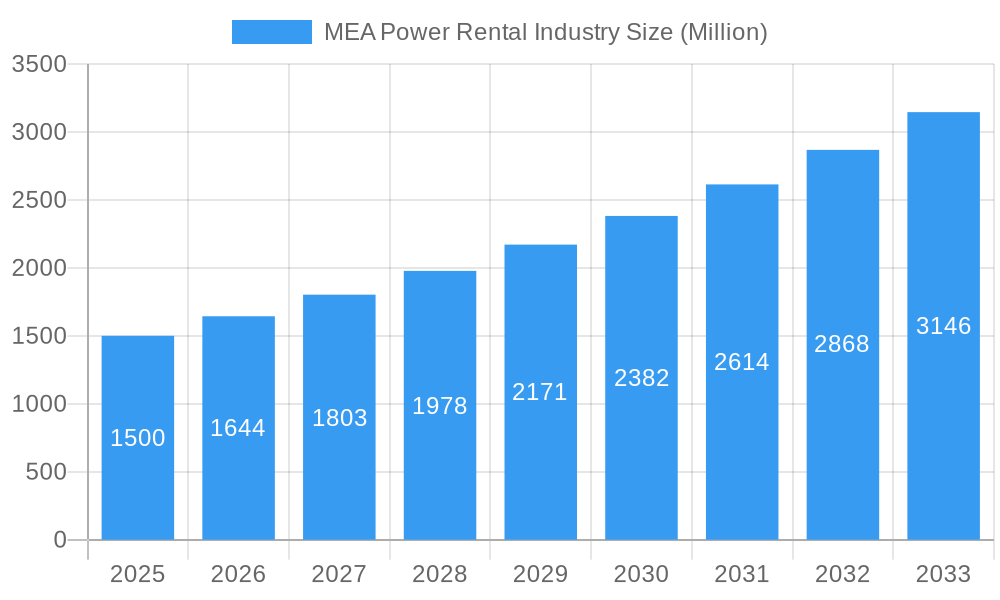
MEA Power Rental Industry Market Size (In Billion)
The MEA Power Rental market forecast indicates sustained expansion from 2025 to 2033. This growth is underpinned by government-led initiatives promoting economic diversification and sustainable infrastructure development throughout the region. The integration of renewable energy sources presents long-term opportunities for hybrid power rental solutions. Industry participants are investing in advanced technologies to improve efficiency, minimize environmental impact, and deliver tailored solutions. Operational efficiency and cost optimization are critical for maintaining competitive advantage. Geographic expansion, especially in underdeveloped markets with high growth potential, represents a key strategic imperative. Regional disparities in demand and regulatory frameworks will continue to influence market dynamics, demanding agile and adaptable business strategies from market players.
MEA Power Rental Industry Company Market Share
MEA Power Rental Industry Report: 2019-2033 Forecast
Unlocking Growth Opportunities in the Thriving Middle East & Africa Power Rental Market
This comprehensive report provides an in-depth analysis of the MEA Power Rental Industry, offering invaluable insights for investors, industry stakeholders, and strategic decision-makers. With a detailed forecast spanning from 2019 to 2033, this study illuminates the market dynamics, key players, and emerging trends shaping this rapidly expanding sector. The report covers a market valued at over $XX Million in 2025 and projects significant growth throughout the forecast period.
MEA Power Rental Industry Market Dynamics & Concentration
The MEA power rental market exhibits a moderately concentrated landscape, with key players like Aggreko Middle East Ltd, Byrne Equipment Rental LLC, and Jubaili Bros LLC holding significant market share. However, the entry of smaller, specialized rental companies and the increasing adoption of innovative technologies are fostering competition. Market concentration is estimated at xx% in 2025, driven by the dominance of a few large players. Regulatory frameworks, particularly concerning environmental regulations and safety standards, are impacting market dynamics. The rising demand for reliable power solutions across various sectors, coupled with increasing infrastructure development, is driving market growth. Furthermore, mergers and acquisitions (M&A) activity, although currently at a moderate level (xx deals in the last 5 years), is expected to increase as larger players seek to consolidate their market positions and expand their service offerings.
- Market Concentration: xx% in 2025
- M&A Deal Count (2020-2024): xx
- Key Innovation Drivers: Technological advancements, environmental regulations, and demand for specialized solutions.
- Regulatory Frameworks: Stringent safety and environmental standards.
- Product Substitutes: Alternative energy sources and grid-connected power solutions.
- End-User Trends: Increasing demand from utilities, Oil and Gas, and construction sectors.
MEA Power Rental Industry Industry Trends & Analysis
The MEA power rental market is experiencing robust growth, fueled by several key factors. The region's rapid economic development, coupled with expanding urbanization and industrialization, is driving a surge in demand for reliable power solutions. The construction sector, in particular, is a major driver, as numerous infrastructure projects require temporary power solutions. Technological advancements in power generation and rental equipment are also contributing to market growth, with a focus on efficiency, fuel flexibility, and reduced emissions. The market is projected to witness a Compound Annual Growth Rate (CAGR) of xx% from 2025 to 2033. Market penetration of rental power solutions, currently estimated at xx%, is expected to increase significantly due to the cost-effectiveness and flexibility offered by rental models compared to outright purchase. The increasing adoption of natural gas-powered generators also reflects a shift towards environmentally friendlier solutions.
Leading Markets & Segments in MEA Power Rental Industry
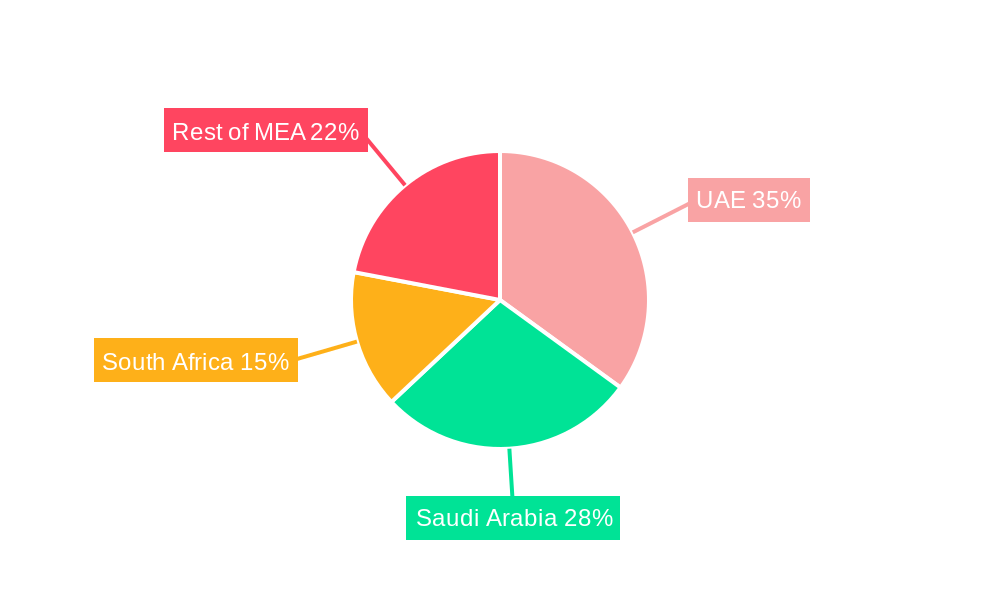
The UAE and Saudi Arabia represent the largest markets within the MEA region, driven by extensive infrastructure development and large-scale energy projects. The Oil and Gas sector remains a significant end-user, demanding substantial power rental solutions for exploration and production activities. The Prime Power segment constitutes the largest application segment, driven by the continuous demand for primary power sources across industries.
- Dominant Region: UAE and Saudi Arabia
- Dominant End-User: Oil and Gas, followed by Construction and Utilities.
- Dominant Application: Prime Power
- Dominant Fuel Type: Diesel, although Natural Gas is witnessing growing adoption.
- Key Drivers:
- Rapid economic growth
- Infrastructure development projects
- Growing Oil and Gas exploration and production activities
- Stringent power reliability standards
MEA Power Rental Industry Product Developments
Significant advancements are witnessed in generator technology, with a focus on enhancing fuel efficiency, reducing emissions, and integrating advanced monitoring systems. The industry is witnessing the introduction of more environmentally friendly solutions, such as natural gas-powered generators and hybrid systems. These developments are driven by increasing environmental regulations and a growing demand for sustainable power solutions. The focus is on providing tailored rental solutions that offer improved reliability, fuel efficiency, and reduced environmental impact.
Key Drivers of MEA Power Rental Industry Growth
Several factors contribute to the growth of the MEA power rental industry. These include robust economic growth across the region, increasing infrastructure development, and the expansion of various industrial sectors. Government initiatives supporting infrastructure projects and energy diversification are also significant drivers. The rising demand for reliable power in remote areas and for events further fuels the growth.
Challenges in the MEA Power Rental Industry Market
The MEA power rental market faces challenges such as fluctuating fuel prices, political instability in certain regions, and competition from alternative power solutions. Supply chain disruptions and the need for skilled technicians are also noteworthy hurdles. These factors create uncertainties in pricing and availability of equipment, potentially impacting market growth. The competitive landscape is intensifying, leading to pressure on margins.
Emerging Opportunities in MEA Power Rental Industry
Significant opportunities lie in expanding into renewable energy solutions, partnering with technology providers for smart power management systems, and focusing on specialized rental services catering to niche sectors. Market expansion into underserved regions with limited grid access also presents a growth avenue. The adoption of advanced technologies like digital monitoring and remote diagnostics offers significant potential for improved efficiency and customer service.
Leading Players in the MEA Power Rental Industry Sector
- Rental Solutions & Services LLC (If URL exists; otherwise replace with only the company name)
- Jubaili Bros LLC
- Eaton Corporation PLC
- Aggreko Middle East Ltd
- Byrne Equipment Rental LLC
- Jozi Power Limited
- SES SMART Energy Solutions FZCO
- KPS Power Generation
- Peax Equipment Rental
Key Milestones in MEA Power Rental Industry Industry
- 2020: Introduction of new, more fuel-efficient generator models by Aggreko Middle East.
- 2022: Jubaili Bros LLC expands operations into a new region.
- 2023: A major M&A deal involving two leading players in the Saudi Arabian market. (Further details needed for actual milestones)
Strategic Outlook for MEA Power Rental Industry Market
The MEA power rental market holds significant long-term growth potential. Continued investment in infrastructure, coupled with technological advancements and a focus on sustainability, will drive market expansion. Strategic partnerships, focused product development, and expansion into new markets will be key success factors for players in this sector. The market is expected to experience continued growth driven by strong demand and ongoing infrastructure developments, particularly within the renewable energy space.
MEA Power Rental Industry Segmentation
-
1. End-User
- 1.1. Utilities
- 1.2. Oil and Gas
- 1.3. Construction
- 1.4. Other End-Users
-
2. Fuel Type
- 2.1. Natural Gas
- 2.2. Diesel
-
3. Application
- 3.1. Prime Power
- 3.2. Peak Shaving
- 3.3. Emergency Standby
-
4. Geography
- 4.1. South Africa
- 4.2. Saudi Arabia
- 4.3. United Arab Emirates
- 4.4. Rest of Middle East and Africa
MEA Power Rental Industry Segmentation By Geography
- 1. South Africa
- 2. Saudi Arabia
- 3. United Arab Emirates
- 4. Rest of Middle East and Africa
MEA Power Rental Industry Regional Market Share
Geographic Coverage of MEA Power Rental Industry
MEA Power Rental Industry REPORT HIGHLIGHTS
| Aspects | Details |
|---|---|
| Study Period | 2020-2034 |
| Base Year | 2025 |
| Estimated Year | 2026 |
| Forecast Period | 2026-2034 |
| Historical Period | 2020-2025 |
| Growth Rate | CAGR of 5.4% from 2020-2034 |
| Segmentation |
|
Table of Contents
- 1. Introduction
- 1.1. Research Scope
- 1.2. Market Segmentation
- 1.3. Research Objective
- 1.4. Definitions and Assumptions
- 2. Executive Summary
- 2.1. Market Snapshot
- 3. Market Dynamics
- 3.1. Market Drivers
- 3.2. Market Restrains
- 3.3. Market Trends
- 3.4. Market Opportunities
- 4. Market Factor Analysis
- 4.1. Porters Five Forces
- 4.1.1. Bargaining Power of Suppliers
- 4.1.2. Bargaining Power of Buyers
- 4.1.3. Threat of New Entrants
- 4.1.4. Threat of Substitutes
- 4.1.5. Competitive Rivalry
- 4.2. PESTEL analysis
- 4.3. BCG Analysis
- 4.3.1. Stars (High Growth, High Market Share)
- 4.3.2. Cash Cows (Low Growth, High Market Share)
- 4.3.3. Question Mark (High Growth, Low Market Share)
- 4.3.4. Dogs (Low Growth, Low Market Share)
- 4.4. Ansoff Matrix Analysis
- 4.5. Supply Chain Analysis
- 4.6. Regulatory Landscape
- 4.7. Current Market Potential and Opportunity Assessment (TAM–SAM–SOM Framework)
- 4.8. MDP Analyst Note
- 4.1. Porters Five Forces
- 5. Market Analysis, Insights and Forecast 2021-2033
- 5.1. Market Analysis, Insights and Forecast - by End-User
- 5.1.1. Utilities
- 5.1.2. Oil and Gas
- 5.1.3. Construction
- 5.1.4. Other End-Users
- 5.2. Market Analysis, Insights and Forecast - by Fuel Type
- 5.2.1. Natural Gas
- 5.2.2. Diesel
- 5.3. Market Analysis, Insights and Forecast - by Application
- 5.3.1. Prime Power
- 5.3.2. Peak Shaving
- 5.3.3. Emergency Standby
- 5.4. Market Analysis, Insights and Forecast - by Geography
- 5.4.1. South Africa
- 5.4.2. Saudi Arabia
- 5.4.3. United Arab Emirates
- 5.4.4. Rest of Middle East and Africa
- 5.5. Market Analysis, Insights and Forecast - by Region
- 5.5.1. South Africa
- 5.5.2. Saudi Arabia
- 5.5.3. United Arab Emirates
- 5.5.4. Rest of Middle East and Africa
- 5.1. Market Analysis, Insights and Forecast - by End-User
- 6. Global MEA Power Rental Industry Analysis, Insights and Forecast, 2021-2033
- 6.1. Market Analysis, Insights and Forecast - by End-User
- 6.1.1. Utilities
- 6.1.2. Oil and Gas
- 6.1.3. Construction
- 6.1.4. Other End-Users
- 6.2. Market Analysis, Insights and Forecast - by Fuel Type
- 6.2.1. Natural Gas
- 6.2.2. Diesel
- 6.3. Market Analysis, Insights and Forecast - by Application
- 6.3.1. Prime Power
- 6.3.2. Peak Shaving
- 6.3.3. Emergency Standby
- 6.4. Market Analysis, Insights and Forecast - by Geography
- 6.4.1. South Africa
- 6.4.2. Saudi Arabia
- 6.4.3. United Arab Emirates
- 6.4.4. Rest of Middle East and Africa
- 6.1. Market Analysis, Insights and Forecast - by End-User
- 7. South Africa MEA Power Rental Industry Analysis, Insights and Forecast, 2020-2032
- 7.1. Market Analysis, Insights and Forecast - by End-User
- 7.1.1. Utilities
- 7.1.2. Oil and Gas
- 7.1.3. Construction
- 7.1.4. Other End-Users
- 7.2. Market Analysis, Insights and Forecast - by Fuel Type
- 7.2.1. Natural Gas
- 7.2.2. Diesel
- 7.3. Market Analysis, Insights and Forecast - by Application
- 7.3.1. Prime Power
- 7.3.2. Peak Shaving
- 7.3.3. Emergency Standby
- 7.4. Market Analysis, Insights and Forecast - by Geography
- 7.4.1. South Africa
- 7.4.2. Saudi Arabia
- 7.4.3. United Arab Emirates
- 7.4.4. Rest of Middle East and Africa
- 7.1. Market Analysis, Insights and Forecast - by End-User
- 8. Saudi Arabia MEA Power Rental Industry Analysis, Insights and Forecast, 2020-2032
- 8.1. Market Analysis, Insights and Forecast - by End-User
- 8.1.1. Utilities
- 8.1.2. Oil and Gas
- 8.1.3. Construction
- 8.1.4. Other End-Users
- 8.2. Market Analysis, Insights and Forecast - by Fuel Type
- 8.2.1. Natural Gas
- 8.2.2. Diesel
- 8.3. Market Analysis, Insights and Forecast - by Application
- 8.3.1. Prime Power
- 8.3.2. Peak Shaving
- 8.3.3. Emergency Standby
- 8.4. Market Analysis, Insights and Forecast - by Geography
- 8.4.1. South Africa
- 8.4.2. Saudi Arabia
- 8.4.3. United Arab Emirates
- 8.4.4. Rest of Middle East and Africa
- 8.1. Market Analysis, Insights and Forecast - by End-User
- 9. United Arab Emirates MEA Power Rental Industry Analysis, Insights and Forecast, 2020-2032
- 9.1. Market Analysis, Insights and Forecast - by End-User
- 9.1.1. Utilities
- 9.1.2. Oil and Gas
- 9.1.3. Construction
- 9.1.4. Other End-Users
- 9.2. Market Analysis, Insights and Forecast - by Fuel Type
- 9.2.1. Natural Gas
- 9.2.2. Diesel
- 9.3. Market Analysis, Insights and Forecast - by Application
- 9.3.1. Prime Power
- 9.3.2. Peak Shaving
- 9.3.3. Emergency Standby
- 9.4. Market Analysis, Insights and Forecast - by Geography
- 9.4.1. South Africa
- 9.4.2. Saudi Arabia
- 9.4.3. United Arab Emirates
- 9.4.4. Rest of Middle East and Africa
- 9.1. Market Analysis, Insights and Forecast - by End-User
- 10. Rest of Middle East and Africa MEA Power Rental Industry Analysis, Insights and Forecast, 2020-2032
- 10.1. Market Analysis, Insights and Forecast - by End-User
- 10.1.1. Utilities
- 10.1.2. Oil and Gas
- 10.1.3. Construction
- 10.1.4. Other End-Users
- 10.2. Market Analysis, Insights and Forecast - by Fuel Type
- 10.2.1. Natural Gas
- 10.2.2. Diesel
- 10.3. Market Analysis, Insights and Forecast - by Application
- 10.3.1. Prime Power
- 10.3.2. Peak Shaving
- 10.3.3. Emergency Standby
- 10.4. Market Analysis, Insights and Forecast - by Geography
- 10.4.1. South Africa
- 10.4.2. Saudi Arabia
- 10.4.3. United Arab Emirates
- 10.4.4. Rest of Middle East and Africa
- 10.1. Market Analysis, Insights and Forecast - by End-User
- 11. Competitive Analysis
- 11.1. Company Profiles
- 11.1.1 Rental Solutions & Services LLC
- 11.1.1.1. Company Overview
- 11.1.1.2. Products
- 11.1.1.3. Company Financials
- 11.1.1.4. SWOT Analysis
- 11.1.2 Jubaili Bros LLC
- 11.1.2.1. Company Overview
- 11.1.2.2. Products
- 11.1.2.3. Company Financials
- 11.1.2.4. SWOT Analysis
- 11.1.3 Eaton Corporation PLC*List Not Exhaustive
- 11.1.3.1. Company Overview
- 11.1.3.2. Products
- 11.1.3.3. Company Financials
- 11.1.3.4. SWOT Analysis
- 11.1.4 Aggreko Middle East Ltd
- 11.1.4.1. Company Overview
- 11.1.4.2. Products
- 11.1.4.3. Company Financials
- 11.1.4.4. SWOT Analysis
- 11.1.5 Byrne Equipment Rental LLC
- 11.1.5.1. Company Overview
- 11.1.5.2. Products
- 11.1.5.3. Company Financials
- 11.1.5.4. SWOT Analysis
- 11.1.6 Jozi Power Limited
- 11.1.6.1. Company Overview
- 11.1.6.2. Products
- 11.1.6.3. Company Financials
- 11.1.6.4. SWOT Analysis
- 11.1.7 SES SMART Energy Solutions FZCO
- 11.1.7.1. Company Overview
- 11.1.7.2. Products
- 11.1.7.3. Company Financials
- 11.1.7.4. SWOT Analysis
- 11.1.8 KPS Power Generation
- 11.1.8.1. Company Overview
- 11.1.8.2. Products
- 11.1.8.3. Company Financials
- 11.1.8.4. SWOT Analysis
- 11.1.9 Peax Equipment Rental
- 11.1.9.1. Company Overview
- 11.1.9.2. Products
- 11.1.9.3. Company Financials
- 11.1.9.4. SWOT Analysis
- 11.1.1 Rental Solutions & Services LLC
- 11.2. Market Entropy
- 11.2.1 Company's Key Areas Served
- 11.2.2 Recent Developments
- 11.3. Company Market Share Analysis 2025
- 11.3.1 Top 5 Companies Market Share Analysis
- 11.3.2 Top 3 Companies Market Share Analysis
- 11.4. List of Potential Customers
- 12. Research Methodology
List of Figures
- Figure 1: Global MEA Power Rental Industry Revenue Breakdown (billion, %) by Region 2025 & 2033
- Figure 2: South Africa MEA Power Rental Industry Revenue (billion), by End-User 2025 & 2033
- Figure 3: South Africa MEA Power Rental Industry Revenue Share (%), by End-User 2025 & 2033
- Figure 4: South Africa MEA Power Rental Industry Revenue (billion), by Fuel Type 2025 & 2033
- Figure 5: South Africa MEA Power Rental Industry Revenue Share (%), by Fuel Type 2025 & 2033
- Figure 6: South Africa MEA Power Rental Industry Revenue (billion), by Application 2025 & 2033
- Figure 7: South Africa MEA Power Rental Industry Revenue Share (%), by Application 2025 & 2033
- Figure 8: South Africa MEA Power Rental Industry Revenue (billion), by Geography 2025 & 2033
- Figure 9: South Africa MEA Power Rental Industry Revenue Share (%), by Geography 2025 & 2033
- Figure 10: South Africa MEA Power Rental Industry Revenue (billion), by Country 2025 & 2033
- Figure 11: South Africa MEA Power Rental Industry Revenue Share (%), by Country 2025 & 2033
- Figure 12: Saudi Arabia MEA Power Rental Industry Revenue (billion), by End-User 2025 & 2033
- Figure 13: Saudi Arabia MEA Power Rental Industry Revenue Share (%), by End-User 2025 & 2033
- Figure 14: Saudi Arabia MEA Power Rental Industry Revenue (billion), by Fuel Type 2025 & 2033
- Figure 15: Saudi Arabia MEA Power Rental Industry Revenue Share (%), by Fuel Type 2025 & 2033
- Figure 16: Saudi Arabia MEA Power Rental Industry Revenue (billion), by Application 2025 & 2033
- Figure 17: Saudi Arabia MEA Power Rental Industry Revenue Share (%), by Application 2025 & 2033
- Figure 18: Saudi Arabia MEA Power Rental Industry Revenue (billion), by Geography 2025 & 2033
- Figure 19: Saudi Arabia MEA Power Rental Industry Revenue Share (%), by Geography 2025 & 2033
- Figure 20: Saudi Arabia MEA Power Rental Industry Revenue (billion), by Country 2025 & 2033
- Figure 21: Saudi Arabia MEA Power Rental Industry Revenue Share (%), by Country 2025 & 2033
- Figure 22: United Arab Emirates MEA Power Rental Industry Revenue (billion), by End-User 2025 & 2033
- Figure 23: United Arab Emirates MEA Power Rental Industry Revenue Share (%), by End-User 2025 & 2033
- Figure 24: United Arab Emirates MEA Power Rental Industry Revenue (billion), by Fuel Type 2025 & 2033
- Figure 25: United Arab Emirates MEA Power Rental Industry Revenue Share (%), by Fuel Type 2025 & 2033
- Figure 26: United Arab Emirates MEA Power Rental Industry Revenue (billion), by Application 2025 & 2033
- Figure 27: United Arab Emirates MEA Power Rental Industry Revenue Share (%), by Application 2025 & 2033
- Figure 28: United Arab Emirates MEA Power Rental Industry Revenue (billion), by Geography 2025 & 2033
- Figure 29: United Arab Emirates MEA Power Rental Industry Revenue Share (%), by Geography 2025 & 2033
- Figure 30: United Arab Emirates MEA Power Rental Industry Revenue (billion), by Country 2025 & 2033
- Figure 31: United Arab Emirates MEA Power Rental Industry Revenue Share (%), by Country 2025 & 2033
- Figure 32: Rest of Middle East and Africa MEA Power Rental Industry Revenue (billion), by End-User 2025 & 2033
- Figure 33: Rest of Middle East and Africa MEA Power Rental Industry Revenue Share (%), by End-User 2025 & 2033
- Figure 34: Rest of Middle East and Africa MEA Power Rental Industry Revenue (billion), by Fuel Type 2025 & 2033
- Figure 35: Rest of Middle East and Africa MEA Power Rental Industry Revenue Share (%), by Fuel Type 2025 & 2033
- Figure 36: Rest of Middle East and Africa MEA Power Rental Industry Revenue (billion), by Application 2025 & 2033
- Figure 37: Rest of Middle East and Africa MEA Power Rental Industry Revenue Share (%), by Application 2025 & 2033
- Figure 38: Rest of Middle East and Africa MEA Power Rental Industry Revenue (billion), by Geography 2025 & 2033
- Figure 39: Rest of Middle East and Africa MEA Power Rental Industry Revenue Share (%), by Geography 2025 & 2033
- Figure 40: Rest of Middle East and Africa MEA Power Rental Industry Revenue (billion), by Country 2025 & 2033
- Figure 41: Rest of Middle East and Africa MEA Power Rental Industry Revenue Share (%), by Country 2025 & 2033
List of Tables
- Table 1: Global MEA Power Rental Industry Revenue billion Forecast, by End-User 2020 & 2033
- Table 2: Global MEA Power Rental Industry Revenue billion Forecast, by Fuel Type 2020 & 2033
- Table 3: Global MEA Power Rental Industry Revenue billion Forecast, by Application 2020 & 2033
- Table 4: Global MEA Power Rental Industry Revenue billion Forecast, by Geography 2020 & 2033
- Table 5: Global MEA Power Rental Industry Revenue billion Forecast, by Region 2020 & 2033
- Table 6: Global MEA Power Rental Industry Revenue billion Forecast, by End-User 2020 & 2033
- Table 7: Global MEA Power Rental Industry Revenue billion Forecast, by Fuel Type 2020 & 2033
- Table 8: Global MEA Power Rental Industry Revenue billion Forecast, by Application 2020 & 2033
- Table 9: Global MEA Power Rental Industry Revenue billion Forecast, by Geography 2020 & 2033
- Table 10: Global MEA Power Rental Industry Revenue billion Forecast, by Country 2020 & 2033
- Table 11: Global MEA Power Rental Industry Revenue billion Forecast, by End-User 2020 & 2033
- Table 12: Global MEA Power Rental Industry Revenue billion Forecast, by Fuel Type 2020 & 2033
- Table 13: Global MEA Power Rental Industry Revenue billion Forecast, by Application 2020 & 2033
- Table 14: Global MEA Power Rental Industry Revenue billion Forecast, by Geography 2020 & 2033
- Table 15: Global MEA Power Rental Industry Revenue billion Forecast, by Country 2020 & 2033
- Table 16: Global MEA Power Rental Industry Revenue billion Forecast, by End-User 2020 & 2033
- Table 17: Global MEA Power Rental Industry Revenue billion Forecast, by Fuel Type 2020 & 2033
- Table 18: Global MEA Power Rental Industry Revenue billion Forecast, by Application 2020 & 2033
- Table 19: Global MEA Power Rental Industry Revenue billion Forecast, by Geography 2020 & 2033
- Table 20: Global MEA Power Rental Industry Revenue billion Forecast, by Country 2020 & 2033
- Table 21: Global MEA Power Rental Industry Revenue billion Forecast, by End-User 2020 & 2033
- Table 22: Global MEA Power Rental Industry Revenue billion Forecast, by Fuel Type 2020 & 2033
- Table 23: Global MEA Power Rental Industry Revenue billion Forecast, by Application 2020 & 2033
- Table 24: Global MEA Power Rental Industry Revenue billion Forecast, by Geography 2020 & 2033
- Table 25: Global MEA Power Rental Industry Revenue billion Forecast, by Country 2020 & 2033
Frequently Asked Questions
1. What is the projected Compound Annual Growth Rate (CAGR) of the MEA Power Rental Industry?
The projected CAGR is approximately 5.4%.
2. Which companies are prominent players in the MEA Power Rental Industry?
Key companies in the market include Rental Solutions & Services LLC, Jubaili Bros LLC, Eaton Corporation PLC*List Not Exhaustive, Aggreko Middle East Ltd, Byrne Equipment Rental LLC, Jozi Power Limited, SES SMART Energy Solutions FZCO, KPS Power Generation, Peax Equipment Rental.
3. What are the main segments of the MEA Power Rental Industry?
The market segments include End-User, Fuel Type, Application, Geography.
4. Can you provide details about the market size?
The market size is estimated to be USD 2.17 billion as of 2022.
5. What are some drivers contributing to market growth?
4.; Favorable Government Policies.
6. What are the notable trends driving market growth?
Utility Segment to Dominate the Market.
7. Are there any restraints impacting market growth?
4.; Rising Emphasis on Other Alternative Clean Energy Sources.
8. Can you provide examples of recent developments in the market?
N/A
9. What pricing options are available for accessing the report?
Pricing options include single-user, multi-user, and enterprise licenses priced at USD 4750, USD 5250, and USD 8750 respectively.
10. Is the market size provided in terms of value or volume?
The market size is provided in terms of value, measured in billion.
11. Are there any specific market keywords associated with the report?
Yes, the market keyword associated with the report is "MEA Power Rental Industry," which aids in identifying and referencing the specific market segment covered.
12. How do I determine which pricing option suits my needs best?
The pricing options vary based on user requirements and access needs. Individual users may opt for single-user licenses, while businesses requiring broader access may choose multi-user or enterprise licenses for cost-effective access to the report.
13. Are there any additional resources or data provided in the MEA Power Rental Industry report?
While the report offers comprehensive insights, it's advisable to review the specific contents or supplementary materials provided to ascertain if additional resources or data are available.
14. How can I stay updated on further developments or reports in the MEA Power Rental Industry?
To stay informed about further developments, trends, and reports in the MEA Power Rental Industry, consider subscribing to industry newsletters, following relevant companies and organizations, or regularly checking reputable industry news sources and publications.
Methodology
Step 1 - Identification of Relevant Samples Size from Population Database


Step 2 - Approaches for Defining Global Market Size (Value, Volume* & Price*)

Note*: In applicable scenarios
Step 3 - Data Sources
Primary Research
- Web Analytics
- Survey Reports
- Research Institute
- Latest Research Reports
- Opinion Leaders
Secondary Research
- Annual Reports
- White Paper
- Latest Press Release
- Industry Association
- Paid Database
- Investor Presentations

Step 4 - Data Triangulation
Involves using different sources of information in order to increase the validity of a study
These sources are likely to be stakeholders in a program - participants, other researchers, program staff, other community members, and so on.
Then we put all data in single framework & apply various statistical tools to find out the dynamic on the market.
During the analysis stage, feedback from the stakeholder groups would be compared to determine areas of agreement as well as areas of divergence