

Key Insights
The Liquefied Petroleum Gas (LPG) market is poised for significant expansion, projected to achieve a Compound Annual Growth Rate (CAGR) of 3.9%. This growth is primarily fueled by increasing urbanization and industrialization in emerging economies, driving demand for cooking and industrial heating. The adoption of LPG as an automotive fuel, particularly in regions with stringent emission standards, further contributes to market expansion. Government initiatives promoting cleaner energy sources and diversification also play a pivotal role. Despite challenges from fluctuating crude oil prices, LPG's inherent advantages, including its cleaner burning profile, ease of storage and transport, and versatility, solidify its market appeal. The residential sector remains the primary consumer, followed by commercial, industrial, and automotive applications. Intense competition among key players like ExxonMobil, Novatek, and Sinopec spurs innovation in production and distribution. Asia-Pacific, led by India and China, is expected to be a major growth driver, while North America and Europe maintain steady demand due to established infrastructure.
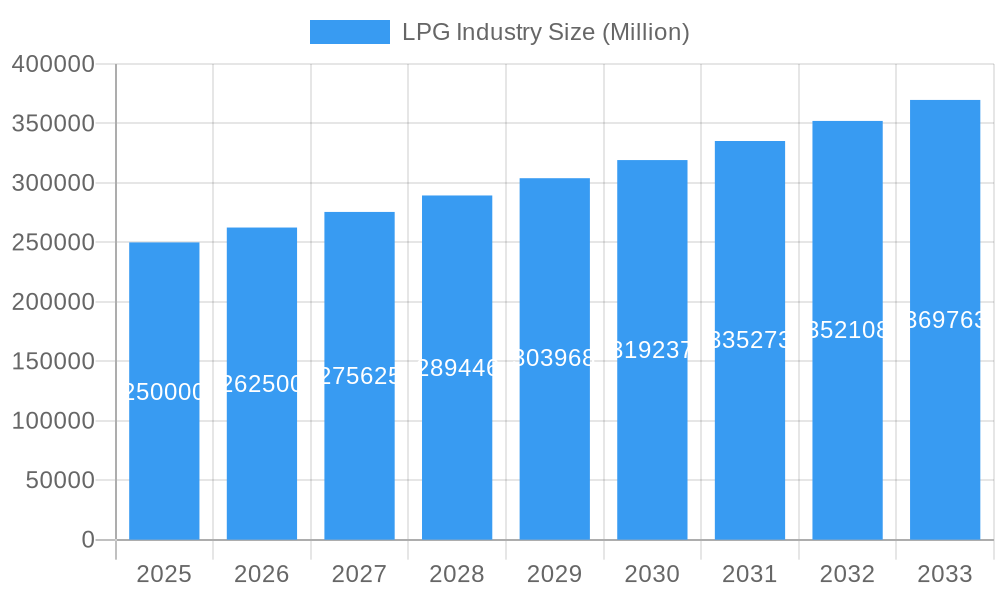
LPG Industry Market Size (In Billion)
Market segmentation highlights key industry trends. While crude oil is the dominant LPG source, natural gas liquids are increasingly contributing, reflecting the industry's adaptability. Residential use remains the largest application segment, but the industrial sector, particularly manufacturing and power generation, presents substantial future growth opportunities. The automotive fuel segment, though smaller, shows considerable potential due to the demand for cleaner energy solutions and supportive government regulations. The competitive environment, featuring both multinational corporations and national oil companies, drives efficiency, technological advancement, and price competitiveness. Geographic market share distribution reflects existing infrastructure and economic development, with rapid expansion in Asia-Pacific and the Middle East balancing mature markets in North America and Europe. The LPG industry's growth trajectory is expected to continue, contingent on factors such as geopolitical stability, the evolution of alternative energy sources, and shifting consumer preferences. The global LPG market size was valued at 123.14 billion in the base year 2024 and is anticipated to grow steadily.
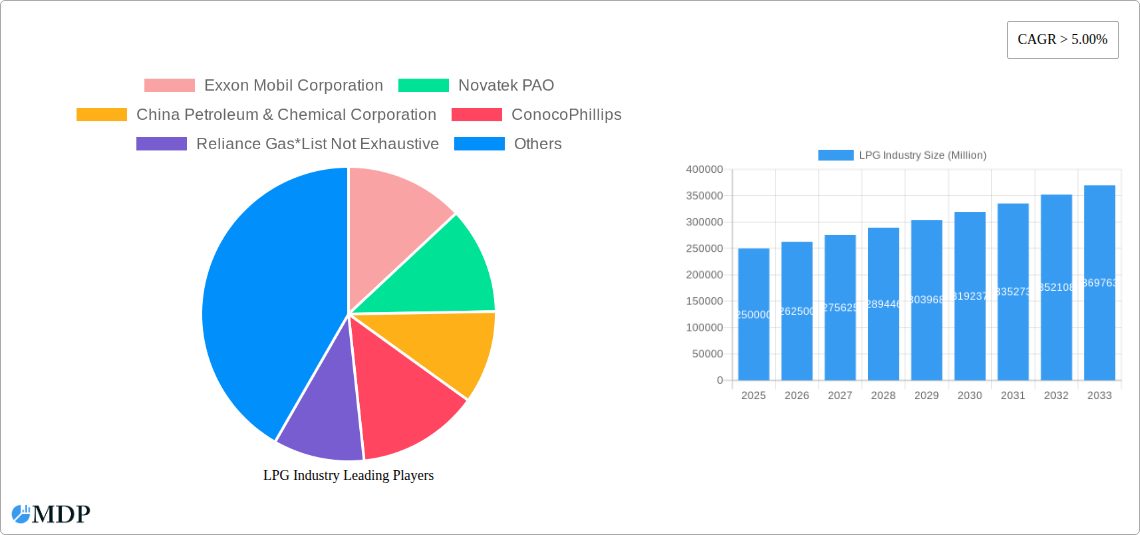
LPG Industry Company Market Share
LPG Industry Report: 2019-2033 Forecast - Unlocking Growth in a Dynamic Market
This comprehensive report provides an in-depth analysis of the global LPG industry, offering invaluable insights for investors, industry stakeholders, and strategic decision-makers. With a detailed forecast spanning 2019-2033, and a focus on key players like Exxon Mobil Corporation, Novatek PAO, and China Petroleum & Chemical Corporation, this report unveils the market's current dynamics and future trajectory. Discover critical trends, emerging opportunities, and potential challenges shaping the LPG landscape, encompassing production sources (crude oil, natural gas liquids), diverse applications (residential, commercial & industrial, autofuels), and major market players.
LPG Industry Market Dynamics & Concentration
The global LPG market, valued at xx Million in 2024, exhibits a moderately concentrated structure with a few major players holding significant market share. ExxonMobil Corporation, Novatek PAO, and Sinopec (China Petroleum & Chemical Corporation) are among the leading companies, collectively accounting for an estimated xx% of the global market share in 2024. Market concentration is influenced by factors such as economies of scale in production and distribution, access to resources, and strategic partnerships. Innovation, particularly in LPG storage and transportation technologies, is a key driver, while stringent regulatory frameworks concerning safety and environmental concerns play a significant role. Product substitutes, such as natural gas and electricity, pose competitive pressure, particularly in certain segments. End-user trends, particularly the increasing demand for LPG in developing economies, are driving market growth. M&A activities, while not excessively frequent, have been observed amongst smaller players seeking to consolidate their position or access new technologies. The number of M&A deals averaged xx per year during the historical period (2019-2024).
- Market Share: ExxonMobil Corporation (xx%), Novatek PAO (xx%), Sinopec (xx%), others (xx%) (2024 estimates).
- M&A Deal Count: Average of xx deals annually (2019-2024).
- Key Innovation Drivers: Improved storage tanks, efficient transportation methods, and enhanced safety measures.
- Regulatory Frameworks: Stringent safety standards and environmental regulations across various jurisdictions.
- Product Substitutes: Natural gas, electricity.
- End-User Trends: Growing residential demand in developing economies and increasing industrial application.
LPG Industry Trends & Analysis
The LPG industry is experiencing robust growth, driven by a complex interplay of factors. The Compound Annual Growth Rate (CAGR) is projected at xx% during the forecast period (2025-2033), reaching a market value of xx Million by 2033. Increased energy demand in emerging markets, coupled with government initiatives promoting cleaner cooking fuels, fuels this growth. Technological advancements in LPG extraction, processing, and distribution further enhance efficiency and reduce costs. Shifting consumer preferences towards cleaner and more convenient energy sources, combined with the relatively stable price of LPG compared to other fuels, support market expansion. However, the competitive landscape remains dynamic, with established players facing pressure from new entrants and alternative energy sources. Market penetration of LPG as a cooking fuel in rural areas of developing countries remains a significant growth opportunity.
Leading Markets & Segments in LPG Industry
Asia-Pacific dominates the global LPG market, driven by strong economic growth and rising energy consumption in countries like India and China. The residential segment accounts for a substantial share of overall consumption across all regions, highlighting the importance of cooking fuel.
- Source of Production: Natural gas liquids (NGLs) are the primary source of LPG, due to its widespread availability and relative cost-effectiveness compared to crude oil refining.
- Application: The residential segment commands the largest market share globally, followed by the commercial & industrial segment. Autofuel use of LPG is also steadily growing in certain regions.
Key Drivers for Asia-Pacific Dominance:
- Rapid urbanization and population growth.
- Government subsidies and initiatives promoting LPG adoption.
- Expanding infrastructure for LPG distribution.
Dominance Analysis: The robust growth of Asia-Pacific is attributed to the factors mentioned above, exceeding that of other regions such as North America and Europe which have more mature LPG markets.
LPG Industry Product Developments
Recent advancements in LPG technology focus on improving safety, efficiency, and environmental performance. This includes the development of advanced storage and transportation systems, as well as improved autogas technologies aimed at reducing emissions and increasing fuel efficiency. These innovations are crucial for enhancing the competitiveness of LPG against alternative fuels and meeting growing environmental regulations. Further development focuses on efficient LPG extraction techniques from various sources and better integration into diversified energy grids.
Key Drivers of LPG Industry Growth
Several factors propel the LPG industry's growth: increasing global energy demand, particularly in developing nations; governmental support for cleaner cooking fuels; technological advancements enhancing production and distribution efficiencies; and the relatively stable pricing of LPG compared to alternative fuels. Governmental initiatives aimed at improving access to LPG in rural areas also contribute significantly.
Challenges in the LPG Industry Market
The LPG industry faces challenges including price volatility linked to crude oil prices, potential supply chain disruptions, and increasing competition from alternative fuels such as natural gas and electricity. Stringent safety and environmental regulations also impose compliance costs. The industry also faces logistical hurdles in delivering LPG to remote areas, particularly in developing countries. These challenges cumulatively impact profitability and growth potential.
Emerging Opportunities in LPG Industry
Significant opportunities exist in expanding LPG infrastructure in underserved regions, leveraging technological advancements to enhance production and distribution, and forming strategic partnerships to access new markets. Developing innovative LPG-based applications in industrial processes and transportation presents significant growth potential. Moreover, the growing adoption of LPG autogas presents an exciting niche for expansion.
Leading Players in the LPG Industry Sector
Key Milestones in LPG Industry Industry
- October 2022: Maire Tecnimont S.p.A. awarded a USD 380 Million EPC contract for an LPG extraction plant in Algeria. This signifies investment in expanding LPG production capacity.
- February 2022: Indian Oil Corp. announced plans to invest USD 43-46 Million in expanding LPG bottling capacity in Northeast India, reflecting growing domestic demand.
Strategic Outlook for LPG Industry Market
The LPG industry is poised for continued growth, driven by factors like rising energy demand in developing economies and ongoing technological advancements. Strategic partnerships and expansion into new markets, particularly in regions with limited access to clean energy, will be crucial for future success. Companies that can effectively adapt to evolving regulatory landscapes and consumer preferences will be best positioned to capitalize on emerging opportunities.
LPG Industry Segmentation
-
1. Source of Production
- 1.1. Crude Oil
- 1.2. Natural Gas Liquids
-
2. Application
- 2.1. Residential
- 2.2. Commercial & Industrial
- 2.3. Autofuels
- 2.4. Other Applications
LPG Industry Segmentation By Geography
-
1. North America
- 1.1. United States
- 1.2. Canada
- 1.3. Rest of North America
-
2. Europe
- 2.1. Norway
- 2.2. Netherlands
- 2.3. United Kingdom
- 2.4. Germany
- 2.5. Rest of Europe
-
3. Asia Pacific
- 3.1. China
- 3.2. India
- 3.3. South Korea
- 3.4. Japan
- 3.5. Rest of Asia Pacific
-
4. Middle East and Africa
- 4.1. Saudi Arabia
- 4.2. Qatar
- 4.3. South Africa
- 4.4. Rest of Middle East and Africa
-
5. South America
- 5.1. Brazil
- 5.2. Argentina
- 5.3. Chile
- 5.4. Rest of South America
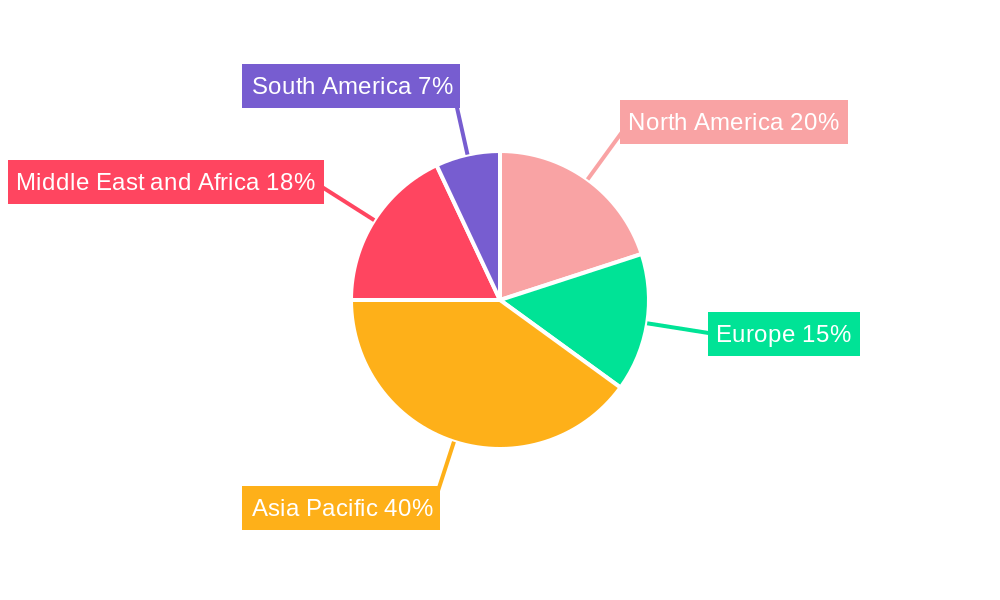
LPG Industry Regional Market Share
Geographic Coverage of LPG Industry
LPG Industry REPORT HIGHLIGHTS
| Aspects | Details |
|---|---|
| Study Period | 2020-2034 |
| Base Year | 2025 |
| Estimated Year | 2026 |
| Forecast Period | 2026-2034 |
| Historical Period | 2020-2025 |
| Growth Rate | CAGR of 3.9% from 2020-2034 |
| Segmentation |
|
Table of Contents
- 1. Introduction
- 1.1. Research Scope
- 1.2. Market Segmentation
- 1.3. Research Objective
- 1.4. Definitions and Assumptions
- 2. Executive Summary
- 2.1. Market Snapshot
- 3. Market Dynamics
- 3.1. Market Drivers
- 3.2. Market Restrains
- 3.3. Market Trends
- 3.4. Market Opportunities
- 4. Market Factor Analysis
- 4.1. Porters Five Forces
- 4.1.1. Bargaining Power of Suppliers
- 4.1.2. Bargaining Power of Buyers
- 4.1.3. Threat of New Entrants
- 4.1.4. Threat of Substitutes
- 4.1.5. Competitive Rivalry
- 4.2. PESTEL analysis
- 4.3. BCG Analysis
- 4.3.1. Stars (High Growth, High Market Share)
- 4.3.2. Cash Cows (Low Growth, High Market Share)
- 4.3.3. Question Mark (High Growth, Low Market Share)
- 4.3.4. Dogs (Low Growth, Low Market Share)
- 4.4. Ansoff Matrix Analysis
- 4.5. Supply Chain Analysis
- 4.6. Regulatory Landscape
- 4.7. Current Market Potential and Opportunity Assessment (TAM–SAM–SOM Framework)
- 4.8. MDP Analyst Note
- 4.1. Porters Five Forces
- 5. Market Analysis, Insights and Forecast 2021-2033
- 5.1. Market Analysis, Insights and Forecast - by Source of Production
- 5.1.1. Crude Oil
- 5.1.2. Natural Gas Liquids
- 5.2. Market Analysis, Insights and Forecast - by Application
- 5.2.1. Residential
- 5.2.2. Commercial & Industrial
- 5.2.3. Autofuels
- 5.2.4. Other Applications
- 5.3. Market Analysis, Insights and Forecast - by Region
- 5.3.1. North America
- 5.3.2. Europe
- 5.3.3. Asia Pacific
- 5.3.4. Middle East and Africa
- 5.3.5. South America
- 5.1. Market Analysis, Insights and Forecast - by Source of Production
- 6. Global LPG Industry Analysis, Insights and Forecast, 2021-2033
- 6.1. Market Analysis, Insights and Forecast - by Source of Production
- 6.1.1. Crude Oil
- 6.1.2. Natural Gas Liquids
- 6.2. Market Analysis, Insights and Forecast - by Application
- 6.2.1. Residential
- 6.2.2. Commercial & Industrial
- 6.2.3. Autofuels
- 6.2.4. Other Applications
- 6.1. Market Analysis, Insights and Forecast - by Source of Production
- 7. North America LPG Industry Analysis, Insights and Forecast, 2020-2032
- 7.1. Market Analysis, Insights and Forecast - by Source of Production
- 7.1.1. Crude Oil
- 7.1.2. Natural Gas Liquids
- 7.2. Market Analysis, Insights and Forecast - by Application
- 7.2.1. Residential
- 7.2.2. Commercial & Industrial
- 7.2.3. Autofuels
- 7.2.4. Other Applications
- 7.1. Market Analysis, Insights and Forecast - by Source of Production
- 8. Europe LPG Industry Analysis, Insights and Forecast, 2020-2032
- 8.1. Market Analysis, Insights and Forecast - by Source of Production
- 8.1.1. Crude Oil
- 8.1.2. Natural Gas Liquids
- 8.2. Market Analysis, Insights and Forecast - by Application
- 8.2.1. Residential
- 8.2.2. Commercial & Industrial
- 8.2.3. Autofuels
- 8.2.4. Other Applications
- 8.1. Market Analysis, Insights and Forecast - by Source of Production
- 9. Asia Pacific LPG Industry Analysis, Insights and Forecast, 2020-2032
- 9.1. Market Analysis, Insights and Forecast - by Source of Production
- 9.1.1. Crude Oil
- 9.1.2. Natural Gas Liquids
- 9.2. Market Analysis, Insights and Forecast - by Application
- 9.2.1. Residential
- 9.2.2. Commercial & Industrial
- 9.2.3. Autofuels
- 9.2.4. Other Applications
- 9.1. Market Analysis, Insights and Forecast - by Source of Production
- 10. Middle East and Africa LPG Industry Analysis, Insights and Forecast, 2020-2032
- 10.1. Market Analysis, Insights and Forecast - by Source of Production
- 10.1.1. Crude Oil
- 10.1.2. Natural Gas Liquids
- 10.2. Market Analysis, Insights and Forecast - by Application
- 10.2.1. Residential
- 10.2.2. Commercial & Industrial
- 10.2.3. Autofuels
- 10.2.4. Other Applications
- 10.1. Market Analysis, Insights and Forecast - by Source of Production
- 11. South America LPG Industry Analysis, Insights and Forecast, 2020-2032
- 11.1. Market Analysis, Insights and Forecast - by Source of Production
- 11.1.1. Crude Oil
- 11.1.2. Natural Gas Liquids
- 11.2. Market Analysis, Insights and Forecast - by Application
- 11.2.1. Residential
- 11.2.2. Commercial & Industrial
- 11.2.3. Autofuels
- 11.2.4. Other Applications
- 11.1. Market Analysis, Insights and Forecast - by Source of Production
- 12. Competitive Analysis
- 12.1. Company Profiles
- 12.1.1 Exxon Mobil Corporation
- 12.1.1.1. Company Overview
- 12.1.1.2. Products
- 12.1.1.3. Company Financials
- 12.1.1.4. SWOT Analysis
- 12.1.2 Novatek PAO
- 12.1.2.1. Company Overview
- 12.1.2.2. Products
- 12.1.2.3. Company Financials
- 12.1.2.4. SWOT Analysis
- 12.1.3 China Petroleum & Chemical Corporation
- 12.1.3.1. Company Overview
- 12.1.3.2. Products
- 12.1.3.3. Company Financials
- 12.1.3.4. SWOT Analysis
- 12.1.4 ConocoPhillips
- 12.1.4.1. Company Overview
- 12.1.4.2. Products
- 12.1.4.3. Company Financials
- 12.1.4.4. SWOT Analysis
- 12.1.5 Reliance Gas*List Not Exhaustive
- 12.1.5.1. Company Overview
- 12.1.5.2. Products
- 12.1.5.3. Company Financials
- 12.1.5.4. SWOT Analysis
- 12.1.6 QatarEnergy
- 12.1.6.1. Company Overview
- 12.1.6.2. Products
- 12.1.6.3. Company Financials
- 12.1.6.4. SWOT Analysis
- 12.1.7 BP PLC
- 12.1.7.1. Company Overview
- 12.1.7.2. Products
- 12.1.7.3. Company Financials
- 12.1.7.4. SWOT Analysis
- 12.1.8 Indian Oil Corporation Ltd
- 12.1.8.1. Company Overview
- 12.1.8.2. Products
- 12.1.8.3. Company Financials
- 12.1.8.4. SWOT Analysis
- 12.1.9 Gazprom PJSC
- 12.1.9.1. Company Overview
- 12.1.9.2. Products
- 12.1.9.3. Company Financials
- 12.1.9.4. SWOT Analysis
- 12.1.10 Abu Dhabi National Oil Company (ADNOC)
- 12.1.10.1. Company Overview
- 12.1.10.2. Products
- 12.1.10.3. Company Financials
- 12.1.10.4. SWOT Analysis
- 12.1.1 Exxon Mobil Corporation
- 12.2. Market Entropy
- 12.2.1 Company's Key Areas Served
- 12.2.2 Recent Developments
- 12.3. Company Market Share Analysis 2025
- 12.3.1 Top 5 Companies Market Share Analysis
- 12.3.2 Top 3 Companies Market Share Analysis
- 12.4. List of Potential Customers
- 13. Research Methodology
List of Figures
- Figure 1: Global LPG Industry Revenue Breakdown (billion, %) by Region 2025 & 2033
- Figure 2: North America LPG Industry Revenue (billion), by Source of Production 2025 & 2033
- Figure 3: North America LPG Industry Revenue Share (%), by Source of Production 2025 & 2033
- Figure 4: North America LPG Industry Revenue (billion), by Application 2025 & 2033
- Figure 5: North America LPG Industry Revenue Share (%), by Application 2025 & 2033
- Figure 6: North America LPG Industry Revenue (billion), by Country 2025 & 2033
- Figure 7: North America LPG Industry Revenue Share (%), by Country 2025 & 2033
- Figure 8: Europe LPG Industry Revenue (billion), by Source of Production 2025 & 2033
- Figure 9: Europe LPG Industry Revenue Share (%), by Source of Production 2025 & 2033
- Figure 10: Europe LPG Industry Revenue (billion), by Application 2025 & 2033
- Figure 11: Europe LPG Industry Revenue Share (%), by Application 2025 & 2033
- Figure 12: Europe LPG Industry Revenue (billion), by Country 2025 & 2033
- Figure 13: Europe LPG Industry Revenue Share (%), by Country 2025 & 2033
- Figure 14: Asia Pacific LPG Industry Revenue (billion), by Source of Production 2025 & 2033
- Figure 15: Asia Pacific LPG Industry Revenue Share (%), by Source of Production 2025 & 2033
- Figure 16: Asia Pacific LPG Industry Revenue (billion), by Application 2025 & 2033
- Figure 17: Asia Pacific LPG Industry Revenue Share (%), by Application 2025 & 2033
- Figure 18: Asia Pacific LPG Industry Revenue (billion), by Country 2025 & 2033
- Figure 19: Asia Pacific LPG Industry Revenue Share (%), by Country 2025 & 2033
- Figure 20: Middle East and Africa LPG Industry Revenue (billion), by Source of Production 2025 & 2033
- Figure 21: Middle East and Africa LPG Industry Revenue Share (%), by Source of Production 2025 & 2033
- Figure 22: Middle East and Africa LPG Industry Revenue (billion), by Application 2025 & 2033
- Figure 23: Middle East and Africa LPG Industry Revenue Share (%), by Application 2025 & 2033
- Figure 24: Middle East and Africa LPG Industry Revenue (billion), by Country 2025 & 2033
- Figure 25: Middle East and Africa LPG Industry Revenue Share (%), by Country 2025 & 2033
- Figure 26: South America LPG Industry Revenue (billion), by Source of Production 2025 & 2033
- Figure 27: South America LPG Industry Revenue Share (%), by Source of Production 2025 & 2033
- Figure 28: South America LPG Industry Revenue (billion), by Application 2025 & 2033
- Figure 29: South America LPG Industry Revenue Share (%), by Application 2025 & 2033
- Figure 30: South America LPG Industry Revenue (billion), by Country 2025 & 2033
- Figure 31: South America LPG Industry Revenue Share (%), by Country 2025 & 2033
List of Tables
- Table 1: Global LPG Industry Revenue billion Forecast, by Source of Production 2020 & 2033
- Table 2: Global LPG Industry Revenue billion Forecast, by Application 2020 & 2033
- Table 3: Global LPG Industry Revenue billion Forecast, by Region 2020 & 2033
- Table 4: Global LPG Industry Revenue billion Forecast, by Source of Production 2020 & 2033
- Table 5: Global LPG Industry Revenue billion Forecast, by Application 2020 & 2033
- Table 6: Global LPG Industry Revenue billion Forecast, by Country 2020 & 2033
- Table 7: United States LPG Industry Revenue (billion) Forecast, by Application 2020 & 2033
- Table 8: Canada LPG Industry Revenue (billion) Forecast, by Application 2020 & 2033
- Table 9: Rest of North America LPG Industry Revenue (billion) Forecast, by Application 2020 & 2033
- Table 10: Global LPG Industry Revenue billion Forecast, by Source of Production 2020 & 2033
- Table 11: Global LPG Industry Revenue billion Forecast, by Application 2020 & 2033
- Table 12: Global LPG Industry Revenue billion Forecast, by Country 2020 & 2033
- Table 13: Norway LPG Industry Revenue (billion) Forecast, by Application 2020 & 2033
- Table 14: Netherlands LPG Industry Revenue (billion) Forecast, by Application 2020 & 2033
- Table 15: United Kingdom LPG Industry Revenue (billion) Forecast, by Application 2020 & 2033
- Table 16: Germany LPG Industry Revenue (billion) Forecast, by Application 2020 & 2033
- Table 17: Rest of Europe LPG Industry Revenue (billion) Forecast, by Application 2020 & 2033
- Table 18: Global LPG Industry Revenue billion Forecast, by Source of Production 2020 & 2033
- Table 19: Global LPG Industry Revenue billion Forecast, by Application 2020 & 2033
- Table 20: Global LPG Industry Revenue billion Forecast, by Country 2020 & 2033
- Table 21: China LPG Industry Revenue (billion) Forecast, by Application 2020 & 2033
- Table 22: India LPG Industry Revenue (billion) Forecast, by Application 2020 & 2033
- Table 23: South Korea LPG Industry Revenue (billion) Forecast, by Application 2020 & 2033
- Table 24: Japan LPG Industry Revenue (billion) Forecast, by Application 2020 & 2033
- Table 25: Rest of Asia Pacific LPG Industry Revenue (billion) Forecast, by Application 2020 & 2033
- Table 26: Global LPG Industry Revenue billion Forecast, by Source of Production 2020 & 2033
- Table 27: Global LPG Industry Revenue billion Forecast, by Application 2020 & 2033
- Table 28: Global LPG Industry Revenue billion Forecast, by Country 2020 & 2033
- Table 29: Saudi Arabia LPG Industry Revenue (billion) Forecast, by Application 2020 & 2033
- Table 30: Qatar LPG Industry Revenue (billion) Forecast, by Application 2020 & 2033
- Table 31: South Africa LPG Industry Revenue (billion) Forecast, by Application 2020 & 2033
- Table 32: Rest of Middle East and Africa LPG Industry Revenue (billion) Forecast, by Application 2020 & 2033
- Table 33: Global LPG Industry Revenue billion Forecast, by Source of Production 2020 & 2033
- Table 34: Global LPG Industry Revenue billion Forecast, by Application 2020 & 2033
- Table 35: Global LPG Industry Revenue billion Forecast, by Country 2020 & 2033
- Table 36: Brazil LPG Industry Revenue (billion) Forecast, by Application 2020 & 2033
- Table 37: Argentina LPG Industry Revenue (billion) Forecast, by Application 2020 & 2033
- Table 38: Chile LPG Industry Revenue (billion) Forecast, by Application 2020 & 2033
- Table 39: Rest of South America LPG Industry Revenue (billion) Forecast, by Application 2020 & 2033
Frequently Asked Questions
1. What is the projected Compound Annual Growth Rate (CAGR) of the LPG Industry?
The projected CAGR is approximately 3.9%.
2. Which companies are prominent players in the LPG Industry?
Key companies in the market include Exxon Mobil Corporation, Novatek PAO, China Petroleum & Chemical Corporation, ConocoPhillips, Reliance Gas*List Not Exhaustive, QatarEnergy, BP PLC, Indian Oil Corporation Ltd, Gazprom PJSC, Abu Dhabi National Oil Company (ADNOC).
3. What are the main segments of the LPG Industry?
The market segments include Source of Production, Application.
4. Can you provide details about the market size?
The market size is estimated to be USD 123.14 billion as of 2022.
5. What are some drivers contributing to market growth?
4.; Increasing Demand for Gasoline and Diesel Across the Globe4.; Rapid Expansion of Automotive Industry.
6. What are the notable trends driving market growth?
LPG Extracted from Natural Gas Liquids to Dominate the Market.
7. Are there any restraints impacting market growth?
4.; Strict Mandates by the Global Organizations on VGO Composition.
8. Can you provide examples of recent developments in the market?
In October 2022, Maire Tecnimont S.p.A. announced that its principal subsidiary, Tecnimont S.p.A., was awarded an EPC contract by SONATRACH's Direction Centrale Engineering & Project Management for the execution of an LPG extraction plant within the existing Rhourde El Baguel oil and gas treatment complex in northeastern Algeria. The total contract value is around USD 380 million.
9. What pricing options are available for accessing the report?
Pricing options include single-user, multi-user, and enterprise licenses priced at USD 4750, USD 5250, and USD 8750 respectively.
10. Is the market size provided in terms of value or volume?
The market size is provided in terms of value, measured in billion.
11. Are there any specific market keywords associated with the report?
Yes, the market keyword associated with the report is "LPG Industry," which aids in identifying and referencing the specific market segment covered.
12. How do I determine which pricing option suits my needs best?
The pricing options vary based on user requirements and access needs. Individual users may opt for single-user licenses, while businesses requiring broader access may choose multi-user or enterprise licenses for cost-effective access to the report.
13. Are there any additional resources or data provided in the LPG Industry report?
While the report offers comprehensive insights, it's advisable to review the specific contents or supplementary materials provided to ascertain if additional resources or data are available.
14. How can I stay updated on further developments or reports in the LPG Industry?
To stay informed about further developments, trends, and reports in the LPG Industry, consider subscribing to industry newsletters, following relevant companies and organizations, or regularly checking reputable industry news sources and publications.
Methodology
Step 1 - Identification of Relevant Samples Size from Population Database


Step 2 - Approaches for Defining Global Market Size (Value, Volume* & Price*)

Note*: In applicable scenarios
Step 3 - Data Sources
Primary Research
- Web Analytics
- Survey Reports
- Research Institute
- Latest Research Reports
- Opinion Leaders
Secondary Research
- Annual Reports
- White Paper
- Latest Press Release
- Industry Association
- Paid Database
- Investor Presentations

Step 4 - Data Triangulation
Involves using different sources of information in order to increase the validity of a study
These sources are likely to be stakeholders in a program - participants, other researchers, program staff, other community members, and so on.
Then we put all data in single framework & apply various statistical tools to find out the dynamic on the market.
During the analysis stage, feedback from the stakeholder groups would be compared to determine areas of agreement as well as areas of divergence