

Key Insights
The European Power-to-Gas (PtG) market is poised for substantial expansion, driven by the imperative for energy decarbonization and the integration of renewable energy sources. Projected to achieve a Compound Annual Growth Rate (CAGR) of 11.35%, the market, estimated at 46.76 billion in the base year 2025, is set for significant growth through 2033. Key growth catalysts include stringent EU renewable energy mandates, supportive policies for energy storage, and escalating energy security concerns. The burgeoning hydrogen economy, coupled with advancements in Power-to-Methane (PtM) for efficient energy storage and transport, is further propelling market expansion. Segmentation by end-user highlights robust demand across utilities, industrial processes, and commercial applications. Germany, France, and the United Kingdom are at the forefront, supported by established renewable infrastructure and favorable government initiatives. However, challenges such as high initial capital expenditure and the need for enhanced efficiency and cost reduction in PtG technologies persist. Development of a comprehensive hydrogen and methane distribution network is also critical for widespread adoption.
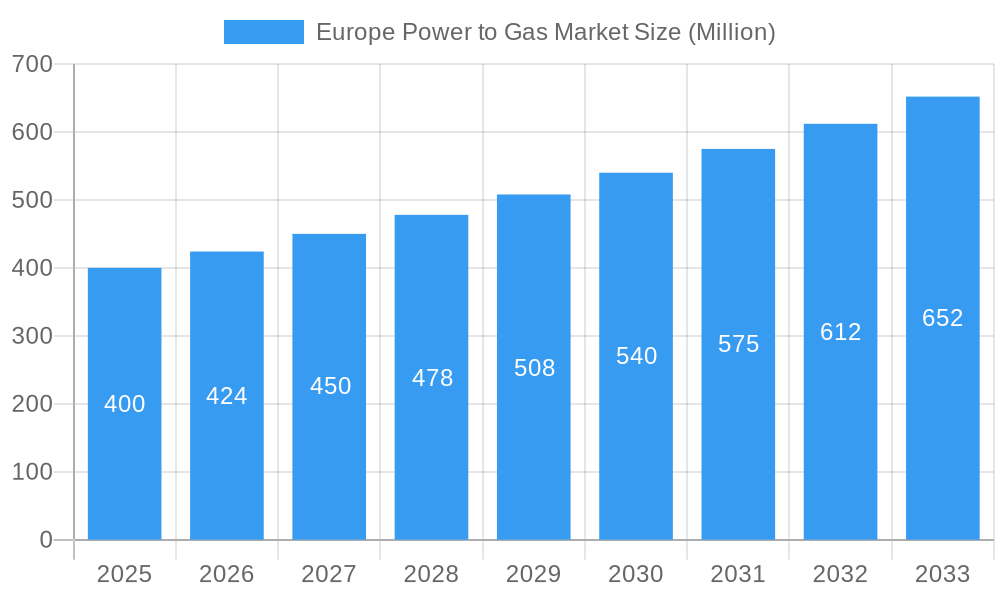
Europe Power to Gas Market Market Size (In Billion)
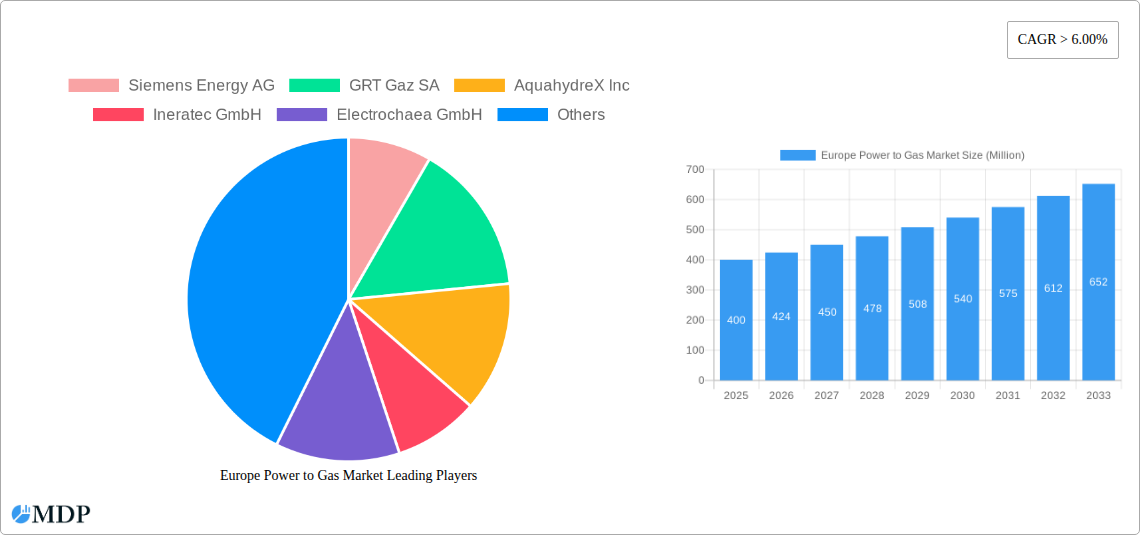
The competitive arena comprises established energy corporations, including Siemens Energy and Sempra Energy, alongside specialized PtG technology innovators such as Nel ASA, Ineratec GmbH, and Electrochaea GmbH. These entities are actively investing in research and development to deliver advanced solutions aligned with escalating market demand. The market's future trajectory is intrinsically linked to sustained policy support, technological breakthroughs, and the overall pace of renewable energy integration across Europe. Regional disparities exist, with countries like Germany, possessing strong renewable potential, exhibiting faster growth rates. Market dynamics are further shaped by the adoption of diverse PtG technologies, including Alkaline Water Electrolysis, PEM, SOEC, and chemical/biological PtM, with technology selection influenced by cost, efficiency, and application suitability. The varying capacity segments, from sub-100 kW to over 1000 kW, underscore the diverse range of projects and applications driving this evolving market.
Europe Power to Gas Market Company Market Share
Europe Power to Gas Market Analysis: Growth, Trends, and Forecast (2025-2033)
This comprehensive report delivers an in-depth analysis of the Europe Power to Gas market, offering critical insights for industry stakeholders, investors, and strategists. Focusing on the period from 2025 to 2033, the report meticulously dissects market dynamics, technological advancements, key players, and future growth prospects. Gain actionable intelligence through detailed segmentation by technology (Power-to-Hydrogen, Power-to-Methane), capacity ( >1000 KW, 100-1000 KW, <100 KW), end-user (Utilities, Industrial, Commercial), and geography (United Kingdom, Germany, France, Spain, Others). Empower your strategic decisions in this dynamic market.
Europe Power to Gas Market Market Dynamics & Concentration
The European Power to Gas market is experiencing robust growth, driven by increasing renewable energy integration, stringent environmental regulations, and the need for energy security. Market concentration is moderate, with several key players vying for market share. Innovation in electrolysis technologies (Alkaline Water Electrolysis, PEM, SOEC) and methanation processes (chemical and biological) is a major growth driver. Stringent environmental regulations across Europe, particularly concerning greenhouse gas emissions, are compelling adoption of Power to Gas solutions. Product substitutes, primarily traditional fossil fuels, face increasing pressure due to rising carbon costs and sustainability concerns. End-user trends reveal a shift towards green hydrogen and methane among utilities and industrial sectors.
- Market Share (2025 Estimate): Siemens Energy AG (xx%), GRT Gaz SA (xx%), Others (xx%).
- M&A Activity (2019-2024): xx deals, indicating significant consolidation and investment in the sector. The average deal size was approximately xx Million.
Europe Power to Gas Market Industry Trends & Analysis
The European Power to Gas market exhibits a strong Compound Annual Growth Rate (CAGR) of xx% during the forecast period (2025-2033). This growth is propelled by several factors, including increasing government incentives for renewable energy adoption, advancements in Power-to-Gas technologies, and a growing awareness of the need for decarbonization. Technological disruptions, such as advancements in electrolysis efficiency and cost reduction, are further accelerating market penetration. Consumer preferences are shifting towards sustainable energy solutions, creating a significant demand for green hydrogen and methane. Competitive dynamics are characterized by both collaboration and competition, as companies seek strategic partnerships and invest in R&D to gain a competitive edge. Market penetration in the industrial sector is expected to exceed xx% by 2033, while the utility sector will follow with penetration exceeding xx% by the same year.
Leading Markets & Segments in Europe Power to Gas Market
Germany and the United Kingdom currently lead the European Power to Gas market, driven by supportive government policies and robust renewable energy infrastructure. France and Spain are also emerging as key markets.
Key Drivers:
- Germany: Strong renewable energy integration targets, supportive regulatory framework, and well-established industrial sector.
- United Kingdom: Significant investments in offshore wind energy, growing demand for green hydrogen in transportation and industry, and government support for hydrogen projects.
- France: Investments in renewable energy infrastructure and government initiatives to promote the hydrogen economy.
- Spain: Abundant solar resources and governmental commitment to renewable energy targets.
Dominant Segments:
- Technology: Power-to-Hydrogen (especially PEM electrolysis) holds a significant market share due to its technological maturity and scalability.
- Capacity: The >1000 KW segment is experiencing rapid growth, driven by large-scale projects in the utility and industrial sectors.
- End-User: The industrial sector is currently the largest end-user, followed by the utility sector.
Europe Power to Gas Market Product Developments
Recent product innovations focus on increasing efficiency, reducing costs, and improving the scalability of Power-to-Gas technologies. Advancements in electrolysis technologies, such as the development of high-temperature electrolysis (SOEC) and improved PEM electrolyzers, are enhancing the efficiency and competitiveness of green hydrogen production. The development of more efficient and cost-effective methanation processes is expanding the applications of Power-to-Gas. These innovations are improving the overall market fit by making Power-to-Gas a more viable and cost-effective solution for energy storage and decarbonization.
Key Drivers of Europe Power to Gas Market Growth
The growth of the European Power to Gas market is driven by a confluence of factors: stringent environmental regulations targeting carbon emissions, the increasing integration of renewable energy sources into national grids necessitating flexible and efficient energy storage solutions, and significant government support and financial incentives for green hydrogen and methane production. Technological advancements, leading to improved efficiency and reduced costs of Power to Gas technologies, are further accelerating market expansion.
Challenges in the Europe Power to Gas Market Market
The European Power to Gas market faces several challenges. High capital costs for Power-to-Gas facilities can hinder widespread adoption, especially for smaller-scale projects. The intermittent nature of renewable energy sources necessitates robust energy storage solutions which currently are expensive. Furthermore, the development of a comprehensive hydrogen and methane infrastructure is essential for large-scale deployment. A lack of standardized regulations and policies across different European countries can pose complexities.
Emerging Opportunities in Europe Power to Gas Market
Significant opportunities exist for growth in the European Power to Gas market. Technological breakthroughs, such as improved electrolysis efficiency and reduced costs, will create new market entry points. Strategic partnerships between renewable energy developers, Power to Gas technology providers, and end-users will drive project development and market expansion. The ongoing development of hydrogen and methane infrastructure will significantly expand market potential. Expansion into new geographical areas with high renewable energy potential will further stimulate growth.
Leading Players in the Europe Power to Gas Market Sector
- Siemens Energy AG
- GRT Gaz SA
- AquahydreX Inc
- Ineratec GmbH
- Electrochaea GmbH
- Sempra Energy
- Nel ASA
Key Milestones in Europe Power to Gas Market Industry
- March 2022: ERM Dolphyn and Source Energie partner to develop a 200 MW floating wind-to-hydrogen project in the UK (Commissioning: 2027).
- March 2022: Sunfire wins a contract to supply electrolysis equipment for Finland's first industrial-scale green hydrogen plant (20 MW capacity, EUR 70 Million investment).
Strategic Outlook for Europe Power to Gas Market Market
The future of the European Power to Gas market is bright. Continued technological advancements, supportive government policies, and increasing demand for sustainable energy solutions will fuel significant market growth. Strategic partnerships, coupled with investments in infrastructure development, will unlock further opportunities. The market is poised for substantial expansion, creating significant potential for investors and industry participants. The forecast period from 2025-2033 promises an extremely positive outlook with projections showing a market value exceeding xx Million by 2033.
Europe Power to Gas Market Segmentation
-
1. Technology
- 1.1. Power-to
- 1.2. Power-to-Methane (incl. Chemical and Biological)
-
2. Capacity
- 2.1. More than 1000 KW
- 2.2. 100 to 1000 KW
- 2.3. Less than 100 KW
-
3. End-User
- 3.1. Utilities
- 3.2. Industrial
- 3.3. Commercial
-
4. Location
- 4.1. United Kingdom
- 4.2. Germany
- 4.3. France
- 4.4. Spain
- 4.5. Others
Europe Power to Gas Market Segmentation By Geography
-
1. Europe
- 1.1. United Kingdom
- 1.2. Germany
- 1.3. France
- 1.4. Italy
- 1.5. Spain
- 1.6. Netherlands
- 1.7. Belgium
- 1.8. Sweden
- 1.9. Norway
- 1.10. Poland
- 1.11. Denmark
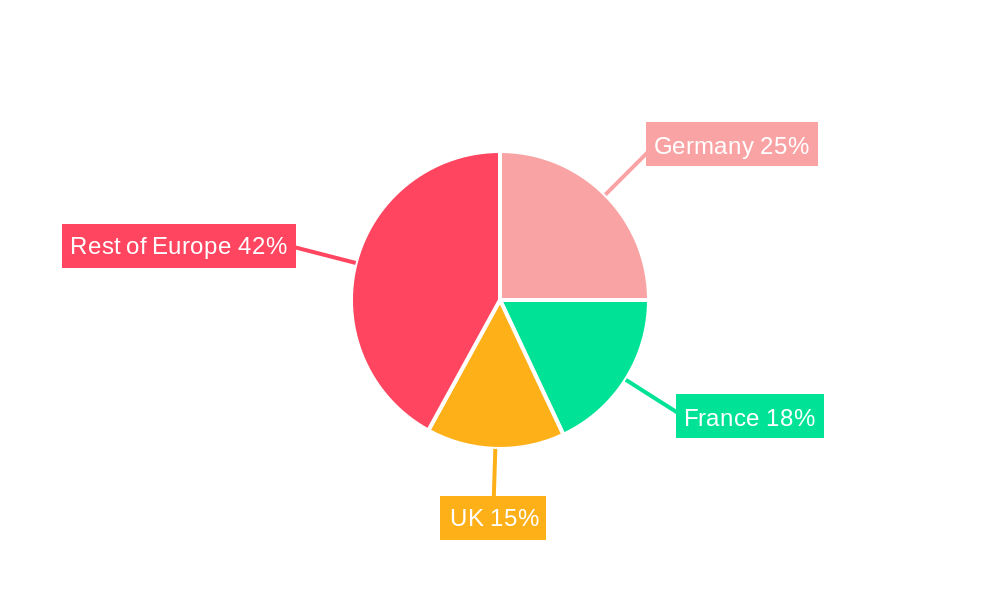
Europe Power to Gas Market Regional Market Share
Geographic Coverage of Europe Power to Gas Market
Europe Power to Gas Market REPORT HIGHLIGHTS
| Aspects | Details |
|---|---|
| Study Period | 2020-2034 |
| Base Year | 2025 |
| Estimated Year | 2026 |
| Forecast Period | 2026-2034 |
| Historical Period | 2020-2025 |
| Growth Rate | CAGR of 11.35% from 2020-2034 |
| Segmentation |
|
Table of Contents
- 1. Introduction
- 1.1. Research Scope
- 1.2. Market Segmentation
- 1.3. Research Objective
- 1.4. Definitions and Assumptions
- 2. Executive Summary
- 2.1. Market Snapshot
- 3. Market Dynamics
- 3.1. Market Drivers
- 3.2. Market Restrains
- 3.3. Market Trends
- 3.4. Market Opportunities
- 4. Market Factor Analysis
- 4.1. Porters Five Forces
- 4.1.1. Bargaining Power of Suppliers
- 4.1.2. Bargaining Power of Buyers
- 4.1.3. Threat of New Entrants
- 4.1.4. Threat of Substitutes
- 4.1.5. Competitive Rivalry
- 4.2. PESTEL analysis
- 4.3. BCG Analysis
- 4.3.1. Stars (High Growth, High Market Share)
- 4.3.2. Cash Cows (Low Growth, High Market Share)
- 4.3.3. Question Mark (High Growth, Low Market Share)
- 4.3.4. Dogs (Low Growth, Low Market Share)
- 4.4. Ansoff Matrix Analysis
- 4.5. Supply Chain Analysis
- 4.6. Regulatory Landscape
- 4.7. Current Market Potential and Opportunity Assessment (TAM–SAM–SOM Framework)
- 4.8. MDP Analyst Note
- 4.1. Porters Five Forces
- 5. Market Analysis, Insights and Forecast 2021-2033
- 5.1. Market Analysis, Insights and Forecast - by Technology
- 5.1.1. Power-to
- 5.1.2. Power-to-Methane (incl. Chemical and Biological)
- 5.2. Market Analysis, Insights and Forecast - by Capacity
- 5.2.1. More than 1000 KW
- 5.2.2. 100 to 1000 KW
- 5.2.3. Less than 100 KW
- 5.3. Market Analysis, Insights and Forecast - by End-User
- 5.3.1. Utilities
- 5.3.2. Industrial
- 5.3.3. Commercial
- 5.4. Market Analysis, Insights and Forecast - by Location
- 5.4.1. United Kingdom
- 5.4.2. Germany
- 5.4.3. France
- 5.4.4. Spain
- 5.4.5. Others
- 5.5. Market Analysis, Insights and Forecast - by Region
- 5.5.1. Europe
- 5.1. Market Analysis, Insights and Forecast - by Technology
- 6. Europe Power to Gas Market Analysis, Insights and Forecast, 2021-2033
- 6.1. Market Analysis, Insights and Forecast - by Technology
- 6.1.1. Power-to
- 6.1.2. Power-to-Methane (incl. Chemical and Biological)
- 6.2. Market Analysis, Insights and Forecast - by Capacity
- 6.2.1. More than 1000 KW
- 6.2.2. 100 to 1000 KW
- 6.2.3. Less than 100 KW
- 6.3. Market Analysis, Insights and Forecast - by End-User
- 6.3.1. Utilities
- 6.3.2. Industrial
- 6.3.3. Commercial
- 6.4. Market Analysis, Insights and Forecast - by Location
- 6.4.1. United Kingdom
- 6.4.2. Germany
- 6.4.3. France
- 6.4.4. Spain
- 6.4.5. Others
- 6.1. Market Analysis, Insights and Forecast - by Technology
- 7. Competitive Analysis
- 7.1. Company Profiles
- 7.1.1 Siemens Energy AG
- 7.1.1.1. Company Overview
- 7.1.1.2. Products
- 7.1.1.3. Company Financials
- 7.1.1.4. SWOT Analysis
- 7.1.2 GRT Gaz SA
- 7.1.2.1. Company Overview
- 7.1.2.2. Products
- 7.1.2.3. Company Financials
- 7.1.2.4. SWOT Analysis
- 7.1.3 AquahydreX Inc
- 7.1.3.1. Company Overview
- 7.1.3.2. Products
- 7.1.3.3. Company Financials
- 7.1.3.4. SWOT Analysis
- 7.1.4 Ineratec GmbH
- 7.1.4.1. Company Overview
- 7.1.4.2. Products
- 7.1.4.3. Company Financials
- 7.1.4.4. SWOT Analysis
- 7.1.5 Electrochaea GmbH
- 7.1.5.1. Company Overview
- 7.1.5.2. Products
- 7.1.5.3. Company Financials
- 7.1.5.4. SWOT Analysis
- 7.1.6 Sempra Energy
- 7.1.6.1. Company Overview
- 7.1.6.2. Products
- 7.1.6.3. Company Financials
- 7.1.6.4. SWOT Analysis
- 7.1.7 Nel ASA
- 7.1.7.1. Company Overview
- 7.1.7.2. Products
- 7.1.7.3. Company Financials
- 7.1.7.4. SWOT Analysis
- 7.1.1 Siemens Energy AG
- 7.2. Market Entropy
- 7.2.1 Company's Key Areas Served
- 7.2.2 Recent Developments
- 7.3. Company Market Share Analysis 2025
- 7.3.1 Top 5 Companies Market Share Analysis
- 7.3.2 Top 3 Companies Market Share Analysis
- 7.4. List of Potential Customers
- 8. Research Methodology
List of Figures
- Figure 1: Europe Power to Gas Market Revenue Breakdown (billion, %) by Product 2025 & 2033
- Figure 2: Europe Power to Gas Market Share (%) by Company 2025
List of Tables
- Table 1: Europe Power to Gas Market Revenue billion Forecast, by Technology 2020 & 2033
- Table 2: Europe Power to Gas Market Volume Gigawatt Forecast, by Technology 2020 & 2033
- Table 3: Europe Power to Gas Market Revenue billion Forecast, by Capacity 2020 & 2033
- Table 4: Europe Power to Gas Market Volume Gigawatt Forecast, by Capacity 2020 & 2033
- Table 5: Europe Power to Gas Market Revenue billion Forecast, by End-User 2020 & 2033
- Table 6: Europe Power to Gas Market Volume Gigawatt Forecast, by End-User 2020 & 2033
- Table 7: Europe Power to Gas Market Revenue billion Forecast, by Location 2020 & 2033
- Table 8: Europe Power to Gas Market Volume Gigawatt Forecast, by Location 2020 & 2033
- Table 9: Europe Power to Gas Market Revenue billion Forecast, by Region 2020 & 2033
- Table 10: Europe Power to Gas Market Volume Gigawatt Forecast, by Region 2020 & 2033
- Table 11: Europe Power to Gas Market Revenue billion Forecast, by Technology 2020 & 2033
- Table 12: Europe Power to Gas Market Volume Gigawatt Forecast, by Technology 2020 & 2033
- Table 13: Europe Power to Gas Market Revenue billion Forecast, by Capacity 2020 & 2033
- Table 14: Europe Power to Gas Market Volume Gigawatt Forecast, by Capacity 2020 & 2033
- Table 15: Europe Power to Gas Market Revenue billion Forecast, by End-User 2020 & 2033
- Table 16: Europe Power to Gas Market Volume Gigawatt Forecast, by End-User 2020 & 2033
- Table 17: Europe Power to Gas Market Revenue billion Forecast, by Location 2020 & 2033
- Table 18: Europe Power to Gas Market Volume Gigawatt Forecast, by Location 2020 & 2033
- Table 19: Europe Power to Gas Market Revenue billion Forecast, by Country 2020 & 2033
- Table 20: Europe Power to Gas Market Volume Gigawatt Forecast, by Country 2020 & 2033
- Table 21: United Kingdom Europe Power to Gas Market Revenue (billion) Forecast, by Application 2020 & 2033
- Table 22: United Kingdom Europe Power to Gas Market Volume (Gigawatt) Forecast, by Application 2020 & 2033
- Table 23: Germany Europe Power to Gas Market Revenue (billion) Forecast, by Application 2020 & 2033
- Table 24: Germany Europe Power to Gas Market Volume (Gigawatt) Forecast, by Application 2020 & 2033
- Table 25: France Europe Power to Gas Market Revenue (billion) Forecast, by Application 2020 & 2033
- Table 26: France Europe Power to Gas Market Volume (Gigawatt) Forecast, by Application 2020 & 2033
- Table 27: Italy Europe Power to Gas Market Revenue (billion) Forecast, by Application 2020 & 2033
- Table 28: Italy Europe Power to Gas Market Volume (Gigawatt) Forecast, by Application 2020 & 2033
- Table 29: Spain Europe Power to Gas Market Revenue (billion) Forecast, by Application 2020 & 2033
- Table 30: Spain Europe Power to Gas Market Volume (Gigawatt) Forecast, by Application 2020 & 2033
- Table 31: Netherlands Europe Power to Gas Market Revenue (billion) Forecast, by Application 2020 & 2033
- Table 32: Netherlands Europe Power to Gas Market Volume (Gigawatt) Forecast, by Application 2020 & 2033
- Table 33: Belgium Europe Power to Gas Market Revenue (billion) Forecast, by Application 2020 & 2033
- Table 34: Belgium Europe Power to Gas Market Volume (Gigawatt) Forecast, by Application 2020 & 2033
- Table 35: Sweden Europe Power to Gas Market Revenue (billion) Forecast, by Application 2020 & 2033
- Table 36: Sweden Europe Power to Gas Market Volume (Gigawatt) Forecast, by Application 2020 & 2033
- Table 37: Norway Europe Power to Gas Market Revenue (billion) Forecast, by Application 2020 & 2033
- Table 38: Norway Europe Power to Gas Market Volume (Gigawatt) Forecast, by Application 2020 & 2033
- Table 39: Poland Europe Power to Gas Market Revenue (billion) Forecast, by Application 2020 & 2033
- Table 40: Poland Europe Power to Gas Market Volume (Gigawatt) Forecast, by Application 2020 & 2033
- Table 41: Denmark Europe Power to Gas Market Revenue (billion) Forecast, by Application 2020 & 2033
- Table 42: Denmark Europe Power to Gas Market Volume (Gigawatt) Forecast, by Application 2020 & 2033
Frequently Asked Questions
1. What is the projected Compound Annual Growth Rate (CAGR) of the Europe Power to Gas Market?
The projected CAGR is approximately 11.35%.
2. Which companies are prominent players in the Europe Power to Gas Market?
Key companies in the market include Siemens Energy AG, GRT Gaz SA, AquahydreX Inc, Ineratec GmbH, Electrochaea GmbH, Sempra Energy, Nel ASA.
3. What are the main segments of the Europe Power to Gas Market?
The market segments include Technology, Capacity, End-User, Location.
4. Can you provide details about the market size?
The market size is estimated to be USD 46.76 billion as of 2022.
5. What are some drivers contributing to market growth?
4.; Growing Demand to Develop the Natural Gas Infrastructure4.; Increase in Offshore Oil and Gas Exploration and Production (E&P) Activities.
6. What are the notable trends driving market growth?
Germany is going to dominate the market.
7. Are there any restraints impacting market growth?
4.; High Volatility of Oil and Gas Prices.
8. Can you provide examples of recent developments in the market?
In March 2022. Environmental Resources Management's (ERM) ERM Dolphyn and Source Energie have entered into a partnership to develop a 200 floating wind to hydrogen project in the United Kingdom. The project is expected to be commissioned by 2027 and is likely to produce green hydrogen.
9. What pricing options are available for accessing the report?
Pricing options include single-user, multi-user, and enterprise licenses priced at USD 4750, USD 5250, and USD 8750 respectively.
10. Is the market size provided in terms of value or volume?
The market size is provided in terms of value, measured in billion and volume, measured in Gigawatt.
11. Are there any specific market keywords associated with the report?
Yes, the market keyword associated with the report is "Europe Power to Gas Market," which aids in identifying and referencing the specific market segment covered.
12. How do I determine which pricing option suits my needs best?
The pricing options vary based on user requirements and access needs. Individual users may opt for single-user licenses, while businesses requiring broader access may choose multi-user or enterprise licenses for cost-effective access to the report.
13. Are there any additional resources or data provided in the Europe Power to Gas Market report?
While the report offers comprehensive insights, it's advisable to review the specific contents or supplementary materials provided to ascertain if additional resources or data are available.
14. How can I stay updated on further developments or reports in the Europe Power to Gas Market?
To stay informed about further developments, trends, and reports in the Europe Power to Gas Market, consider subscribing to industry newsletters, following relevant companies and organizations, or regularly checking reputable industry news sources and publications.
Methodology
Step 1 - Identification of Relevant Samples Size from Population Database


Step 2 - Approaches for Defining Global Market Size (Value, Volume* & Price*)

Note*: In applicable scenarios
Step 3 - Data Sources
Primary Research
- Web Analytics
- Survey Reports
- Research Institute
- Latest Research Reports
- Opinion Leaders
Secondary Research
- Annual Reports
- White Paper
- Latest Press Release
- Industry Association
- Paid Database
- Investor Presentations

Step 4 - Data Triangulation
Involves using different sources of information in order to increase the validity of a study
These sources are likely to be stakeholders in a program - participants, other researchers, program staff, other community members, and so on.
Then we put all data in single framework & apply various statistical tools to find out the dynamic on the market.
During the analysis stage, feedback from the stakeholder groups would be compared to determine areas of agreement as well as areas of divergence