

Key Insights
The Energy as a Service (EaaS) market, currently valued at $94.16 million in 2025, is experiencing robust growth, projected to expand at a Compound Annual Growth Rate (CAGR) of 12.48% from 2025 to 2033. This surge is driven by several key factors. Firstly, increasing energy costs and the urgent need for energy efficiency are pushing businesses and industries to adopt EaaS models, offering predictable operational expenses and reduced capital expenditure. Secondly, the growing adoption of renewable energy sources and smart technologies within EaaS solutions further enhances their appeal, aligning with sustainability goals and offering optimized energy consumption. Furthermore, the expanding digitalization of energy infrastructure creates opportunities for advanced data analytics and remote monitoring, enabling proactive maintenance and improved performance. Strong government policies promoting energy efficiency and renewable integration are also contributing significantly to market expansion.
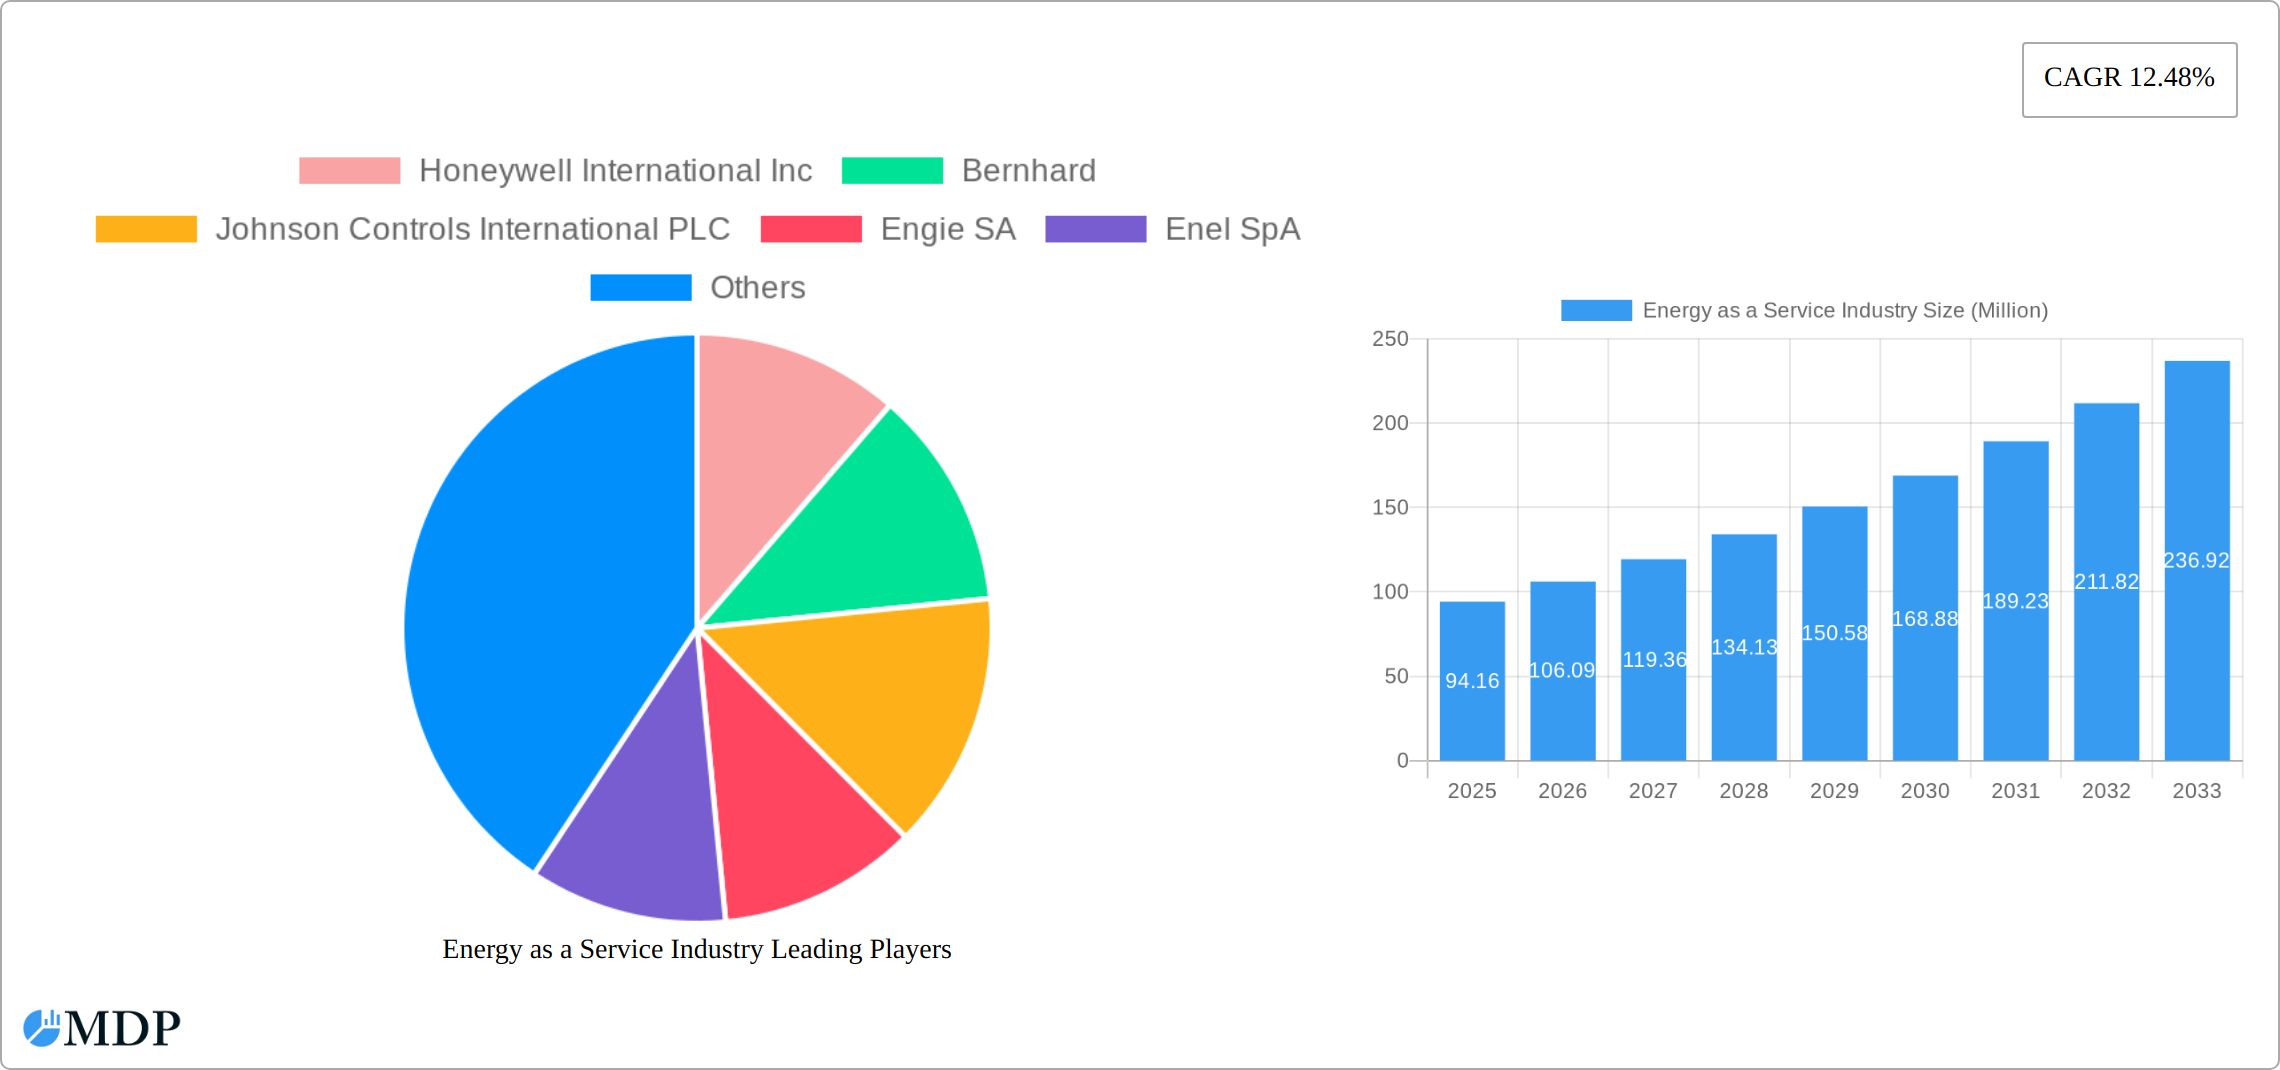
Energy as a Service Industry Market Size (In Million)
However, the market faces challenges. Initial investment costs can be a barrier for some businesses, and the complexity of implementing and managing EaaS contracts requires specialized expertise. Data security concerns associated with connected energy systems also need to be addressed. Despite these limitations, the long-term benefits of reduced operational costs, improved energy efficiency, and enhanced sustainability make EaaS a compelling solution, particularly for businesses seeking cost optimization and environmental responsibility. Market segmentation reveals significant growth potential in both commercial and industrial sectors, with North America and Europe currently leading market adoption, followed by rapidly growing markets in the Asia-Pacific region. Key players like Honeywell International Inc, Johnson Controls International PLC, and Schneider Electric SE are actively shaping the market through innovation and strategic partnerships.
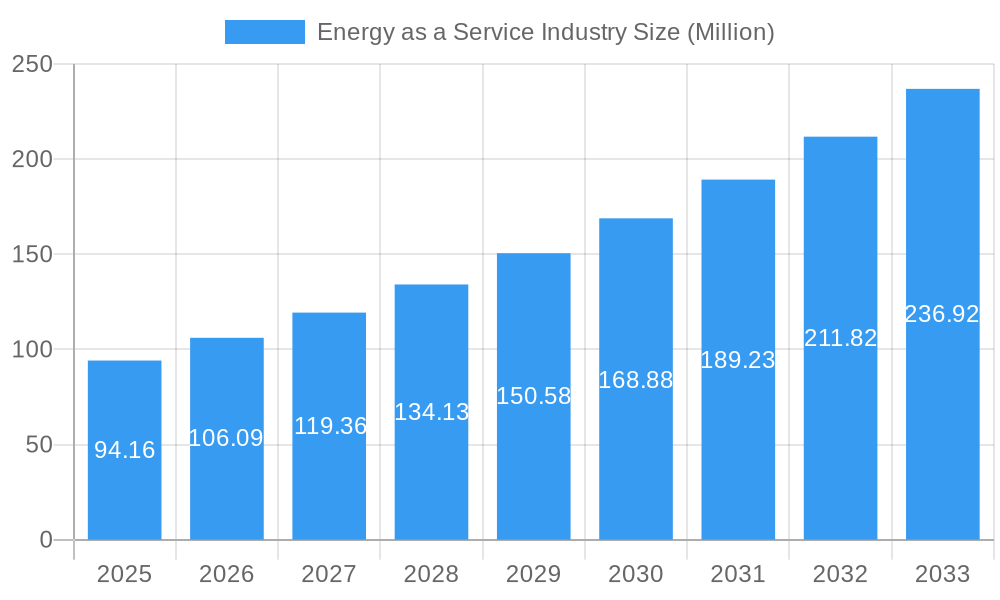
Energy as a Service Industry Company Market Share
Energy as a Service (EaaS) Industry Report: 2019-2033
Unlocking the Potential of the Multi-Billion Dollar Energy as a Service Market
This comprehensive report provides an in-depth analysis of the Energy as a Service (EaaS) industry, offering invaluable insights for stakeholders seeking to navigate this rapidly evolving landscape. With a study period spanning 2019-2033, a base year of 2025, and a forecast period of 2025-2033, this report delivers actionable intelligence based on rigorous data analysis and expert insights. The market is projected to reach xx Million by 2033, demonstrating substantial growth potential. Key players like Honeywell International Inc, Bernhard, Johnson Controls International PLC, Engie SA, Enel SpA, Spark Community Investment Co, Schneider Electric SE, Veolia Environnement SA, and Electricite de France (EDF) SA are shaping the future of EaaS.
Energy as a Service Industry Market Dynamics & Concentration
The Energy-as-a-Service (EaaS) market is experiencing robust growth, fueled by escalating energy costs, increasingly stringent environmental regulations, and the widespread adoption of smart technologies. While market concentration is currently moderate, with several key players commanding significant market share, the landscape is highly dynamic. A wave of innovation continuously introduces new entrants, challenging established players. Mergers and acquisitions (M&A) activity, averaging approximately xx deals annually from 2019-2024, signifies a consolidating market trend, indicating a shift towards larger, more integrated service providers.
- Market Concentration: In 2024, the top 5 players accounted for approximately xx% of the global market share, highlighting the presence of established market leaders.
- Innovation Drivers: Technological advancements, particularly in renewable energy sources (solar, wind, etc.), the Internet of Things (IoT), Artificial Intelligence (AI), and sophisticated energy management systems (EMS), are driving rapid innovation and improved service offerings.
- Regulatory Frameworks: Government policies actively promoting energy efficiency and the transition to renewable energy sources are crucial catalysts for market expansion, creating both incentives and mandates for EaaS adoption.
- Product Substitutes: Traditional energy procurement models remain a primary alternative, but their inherent cost inefficiencies and significant environmental impact are increasingly driving businesses towards the cost-effectiveness and sustainability advantages offered by EaaS.
- End-User Trends: The escalating demand for cost-effective, sustainable, and predictable energy solutions across commercial and industrial sectors is the primary engine of EaaS market growth, driving adoption across a range of applications and business needs.
- M&A Activities: Strategic mergers and acquisitions are not only accelerating market consolidation but also expanding the scope and capabilities of EaaS service offerings, leading to more comprehensive and integrated solutions.
Energy as a Service Industry Industry Trends & Analysis
The EaaS market is projected to exhibit a Compound Annual Growth Rate (CAGR) of xx% during the forecast period (2025-2033). This impressive growth trajectory is driven by several interconnected factors: heightened awareness of energy efficiency and sustainability imperatives, the continuous decline in the cost of renewable energy technologies, and the accelerating adoption of smart building technologies. The market penetration rate in the commercial sector is estimated at xx% in 2025, poised to rise to xx% by 2033, reflecting the increasing uptake of EaaS solutions across various commercial applications. The competitive landscape remains vibrant, with both established energy companies and innovative new entrants vying for market share, fostering a dynamic and innovative market environment. A key trend is the evolving consumer preference for flexible, predictable, and environmentally conscious energy solutions, further solidifying the demand for EaaS offerings.
Leading Markets & Segments in Energy as a Service Industry
The industrial segment currently holds the leading position in the EaaS market, accounting for approximately xx% of the market share in 2025. This segment's considerable energy consumption and the substantial potential for cost optimization through EaaS solutions are key drivers of its dominant market share.
- Key Drivers in the Industrial Segment:
- Energy efficiency regulations: Stringent environmental regulations are increasingly compelling industrial facilities to adopt EaaS solutions to meet compliance requirements and reduce their environmental footprint.
- Operational cost optimization: EaaS models empower industries to significantly reduce energy costs and enhance operational efficiency, providing a strong financial incentive for adoption.
- Technological advancements: Continuous innovations in energy management and IoT technologies are enhancing the value proposition of EaaS, providing more sophisticated and valuable solutions.
- Dominance Analysis: The industrial sector's high energy consumption, coupled with the significant potential for cost savings and substantial improvements in sustainability, firmly establishes it as the leading segment for EaaS adoption. The prevalence of large-scale energy management projects within industrial settings creates a uniquely favorable environment for the deployment and implementation of EaaS solutions.
Energy as a Service Industry Product Developments
Recent product innovations in the EaaS sector are focused on seamlessly integrating advanced analytics, AI-driven optimization algorithms, and renewable energy sources into service offerings. These enhancements deliver superior cost management capabilities, significantly improved energy efficiency, and robust sustainability features, appealing to businesses seeking to minimize environmental impact and operational costs. A noteworthy trend is the market's clear shift towards holistic energy solutions that address the entire energy consumption lifecycle, from generation to distribution and intelligent optimization. This integrated approach provides a substantial competitive advantage, attracting customers seeking comprehensive and streamlined energy management capabilities.
Key Drivers of Energy as a Service Industry Growth
Several factors drive EaaS market growth, including:
- Technological advancements: Improvements in renewable energy technologies, energy storage systems, and smart grid infrastructure facilitate EaaS adoption.
- Economic factors: Rising energy costs and the need to reduce operational expenditures are driving the demand for cost-effective EaaS solutions.
- Regulatory policies: Government incentives and regulations promoting energy efficiency and renewable energy are fueling market expansion. For instance, tax credits and subsidies for adopting energy-efficient technologies are making EaaS more attractive.
Challenges in the Energy as a Service Industry Market
The EaaS market faces challenges including:
- Regulatory hurdles: Complex regulatory frameworks and varying energy policies across different regions can hinder market expansion.
- Supply chain issues: Disruptions in the supply chain can impact the availability and cost of EaaS components.
- Competitive pressures: The market is characterized by intense competition, requiring companies to offer innovative and cost-effective solutions to succeed. The estimated impact of these challenges on the market value in 2025 is approximately xx Million.
Emerging Opportunities in Energy as a Service Industry
Long-term growth opportunities for the EaaS sector are abundant and diverse, presenting significant potential for expansion and innovation:
- Technological breakthroughs: Advancements in AI, machine learning, and blockchain technology possess the potential to revolutionize energy management, unlocking entirely new EaaS offerings and creating opportunities for significant market disruption.
- Strategic partnerships: Collaborative efforts between energy providers, technology companies, and building owners (or industrial facility managers) can unlock unprecedented market opportunities, leveraging the expertise and resources of various stakeholders to create more effective and impactful solutions.
- Market expansion: Expanding into new geographical regions with burgeoning energy demands and supportive regulatory environments offers substantial growth potential, allowing EaaS providers to scale their operations and reach new customer bases.
Leading Players in the Energy as a Service Industry Sector
- Honeywell International Inc
- Bernhard
- Johnson Controls International PLC
- Engie SA
- Enel SpA
- Spark Community Investment Co
- Schneider Electric SE
- Veolia Environnement SA
- Electricite de France (EDF) SA
Key Milestones in Energy as a Service Industry Industry
- March 2023: Honeywell announced a strategic investment in Redaptive to accelerate the development and deployment of EaaS capabilities for commercial and industrial buildings. This significantly boosted the market’s focus on technology-driven solutions.
- April 2023: Capstone Green Energy Corporation secured a contract to deliver an additional C800S microturbine, following an earlier 3.6 MW EaaS contract. This exemplifies the growing adoption of microturbines within the EaaS model.
Strategic Outlook for Energy as a Service Industry Market
The EaaS market is poised for significant growth driven by increasing demand for sustainable and cost-effective energy solutions. Strategic opportunities abound for companies that can leverage technological advancements, forge strategic partnerships, and effectively address the challenges posed by regulatory hurdles and supply chain complexities. The long-term outlook remains positive, projecting a substantial increase in market size and penetration across various sectors and geographies.
Energy as a Service Industry Segmentation
-
1. End User
- 1.1. Commercial
- 1.2. Industrial
Energy as a Service Industry Segmentation By Geography
-
1. North America
- 1.1. United States
- 1.2. Canada
- 1.3. Rest of North America
-
2. Europe
- 2.1. Germany
- 2.2. France
- 2.3. United Kingdom
- 2.4. Rest of Europe
-
3. Asia Pacific
- 3.1. China
- 3.2. India
- 3.3. Japan
- 3.4. South Korea
- 3.5. Rest of Asia Pacific
-
4. South America
- 4.1. Brazil
- 4.2. Argentina
- 4.3. Rest of South America
-
5. Middle East and Africa
- 5.1. Saudi Arabia
- 5.2. United Arab Emirates
- 5.3. South Africa
- 5.4. Rest of Middle East and Africa
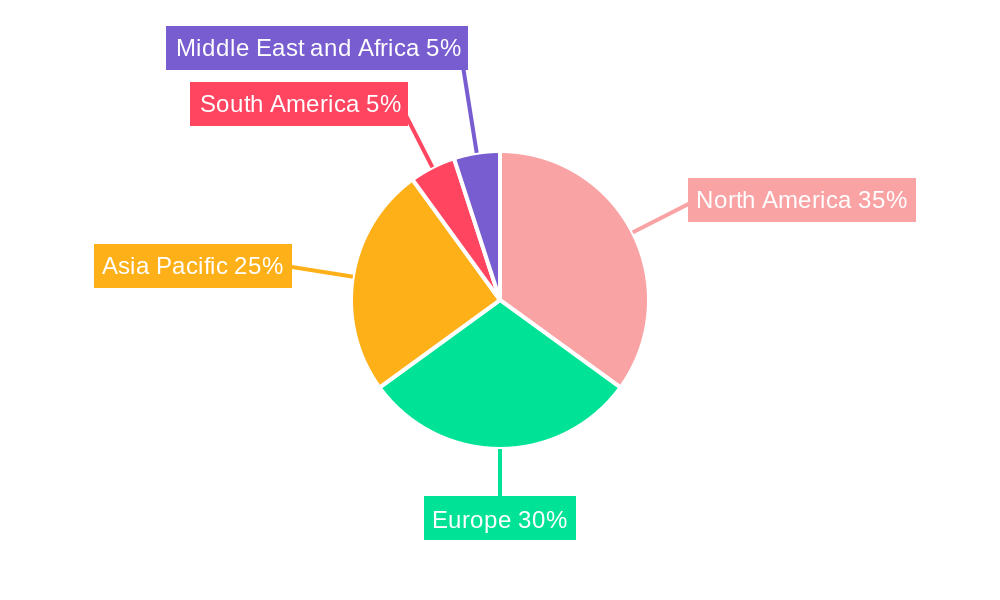
Energy as a Service Industry Regional Market Share
Geographic Coverage of Energy as a Service Industry
Energy as a Service Industry REPORT HIGHLIGHTS
| Aspects | Details |
|---|---|
| Study Period | 2020-2034 |
| Base Year | 2025 |
| Estimated Year | 2026 |
| Forecast Period | 2026-2034 |
| Historical Period | 2020-2025 |
| Growth Rate | CAGR of 12.48% from 2020-2034 |
| Segmentation |
|
Table of Contents
- 1. Introduction
- 1.1. Research Scope
- 1.2. Market Segmentation
- 1.3. Research Objective
- 1.4. Definitions and Assumptions
- 2. Executive Summary
- 2.1. Market Snapshot
- 3. Market Dynamics
- 3.1. Market Drivers
- 3.2. Market Restrains
- 3.3. Market Trends
- 3.4. Market Opportunities
- 4. Market Factor Analysis
- 4.1. Porters Five Forces
- 4.1.1. Bargaining Power of Suppliers
- 4.1.2. Bargaining Power of Buyers
- 4.1.3. Threat of New Entrants
- 4.1.4. Threat of Substitutes
- 4.1.5. Competitive Rivalry
- 4.2. PESTEL analysis
- 4.3. BCG Analysis
- 4.3.1. Stars (High Growth, High Market Share)
- 4.3.2. Cash Cows (Low Growth, High Market Share)
- 4.3.3. Question Mark (High Growth, Low Market Share)
- 4.3.4. Dogs (Low Growth, Low Market Share)
- 4.4. Ansoff Matrix Analysis
- 4.5. Supply Chain Analysis
- 4.6. Regulatory Landscape
- 4.7. Current Market Potential and Opportunity Assessment (TAM–SAM–SOM Framework)
- 4.8. MDP Analyst Note
- 4.1. Porters Five Forces
- 5. Market Analysis, Insights and Forecast 2021-2033
- 5.1. Market Analysis, Insights and Forecast - by End User
- 5.1.1. Commercial
- 5.1.2. Industrial
- 5.2. Market Analysis, Insights and Forecast - by Region
- 5.2.1. North America
- 5.2.2. Europe
- 5.2.3. Asia Pacific
- 5.2.4. South America
- 5.2.5. Middle East and Africa
- 5.1. Market Analysis, Insights and Forecast - by End User
- 6. Global Energy as a Service Industry Analysis, Insights and Forecast, 2021-2033
- 6.1. Market Analysis, Insights and Forecast - by End User
- 6.1.1. Commercial
- 6.1.2. Industrial
- 6.1. Market Analysis, Insights and Forecast - by End User
- 7. North America Energy as a Service Industry Analysis, Insights and Forecast, 2020-2032
- 7.1. Market Analysis, Insights and Forecast - by End User
- 7.1.1. Commercial
- 7.1.2. Industrial
- 7.1. Market Analysis, Insights and Forecast - by End User
- 8. Europe Energy as a Service Industry Analysis, Insights and Forecast, 2020-2032
- 8.1. Market Analysis, Insights and Forecast - by End User
- 8.1.1. Commercial
- 8.1.2. Industrial
- 8.1. Market Analysis, Insights and Forecast - by End User
- 9. Asia Pacific Energy as a Service Industry Analysis, Insights and Forecast, 2020-2032
- 9.1. Market Analysis, Insights and Forecast - by End User
- 9.1.1. Commercial
- 9.1.2. Industrial
- 9.1. Market Analysis, Insights and Forecast - by End User
- 10. South America Energy as a Service Industry Analysis, Insights and Forecast, 2020-2032
- 10.1. Market Analysis, Insights and Forecast - by End User
- 10.1.1. Commercial
- 10.1.2. Industrial
- 10.1. Market Analysis, Insights and Forecast - by End User
- 11. Middle East and Africa Energy as a Service Industry Analysis, Insights and Forecast, 2020-2032
- 11.1. Market Analysis, Insights and Forecast - by End User
- 11.1.1. Commercial
- 11.1.2. Industrial
- 11.1. Market Analysis, Insights and Forecast - by End User
- 12. Competitive Analysis
- 12.1. Company Profiles
- 12.1.1 Honeywell International Inc
- 12.1.1.1. Company Overview
- 12.1.1.2. Products
- 12.1.1.3. Company Financials
- 12.1.1.4. SWOT Analysis
- 12.1.2 Bernhard
- 12.1.2.1. Company Overview
- 12.1.2.2. Products
- 12.1.2.3. Company Financials
- 12.1.2.4. SWOT Analysis
- 12.1.3 Johnson Controls International PLC
- 12.1.3.1. Company Overview
- 12.1.3.2. Products
- 12.1.3.3. Company Financials
- 12.1.3.4. SWOT Analysis
- 12.1.4 Engie SA
- 12.1.4.1. Company Overview
- 12.1.4.2. Products
- 12.1.4.3. Company Financials
- 12.1.4.4. SWOT Analysis
- 12.1.5 Enel SpA
- 12.1.5.1. Company Overview
- 12.1.5.2. Products
- 12.1.5.3. Company Financials
- 12.1.5.4. SWOT Analysis
- 12.1.6 Spark Community Investment Co
- 12.1.6.1. Company Overview
- 12.1.6.2. Products
- 12.1.6.3. Company Financials
- 12.1.6.4. SWOT Analysis
- 12.1.7 Schneider Electric SE
- 12.1.7.1. Company Overview
- 12.1.7.2. Products
- 12.1.7.3. Company Financials
- 12.1.7.4. SWOT Analysis
- 12.1.8 Veolia Environnement SA
- 12.1.8.1. Company Overview
- 12.1.8.2. Products
- 12.1.8.3. Company Financials
- 12.1.8.4. SWOT Analysis
- 12.1.9 Electricite de France (EDF) SA
- 12.1.9.1. Company Overview
- 12.1.9.2. Products
- 12.1.9.3. Company Financials
- 12.1.9.4. SWOT Analysis
- 12.1.1 Honeywell International Inc
- 12.2. Market Entropy
- 12.2.1 Company's Key Areas Served
- 12.2.2 Recent Developments
- 12.3. Company Market Share Analysis 2025
- 12.3.1 Top 5 Companies Market Share Analysis
- 12.3.2 Top 3 Companies Market Share Analysis
- 12.4. List of Potential Customers
- 13. Research Methodology
List of Figures
- Figure 1: Global Energy as a Service Industry Revenue Breakdown (Million, %) by Region 2025 & 2033
- Figure 2: North America Energy as a Service Industry Revenue (Million), by End User 2025 & 2033
- Figure 3: North America Energy as a Service Industry Revenue Share (%), by End User 2025 & 2033
- Figure 4: North America Energy as a Service Industry Revenue (Million), by Country 2025 & 2033
- Figure 5: North America Energy as a Service Industry Revenue Share (%), by Country 2025 & 2033
- Figure 6: Europe Energy as a Service Industry Revenue (Million), by End User 2025 & 2033
- Figure 7: Europe Energy as a Service Industry Revenue Share (%), by End User 2025 & 2033
- Figure 8: Europe Energy as a Service Industry Revenue (Million), by Country 2025 & 2033
- Figure 9: Europe Energy as a Service Industry Revenue Share (%), by Country 2025 & 2033
- Figure 10: Asia Pacific Energy as a Service Industry Revenue (Million), by End User 2025 & 2033
- Figure 11: Asia Pacific Energy as a Service Industry Revenue Share (%), by End User 2025 & 2033
- Figure 12: Asia Pacific Energy as a Service Industry Revenue (Million), by Country 2025 & 2033
- Figure 13: Asia Pacific Energy as a Service Industry Revenue Share (%), by Country 2025 & 2033
- Figure 14: South America Energy as a Service Industry Revenue (Million), by End User 2025 & 2033
- Figure 15: South America Energy as a Service Industry Revenue Share (%), by End User 2025 & 2033
- Figure 16: South America Energy as a Service Industry Revenue (Million), by Country 2025 & 2033
- Figure 17: South America Energy as a Service Industry Revenue Share (%), by Country 2025 & 2033
- Figure 18: Middle East and Africa Energy as a Service Industry Revenue (Million), by End User 2025 & 2033
- Figure 19: Middle East and Africa Energy as a Service Industry Revenue Share (%), by End User 2025 & 2033
- Figure 20: Middle East and Africa Energy as a Service Industry Revenue (Million), by Country 2025 & 2033
- Figure 21: Middle East and Africa Energy as a Service Industry Revenue Share (%), by Country 2025 & 2033
List of Tables
- Table 1: Global Energy as a Service Industry Revenue Million Forecast, by End User 2020 & 2033
- Table 2: Global Energy as a Service Industry Revenue Million Forecast, by Region 2020 & 2033
- Table 3: Global Energy as a Service Industry Revenue Million Forecast, by End User 2020 & 2033
- Table 4: Global Energy as a Service Industry Revenue Million Forecast, by Country 2020 & 2033
- Table 5: United States Energy as a Service Industry Revenue (Million) Forecast, by Application 2020 & 2033
- Table 6: Canada Energy as a Service Industry Revenue (Million) Forecast, by Application 2020 & 2033
- Table 7: Rest of North America Energy as a Service Industry Revenue (Million) Forecast, by Application 2020 & 2033
- Table 8: Global Energy as a Service Industry Revenue Million Forecast, by End User 2020 & 2033
- Table 9: Global Energy as a Service Industry Revenue Million Forecast, by Country 2020 & 2033
- Table 10: Germany Energy as a Service Industry Revenue (Million) Forecast, by Application 2020 & 2033
- Table 11: France Energy as a Service Industry Revenue (Million) Forecast, by Application 2020 & 2033
- Table 12: United Kingdom Energy as a Service Industry Revenue (Million) Forecast, by Application 2020 & 2033
- Table 13: Rest of Europe Energy as a Service Industry Revenue (Million) Forecast, by Application 2020 & 2033
- Table 14: Global Energy as a Service Industry Revenue Million Forecast, by End User 2020 & 2033
- Table 15: Global Energy as a Service Industry Revenue Million Forecast, by Country 2020 & 2033
- Table 16: China Energy as a Service Industry Revenue (Million) Forecast, by Application 2020 & 2033
- Table 17: India Energy as a Service Industry Revenue (Million) Forecast, by Application 2020 & 2033
- Table 18: Japan Energy as a Service Industry Revenue (Million) Forecast, by Application 2020 & 2033
- Table 19: South Korea Energy as a Service Industry Revenue (Million) Forecast, by Application 2020 & 2033
- Table 20: Rest of Asia Pacific Energy as a Service Industry Revenue (Million) Forecast, by Application 2020 & 2033
- Table 21: Global Energy as a Service Industry Revenue Million Forecast, by End User 2020 & 2033
- Table 22: Global Energy as a Service Industry Revenue Million Forecast, by Country 2020 & 2033
- Table 23: Brazil Energy as a Service Industry Revenue (Million) Forecast, by Application 2020 & 2033
- Table 24: Argentina Energy as a Service Industry Revenue (Million) Forecast, by Application 2020 & 2033
- Table 25: Rest of South America Energy as a Service Industry Revenue (Million) Forecast, by Application 2020 & 2033
- Table 26: Global Energy as a Service Industry Revenue Million Forecast, by End User 2020 & 2033
- Table 27: Global Energy as a Service Industry Revenue Million Forecast, by Country 2020 & 2033
- Table 28: Saudi Arabia Energy as a Service Industry Revenue (Million) Forecast, by Application 2020 & 2033
- Table 29: United Arab Emirates Energy as a Service Industry Revenue (Million) Forecast, by Application 2020 & 2033
- Table 30: South Africa Energy as a Service Industry Revenue (Million) Forecast, by Application 2020 & 2033
- Table 31: Rest of Middle East and Africa Energy as a Service Industry Revenue (Million) Forecast, by Application 2020 & 2033
Frequently Asked Questions
1. What is the projected Compound Annual Growth Rate (CAGR) of the Energy as a Service Industry?
The projected CAGR is approximately 12.48%.
2. Which companies are prominent players in the Energy as a Service Industry?
Key companies in the market include Honeywell International Inc, Bernhard, Johnson Controls International PLC, Engie SA, Enel SpA, Spark Community Investment Co, Schneider Electric SE, Veolia Environnement SA, Electricite de France (EDF) SA.
3. What are the main segments of the Energy as a Service Industry?
The market segments include End User.
4. Can you provide details about the market size?
The market size is estimated to be USD 94.16 Million as of 2022.
5. What are some drivers contributing to market growth?
4.; Growing Demand for Energy As A Service4.; Increasing Adoption of Distributed Energy Generation in Commercial and Industrial Sectors.
6. What are the notable trends driving market growth?
Commercial Segment to Dominate the Market.
7. Are there any restraints impacting market growth?
4.; Lack of Awareness in Developing Economies and High Technological Costs.
8. Can you provide examples of recent developments in the market?
April 2023: Capstone Green Energy Corporation announced that its southern U.S. distributor, Lone Star Power Solutions, contracted with a large West Texas energy company to deliver an additional C800S Signature Series microturbine following Energy-as-a-Service (EaaS) for 3.6 MW contract earlier this year.
9. What pricing options are available for accessing the report?
Pricing options include single-user, multi-user, and enterprise licenses priced at USD 4750, USD 5250, and USD 8750 respectively.
10. Is the market size provided in terms of value or volume?
The market size is provided in terms of value, measured in Million.
11. Are there any specific market keywords associated with the report?
Yes, the market keyword associated with the report is "Energy as a Service Industry," which aids in identifying and referencing the specific market segment covered.
12. How do I determine which pricing option suits my needs best?
The pricing options vary based on user requirements and access needs. Individual users may opt for single-user licenses, while businesses requiring broader access may choose multi-user or enterprise licenses for cost-effective access to the report.
13. Are there any additional resources or data provided in the Energy as a Service Industry report?
While the report offers comprehensive insights, it's advisable to review the specific contents or supplementary materials provided to ascertain if additional resources or data are available.
14. How can I stay updated on further developments or reports in the Energy as a Service Industry?
To stay informed about further developments, trends, and reports in the Energy as a Service Industry, consider subscribing to industry newsletters, following relevant companies and organizations, or regularly checking reputable industry news sources and publications.
Methodology
Step 1 - Identification of Relevant Samples Size from Population Database


Step 2 - Approaches for Defining Global Market Size (Value, Volume* & Price*)

Note*: In applicable scenarios
Step 3 - Data Sources
Primary Research
- Web Analytics
- Survey Reports
- Research Institute
- Latest Research Reports
- Opinion Leaders
Secondary Research
- Annual Reports
- White Paper
- Latest Press Release
- Industry Association
- Paid Database
- Investor Presentations

Step 4 - Data Triangulation
Involves using different sources of information in order to increase the validity of a study
These sources are likely to be stakeholders in a program - participants, other researchers, program staff, other community members, and so on.
Then we put all data in single framework & apply various statistical tools to find out the dynamic on the market.
During the analysis stage, feedback from the stakeholder groups would be compared to determine areas of agreement as well as areas of divergence