

Key Insights
The electric traction motor market is poised for substantial expansion, driven by the global imperative for sustainable transportation and increasing electrification across diverse industries. With a projected market size of $15.87 billion in 2025 and a compound annual growth rate (CAGR) of 8.82%, this sector is set for significant value by 2033. Key catalysts include stringent environmental regulations mandating electric vehicles (EVs) and widespread railway modernization efforts. The accelerating adoption of EVs in passenger and commercial segments, alongside the growth of high-speed rail, directly fuels demand for high-performance, energy-efficient electric traction motors. Technological innovations in motor design and power electronics further bolster market growth. While substantial initial infrastructure investment and potential supply chain vulnerabilities present challenges, the long-term environmental and operational advantages offer compelling justification for market expansion. Analysis of market segmentation reveals AC motors currently lead due to their superior performance in high-speed applications, though DC motors are finding traction in specialized niches. In terms of power ratings, motors below 200 kW dominate, primarily serving smaller EVs and railway applications. However, segments exceeding 200 kW are anticipated to experience rapid growth, driven by heavy-duty vehicles and high-speed rail development. Geographically, North America and Europe remain significant markets, with the Asia-Pacific region, particularly China and India, expected to exhibit the fastest growth driven by rapid industrialization and expanding transportation infrastructure. Leading entities such as ABB, Siemens, and Kirloskar Electric are strategically investing in R&D, forging partnerships, and expanding their global reach to capitalize on this burgeoning market.
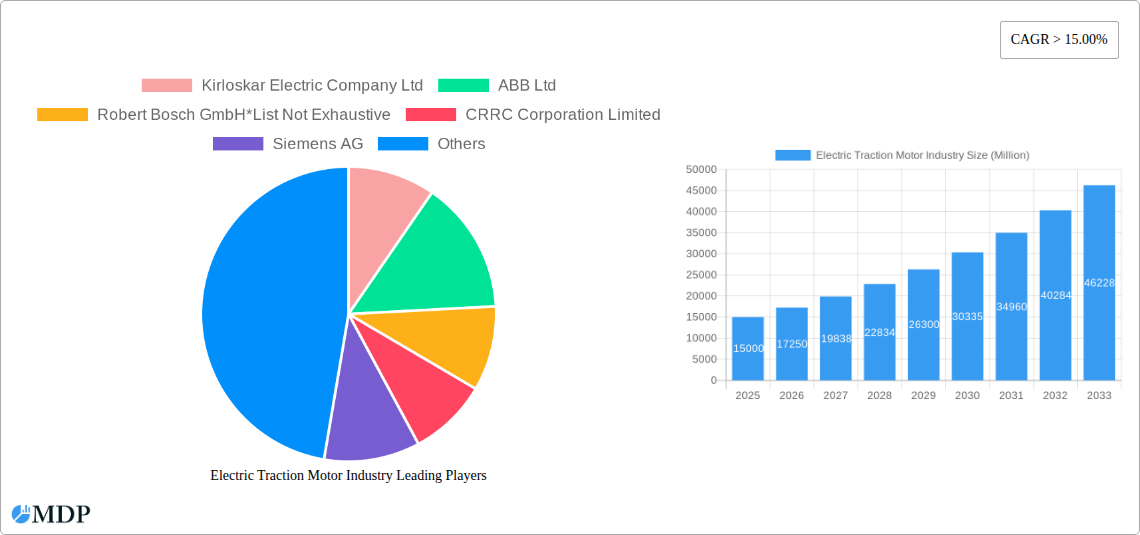
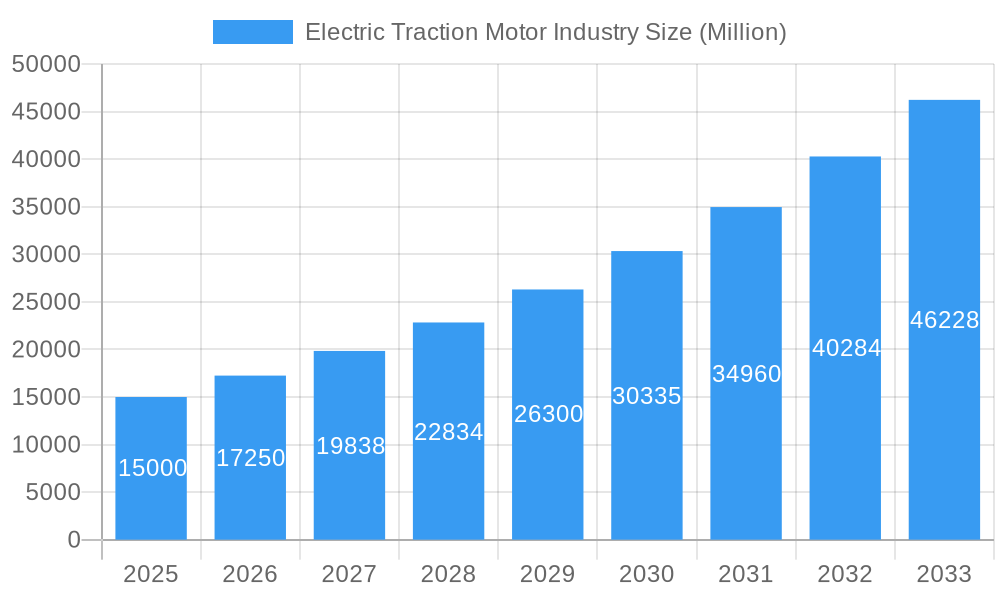
Electric Traction Motor Industry Market Size (In Billion)
The competitive landscape is dynamic, featuring established market leaders and innovative new entrants vying for market share. Industry consolidation through mergers and acquisitions is evident, driven by the pursuit of economies of scale and accelerated technological advancement. Future growth will be shaped by supportive government policies for electric mobility, continuous innovation in motor and battery technology, and the increasing affordability of electric vehicles and rail systems. The ongoing development of advanced materials, enhanced thermal management, and the integration of smart technologies into traction motors will significantly influence the industry's trajectory. The incorporation of digital solutions, including predictive maintenance and remote diagnostics, presents opportunities for optimizing operational efficiency and minimizing user downtime. Addressing critical factors such as battery lifespan, charging infrastructure availability, and the environmental impact of battery production is paramount for the sustained and sustainable growth of the electric traction motor market.
Electric Traction Motor Industry Company Market Share
Electric Traction Motor Industry Market Report: 2019-2033 Forecast
Dive deep into the dynamic Electric Traction Motor industry with this comprehensive market report, providing actionable insights for strategic decision-making. This in-depth analysis covers the period 2019-2033, with a focus on the estimated year 2025 and a forecast spanning 2025-2033. The report leverages data from the historical period (2019-2024) to predict future market trends and opportunities, reaching a projected market value of xx Million by 2033. Key players like Kirloskar Electric Company Ltd, ABB Ltd, Robert Bosch GmbH, CRRC Corporation Limited, Siemens AG, Alstom SA, Traktionssysteme Austria (TSA) GmbH, CG Power and Industrial Solutions Ltd, General Electric Company, and Skoda Transportation AS are analyzed for their market share, strategies, and competitive landscape.
Electric Traction Motor Industry Market Dynamics & Concentration
This section analyzes the competitive landscape of the electric traction motor industry, examining market concentration, innovation drivers, regulatory frameworks, product substitutes, end-user trends, and M&A activities. The industry is characterized by a moderately concentrated market, with several major players holding significant market share. However, the emergence of new technologies and players is increasing competition.
- Market Concentration: The top 5 players hold approximately xx% of the global market share in 2025. This is expected to slightly decrease to xx% by 2033 due to increased competition.
- Innovation Drivers: Advancements in power electronics, permanent magnet technology, and control systems are key innovation drivers, leading to higher efficiency and performance.
- Regulatory Frameworks: Stringent emission regulations across the globe are driving the adoption of electric traction motors in various applications.
- Product Substitutes: While electric traction motors dominate their niche, competition exists from alternative technologies like fuel cells for specific applications.
- End-User Trends: The increasing demand for electric vehicles and high-speed rail is significantly boosting the growth of the electric traction motor market.
- M&A Activities: The past five years have seen xx M&A deals in the industry, primarily focused on expanding technology portfolios and market reach. This trend is projected to continue, with an estimated xx deals expected during the forecast period.
Electric Traction Motor Industry Industry Trends & Analysis
The electric traction motor market is experiencing robust growth, driven by several key factors. The Compound Annual Growth Rate (CAGR) is estimated at xx% during the forecast period (2025-2033). Market penetration in key segments like electric vehicles is expected to increase significantly. Technological advancements such as the development of high-efficiency motors and improved power electronics are driving this expansion. Consumer preferences are shifting towards environmentally friendly and efficient transportation solutions, fueling demand for electric traction motors. Competitive dynamics are shaping the market, with companies investing heavily in R&D and strategic partnerships to maintain their market position. This competitive landscape is further intensified by the entry of new players and disruptive technologies.
Leading Markets & Segments in Electric Traction Motor Industry
The railway segment dominates the electric traction motor market, driven by the global expansion of high-speed rail networks and the increasing electrification of existing railway lines. China and Europe are currently the leading regions for electric traction motor adoption.
Key Drivers:
- Railway: Government investments in railway infrastructure, growing passenger traffic, and the shift towards electric-powered trains.
- Electric Vehicles: Rising demand for electric and hybrid vehicles, driven by environmental concerns and government incentives.
- Industrial Machinery: Increasing automation and electrification in industrial processes are creating new opportunities for electric traction motors.
Dominance Analysis:
- Type: Alternating Current (AC) motors currently hold a larger market share than Direct Current (DC) motors due to their higher efficiency and improved control capabilities. However, the share of DC motors is expected to increase due to technological advancements.
- Power Rating: The segment with power ratings above 400 kW is expected to show the highest growth due to its application in high-speed trains and heavy-duty industrial machinery.
- Application: The railway segment will remain the largest application area throughout the forecast period, followed by the electric vehicle segment.
Electric Traction Motor Industry Product Developments
Recent advancements focus on improving efficiency, reducing size and weight, and enhancing durability. Silicon carbide (SiC) based inverters and high-performance permanent magnets are key technological trends, improving power density and overall system efficiency. These innovations are crucial for meeting stringent regulatory requirements and providing competitive advantages in the market. New applications are emerging in areas such as autonomous vehicles and robotics, driving further product development.
Key Drivers of Electric Traction Motor Industry Growth
The growth of the electric traction motor industry is propelled by several factors: The increasing demand for electric vehicles and hybrid electric vehicles (HEVs) is a major driver, alongside government regulations promoting electrification of transportation and industrial machinery. Technological advancements, such as the development of more efficient and powerful motors, are also playing a crucial role. Finally, expanding global infrastructure projects, particularly in developing countries, create substantial demand.
Challenges in the Electric Traction Motor Industry Market
The industry faces challenges such as the high initial cost of electric traction motors, supply chain disruptions impacting the availability of raw materials, and intense competition among existing and emerging players. Furthermore, the technological complexity and skilled labor requirement for manufacturing and maintenance create hurdles. The fluctuating prices of raw materials also add to the operational challenges faced by companies in the industry.
Emerging Opportunities in Electric Traction Motor Industry
Significant opportunities exist in the development of high-efficiency, high-power density motors for electric aircraft and marine applications. Strategic partnerships and collaborations between motor manufacturers and vehicle or equipment producers will unlock further market expansion. The growing demand for autonomous vehicles and robotics presents a substantial growth catalyst for the electric traction motor industry. Investment in R&D to develop next-generation motors with advanced materials and control systems will be crucial for success.
Leading Players in the Electric Traction Motor Industry Sector
- Kirloskar Electric Company Ltd
- ABB Ltd
- Robert Bosch GmbH
- CRRC Corporation Limited
- Siemens AG
- Alstom SA
- Traktionssysteme Austria (TSA) GmbH
- CG Power and Industrial Solutions Ltd
- General Electric Company
- Skoda Transportation AS
Key Milestones in Electric Traction Motor Industry Industry
- 2020: Launch of a new high-efficiency permanent magnet motor by ABB Ltd.
- 2021: Siemens AG announced a strategic partnership to develop electric motors for autonomous vehicles.
- 2022: Acquisition of a smaller electric motor manufacturer by Robert Bosch GmbH, expanding its market share.
- 2023: Introduction of a new silicon carbide inverter technology by a major player leading to improved efficiency. (Further milestones to be added based on available data)
Strategic Outlook for Electric Traction Motor Industry Market
The electric traction motor market is poised for substantial growth, driven by technological advancements and increasing demand across various sectors. Companies should focus on R&D to develop efficient and cost-effective motors, while strategic partnerships and collaborations will be key to market penetration. Investing in sustainable manufacturing processes and supply chain resilience will be critical for long-term success. Market expansion into emerging economies will be a crucial aspect of achieving sustainable market growth and leadership.
Electric Traction Motor Industry Segmentation
-
1. Type
- 1.1. Alternating Current
- 1.2. Direct Current
-
2. Power Rating
- 2.1. Below 200 kW
- 2.2. 200 - 400 kW
- 2.3. Above 400 kW
-
3. Application
- 3.1. Railway
- 3.2. Electric Vehicle
- 3.3. Industrial Machinery
- 3.4. Others
Electric Traction Motor Industry Segmentation By Geography
- 1. North America
- 2. Asia Pacific
- 3. Europe
- 4. South America
- 5. Middle East and Africa
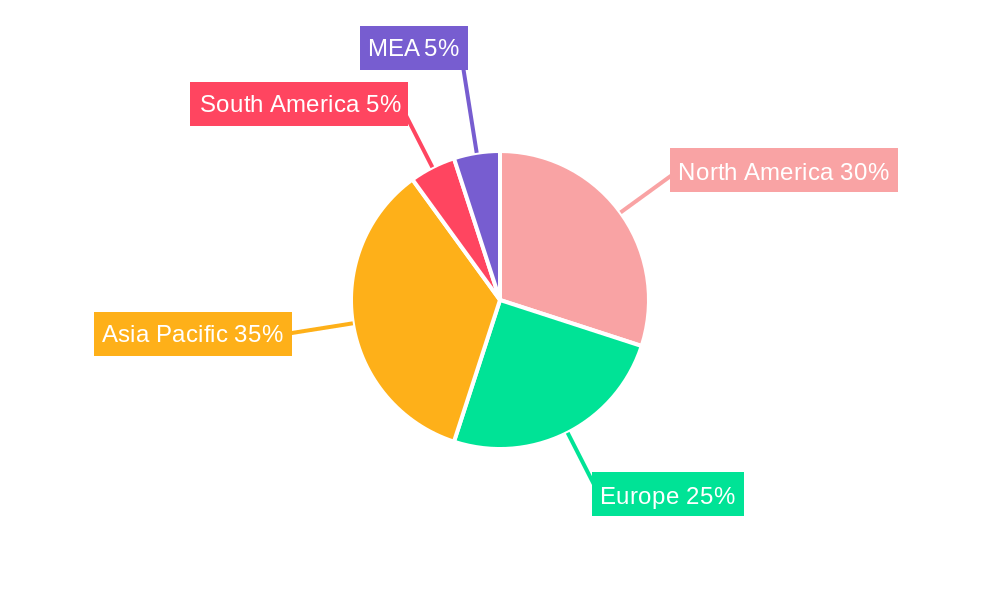
Electric Traction Motor Industry Regional Market Share
Geographic Coverage of Electric Traction Motor Industry
Electric Traction Motor Industry REPORT HIGHLIGHTS
| Aspects | Details |
|---|---|
| Study Period | 2020-2034 |
| Base Year | 2025 |
| Estimated Year | 2026 |
| Forecast Period | 2026-2034 |
| Historical Period | 2020-2025 |
| Growth Rate | CAGR of 8.82% from 2020-2034 |
| Segmentation |
|
Table of Contents
- 1. Introduction
- 1.1. Research Scope
- 1.2. Market Segmentation
- 1.3. Research Methodology
- 1.4. Definitions and Assumptions
- 2. Executive Summary
- 2.1. Introduction
- 3. Market Dynamics
- 3.1. Introduction
- 3.2. Market Drivers
- 3.2.1. 4.; Increasing Integration Of Renewable Energy Generation4.; Aging Power Grids And Investments In Transmission And Distribution Infrastructure
- 3.3. Market Restrains
- 3.3.1. 4.; Lack Of Investor Confidence Due To Sociopolitical Instability In Some Countries
- 3.4. Market Trends
- 3.4.1. Electric Vehicle to Witness Significant Growth
- 4. Market Factor Analysis
- 4.1. Porters Five Forces
- 4.2. Supply/Value Chain
- 4.3. PESTEL analysis
- 4.4. Market Entropy
- 4.5. Patent/Trademark Analysis
- 5. Global Electric Traction Motor Industry Analysis, Insights and Forecast, 2020-2032
- 5.1. Market Analysis, Insights and Forecast - by Type
- 5.1.1. Alternating Current
- 5.1.2. Direct Current
- 5.2. Market Analysis, Insights and Forecast - by Power Rating
- 5.2.1. Below 200 kW
- 5.2.2. 200 - 400 kW
- 5.2.3. Above 400 kW
- 5.3. Market Analysis, Insights and Forecast - by Application
- 5.3.1. Railway
- 5.3.2. Electric Vehicle
- 5.3.3. Industrial Machinery
- 5.3.4. Others
- 5.4. Market Analysis, Insights and Forecast - by Region
- 5.4.1. North America
- 5.4.2. Asia Pacific
- 5.4.3. Europe
- 5.4.4. South America
- 5.4.5. Middle East and Africa
- 5.1. Market Analysis, Insights and Forecast - by Type
- 6. North America Electric Traction Motor Industry Analysis, Insights and Forecast, 2020-2032
- 6.1. Market Analysis, Insights and Forecast - by Type
- 6.1.1. Alternating Current
- 6.1.2. Direct Current
- 6.2. Market Analysis, Insights and Forecast - by Power Rating
- 6.2.1. Below 200 kW
- 6.2.2. 200 - 400 kW
- 6.2.3. Above 400 kW
- 6.3. Market Analysis, Insights and Forecast - by Application
- 6.3.1. Railway
- 6.3.2. Electric Vehicle
- 6.3.3. Industrial Machinery
- 6.3.4. Others
- 6.1. Market Analysis, Insights and Forecast - by Type
- 7. Asia Pacific Electric Traction Motor Industry Analysis, Insights and Forecast, 2020-2032
- 7.1. Market Analysis, Insights and Forecast - by Type
- 7.1.1. Alternating Current
- 7.1.2. Direct Current
- 7.2. Market Analysis, Insights and Forecast - by Power Rating
- 7.2.1. Below 200 kW
- 7.2.2. 200 - 400 kW
- 7.2.3. Above 400 kW
- 7.3. Market Analysis, Insights and Forecast - by Application
- 7.3.1. Railway
- 7.3.2. Electric Vehicle
- 7.3.3. Industrial Machinery
- 7.3.4. Others
- 7.1. Market Analysis, Insights and Forecast - by Type
- 8. Europe Electric Traction Motor Industry Analysis, Insights and Forecast, 2020-2032
- 8.1. Market Analysis, Insights and Forecast - by Type
- 8.1.1. Alternating Current
- 8.1.2. Direct Current
- 8.2. Market Analysis, Insights and Forecast - by Power Rating
- 8.2.1. Below 200 kW
- 8.2.2. 200 - 400 kW
- 8.2.3. Above 400 kW
- 8.3. Market Analysis, Insights and Forecast - by Application
- 8.3.1. Railway
- 8.3.2. Electric Vehicle
- 8.3.3. Industrial Machinery
- 8.3.4. Others
- 8.1. Market Analysis, Insights and Forecast - by Type
- 9. South America Electric Traction Motor Industry Analysis, Insights and Forecast, 2020-2032
- 9.1. Market Analysis, Insights and Forecast - by Type
- 9.1.1. Alternating Current
- 9.1.2. Direct Current
- 9.2. Market Analysis, Insights and Forecast - by Power Rating
- 9.2.1. Below 200 kW
- 9.2.2. 200 - 400 kW
- 9.2.3. Above 400 kW
- 9.3. Market Analysis, Insights and Forecast - by Application
- 9.3.1. Railway
- 9.3.2. Electric Vehicle
- 9.3.3. Industrial Machinery
- 9.3.4. Others
- 9.1. Market Analysis, Insights and Forecast - by Type
- 10. Middle East and Africa Electric Traction Motor Industry Analysis, Insights and Forecast, 2020-2032
- 10.1. Market Analysis, Insights and Forecast - by Type
- 10.1.1. Alternating Current
- 10.1.2. Direct Current
- 10.2. Market Analysis, Insights and Forecast - by Power Rating
- 10.2.1. Below 200 kW
- 10.2.2. 200 - 400 kW
- 10.2.3. Above 400 kW
- 10.3. Market Analysis, Insights and Forecast - by Application
- 10.3.1. Railway
- 10.3.2. Electric Vehicle
- 10.3.3. Industrial Machinery
- 10.3.4. Others
- 10.1. Market Analysis, Insights and Forecast - by Type
- 11. Competitive Analysis
- 11.1. Global Market Share Analysis 2025
- 11.2. Company Profiles
- 11.2.1 Kirloskar Electric Company Ltd
- 11.2.1.1. Overview
- 11.2.1.2. Products
- 11.2.1.3. SWOT Analysis
- 11.2.1.4. Recent Developments
- 11.2.1.5. Financials (Based on Availability)
- 11.2.2 ABB Ltd
- 11.2.2.1. Overview
- 11.2.2.2. Products
- 11.2.2.3. SWOT Analysis
- 11.2.2.4. Recent Developments
- 11.2.2.5. Financials (Based on Availability)
- 11.2.3 Robert Bosch GmbH*List Not Exhaustive
- 11.2.3.1. Overview
- 11.2.3.2. Products
- 11.2.3.3. SWOT Analysis
- 11.2.3.4. Recent Developments
- 11.2.3.5. Financials (Based on Availability)
- 11.2.4 CRRC Corporation Limited
- 11.2.4.1. Overview
- 11.2.4.2. Products
- 11.2.4.3. SWOT Analysis
- 11.2.4.4. Recent Developments
- 11.2.4.5. Financials (Based on Availability)
- 11.2.5 Siemens AG
- 11.2.5.1. Overview
- 11.2.5.2. Products
- 11.2.5.3. SWOT Analysis
- 11.2.5.4. Recent Developments
- 11.2.5.5. Financials (Based on Availability)
- 11.2.6 Alstom SA
- 11.2.6.1. Overview
- 11.2.6.2. Products
- 11.2.6.3. SWOT Analysis
- 11.2.6.4. Recent Developments
- 11.2.6.5. Financials (Based on Availability)
- 11.2.7 Traktionssysteme Austria (TSA) GmbH
- 11.2.7.1. Overview
- 11.2.7.2. Products
- 11.2.7.3. SWOT Analysis
- 11.2.7.4. Recent Developments
- 11.2.7.5. Financials (Based on Availability)
- 11.2.8 CG Power and Industrial Solutions Ltd
- 11.2.8.1. Overview
- 11.2.8.2. Products
- 11.2.8.3. SWOT Analysis
- 11.2.8.4. Recent Developments
- 11.2.8.5. Financials (Based on Availability)
- 11.2.9 General Electric Company
- 11.2.9.1. Overview
- 11.2.9.2. Products
- 11.2.9.3. SWOT Analysis
- 11.2.9.4. Recent Developments
- 11.2.9.5. Financials (Based on Availability)
- 11.2.10 Skoda Transportation AS
- 11.2.10.1. Overview
- 11.2.10.2. Products
- 11.2.10.3. SWOT Analysis
- 11.2.10.4. Recent Developments
- 11.2.10.5. Financials (Based on Availability)
- 11.2.1 Kirloskar Electric Company Ltd
List of Figures
- Figure 1: Global Electric Traction Motor Industry Revenue Breakdown (billion, %) by Region 2025 & 2033
- Figure 2: North America Electric Traction Motor Industry Revenue (billion), by Type 2025 & 2033
- Figure 3: North America Electric Traction Motor Industry Revenue Share (%), by Type 2025 & 2033
- Figure 4: North America Electric Traction Motor Industry Revenue (billion), by Power Rating 2025 & 2033
- Figure 5: North America Electric Traction Motor Industry Revenue Share (%), by Power Rating 2025 & 2033
- Figure 6: North America Electric Traction Motor Industry Revenue (billion), by Application 2025 & 2033
- Figure 7: North America Electric Traction Motor Industry Revenue Share (%), by Application 2025 & 2033
- Figure 8: North America Electric Traction Motor Industry Revenue (billion), by Country 2025 & 2033
- Figure 9: North America Electric Traction Motor Industry Revenue Share (%), by Country 2025 & 2033
- Figure 10: Asia Pacific Electric Traction Motor Industry Revenue (billion), by Type 2025 & 2033
- Figure 11: Asia Pacific Electric Traction Motor Industry Revenue Share (%), by Type 2025 & 2033
- Figure 12: Asia Pacific Electric Traction Motor Industry Revenue (billion), by Power Rating 2025 & 2033
- Figure 13: Asia Pacific Electric Traction Motor Industry Revenue Share (%), by Power Rating 2025 & 2033
- Figure 14: Asia Pacific Electric Traction Motor Industry Revenue (billion), by Application 2025 & 2033
- Figure 15: Asia Pacific Electric Traction Motor Industry Revenue Share (%), by Application 2025 & 2033
- Figure 16: Asia Pacific Electric Traction Motor Industry Revenue (billion), by Country 2025 & 2033
- Figure 17: Asia Pacific Electric Traction Motor Industry Revenue Share (%), by Country 2025 & 2033
- Figure 18: Europe Electric Traction Motor Industry Revenue (billion), by Type 2025 & 2033
- Figure 19: Europe Electric Traction Motor Industry Revenue Share (%), by Type 2025 & 2033
- Figure 20: Europe Electric Traction Motor Industry Revenue (billion), by Power Rating 2025 & 2033
- Figure 21: Europe Electric Traction Motor Industry Revenue Share (%), by Power Rating 2025 & 2033
- Figure 22: Europe Electric Traction Motor Industry Revenue (billion), by Application 2025 & 2033
- Figure 23: Europe Electric Traction Motor Industry Revenue Share (%), by Application 2025 & 2033
- Figure 24: Europe Electric Traction Motor Industry Revenue (billion), by Country 2025 & 2033
- Figure 25: Europe Electric Traction Motor Industry Revenue Share (%), by Country 2025 & 2033
- Figure 26: South America Electric Traction Motor Industry Revenue (billion), by Type 2025 & 2033
- Figure 27: South America Electric Traction Motor Industry Revenue Share (%), by Type 2025 & 2033
- Figure 28: South America Electric Traction Motor Industry Revenue (billion), by Power Rating 2025 & 2033
- Figure 29: South America Electric Traction Motor Industry Revenue Share (%), by Power Rating 2025 & 2033
- Figure 30: South America Electric Traction Motor Industry Revenue (billion), by Application 2025 & 2033
- Figure 31: South America Electric Traction Motor Industry Revenue Share (%), by Application 2025 & 2033
- Figure 32: South America Electric Traction Motor Industry Revenue (billion), by Country 2025 & 2033
- Figure 33: South America Electric Traction Motor Industry Revenue Share (%), by Country 2025 & 2033
- Figure 34: Middle East and Africa Electric Traction Motor Industry Revenue (billion), by Type 2025 & 2033
- Figure 35: Middle East and Africa Electric Traction Motor Industry Revenue Share (%), by Type 2025 & 2033
- Figure 36: Middle East and Africa Electric Traction Motor Industry Revenue (billion), by Power Rating 2025 & 2033
- Figure 37: Middle East and Africa Electric Traction Motor Industry Revenue Share (%), by Power Rating 2025 & 2033
- Figure 38: Middle East and Africa Electric Traction Motor Industry Revenue (billion), by Application 2025 & 2033
- Figure 39: Middle East and Africa Electric Traction Motor Industry Revenue Share (%), by Application 2025 & 2033
- Figure 40: Middle East and Africa Electric Traction Motor Industry Revenue (billion), by Country 2025 & 2033
- Figure 41: Middle East and Africa Electric Traction Motor Industry Revenue Share (%), by Country 2025 & 2033
List of Tables
- Table 1: Global Electric Traction Motor Industry Revenue billion Forecast, by Type 2020 & 2033
- Table 2: Global Electric Traction Motor Industry Revenue billion Forecast, by Power Rating 2020 & 2033
- Table 3: Global Electric Traction Motor Industry Revenue billion Forecast, by Application 2020 & 2033
- Table 4: Global Electric Traction Motor Industry Revenue billion Forecast, by Region 2020 & 2033
- Table 5: Global Electric Traction Motor Industry Revenue billion Forecast, by Type 2020 & 2033
- Table 6: Global Electric Traction Motor Industry Revenue billion Forecast, by Power Rating 2020 & 2033
- Table 7: Global Electric Traction Motor Industry Revenue billion Forecast, by Application 2020 & 2033
- Table 8: Global Electric Traction Motor Industry Revenue billion Forecast, by Country 2020 & 2033
- Table 9: Global Electric Traction Motor Industry Revenue billion Forecast, by Type 2020 & 2033
- Table 10: Global Electric Traction Motor Industry Revenue billion Forecast, by Power Rating 2020 & 2033
- Table 11: Global Electric Traction Motor Industry Revenue billion Forecast, by Application 2020 & 2033
- Table 12: Global Electric Traction Motor Industry Revenue billion Forecast, by Country 2020 & 2033
- Table 13: Global Electric Traction Motor Industry Revenue billion Forecast, by Type 2020 & 2033
- Table 14: Global Electric Traction Motor Industry Revenue billion Forecast, by Power Rating 2020 & 2033
- Table 15: Global Electric Traction Motor Industry Revenue billion Forecast, by Application 2020 & 2033
- Table 16: Global Electric Traction Motor Industry Revenue billion Forecast, by Country 2020 & 2033
- Table 17: Global Electric Traction Motor Industry Revenue billion Forecast, by Type 2020 & 2033
- Table 18: Global Electric Traction Motor Industry Revenue billion Forecast, by Power Rating 2020 & 2033
- Table 19: Global Electric Traction Motor Industry Revenue billion Forecast, by Application 2020 & 2033
- Table 20: Global Electric Traction Motor Industry Revenue billion Forecast, by Country 2020 & 2033
- Table 21: Global Electric Traction Motor Industry Revenue billion Forecast, by Type 2020 & 2033
- Table 22: Global Electric Traction Motor Industry Revenue billion Forecast, by Power Rating 2020 & 2033
- Table 23: Global Electric Traction Motor Industry Revenue billion Forecast, by Application 2020 & 2033
- Table 24: Global Electric Traction Motor Industry Revenue billion Forecast, by Country 2020 & 2033
Frequently Asked Questions
1. What is the projected Compound Annual Growth Rate (CAGR) of the Electric Traction Motor Industry?
The projected CAGR is approximately 8.82%.
2. Which companies are prominent players in the Electric Traction Motor Industry?
Key companies in the market include Kirloskar Electric Company Ltd, ABB Ltd, Robert Bosch GmbH*List Not Exhaustive, CRRC Corporation Limited, Siemens AG, Alstom SA, Traktionssysteme Austria (TSA) GmbH, CG Power and Industrial Solutions Ltd, General Electric Company, Skoda Transportation AS.
3. What are the main segments of the Electric Traction Motor Industry?
The market segments include Type, Power Rating, Application.
4. Can you provide details about the market size?
The market size is estimated to be USD 15.87 billion as of 2022.
5. What are some drivers contributing to market growth?
4.; Increasing Integration Of Renewable Energy Generation4.; Aging Power Grids And Investments In Transmission And Distribution Infrastructure.
6. What are the notable trends driving market growth?
Electric Vehicle to Witness Significant Growth.
7. Are there any restraints impacting market growth?
4.; Lack Of Investor Confidence Due To Sociopolitical Instability In Some Countries.
8. Can you provide examples of recent developments in the market?
N/A
9. What pricing options are available for accessing the report?
Pricing options include single-user, multi-user, and enterprise licenses priced at USD 4750, USD 5250, and USD 8750 respectively.
10. Is the market size provided in terms of value or volume?
The market size is provided in terms of value, measured in billion.
11. Are there any specific market keywords associated with the report?
Yes, the market keyword associated with the report is "Electric Traction Motor Industry," which aids in identifying and referencing the specific market segment covered.
12. How do I determine which pricing option suits my needs best?
The pricing options vary based on user requirements and access needs. Individual users may opt for single-user licenses, while businesses requiring broader access may choose multi-user or enterprise licenses for cost-effective access to the report.
13. Are there any additional resources or data provided in the Electric Traction Motor Industry report?
While the report offers comprehensive insights, it's advisable to review the specific contents or supplementary materials provided to ascertain if additional resources or data are available.
14. How can I stay updated on further developments or reports in the Electric Traction Motor Industry?
To stay informed about further developments, trends, and reports in the Electric Traction Motor Industry, consider subscribing to industry newsletters, following relevant companies and organizations, or regularly checking reputable industry news sources and publications.
Methodology
Step 1 - Identification of Relevant Samples Size from Population Database


Step 2 - Approaches for Defining Global Market Size (Value, Volume* & Price*)

Note*: In applicable scenarios
Step 3 - Data Sources
Primary Research
- Web Analytics
- Survey Reports
- Research Institute
- Latest Research Reports
- Opinion Leaders
Secondary Research
- Annual Reports
- White Paper
- Latest Press Release
- Industry Association
- Paid Database
- Investor Presentations

Step 4 - Data Triangulation
Involves using different sources of information in order to increase the validity of a study
These sources are likely to be stakeholders in a program - participants, other researchers, program staff, other community members, and so on.
Then we put all data in single framework & apply various statistical tools to find out the dynamic on the market.
During the analysis stage, feedback from the stakeholder groups would be compared to determine areas of agreement as well as areas of divergence