

Key Insights
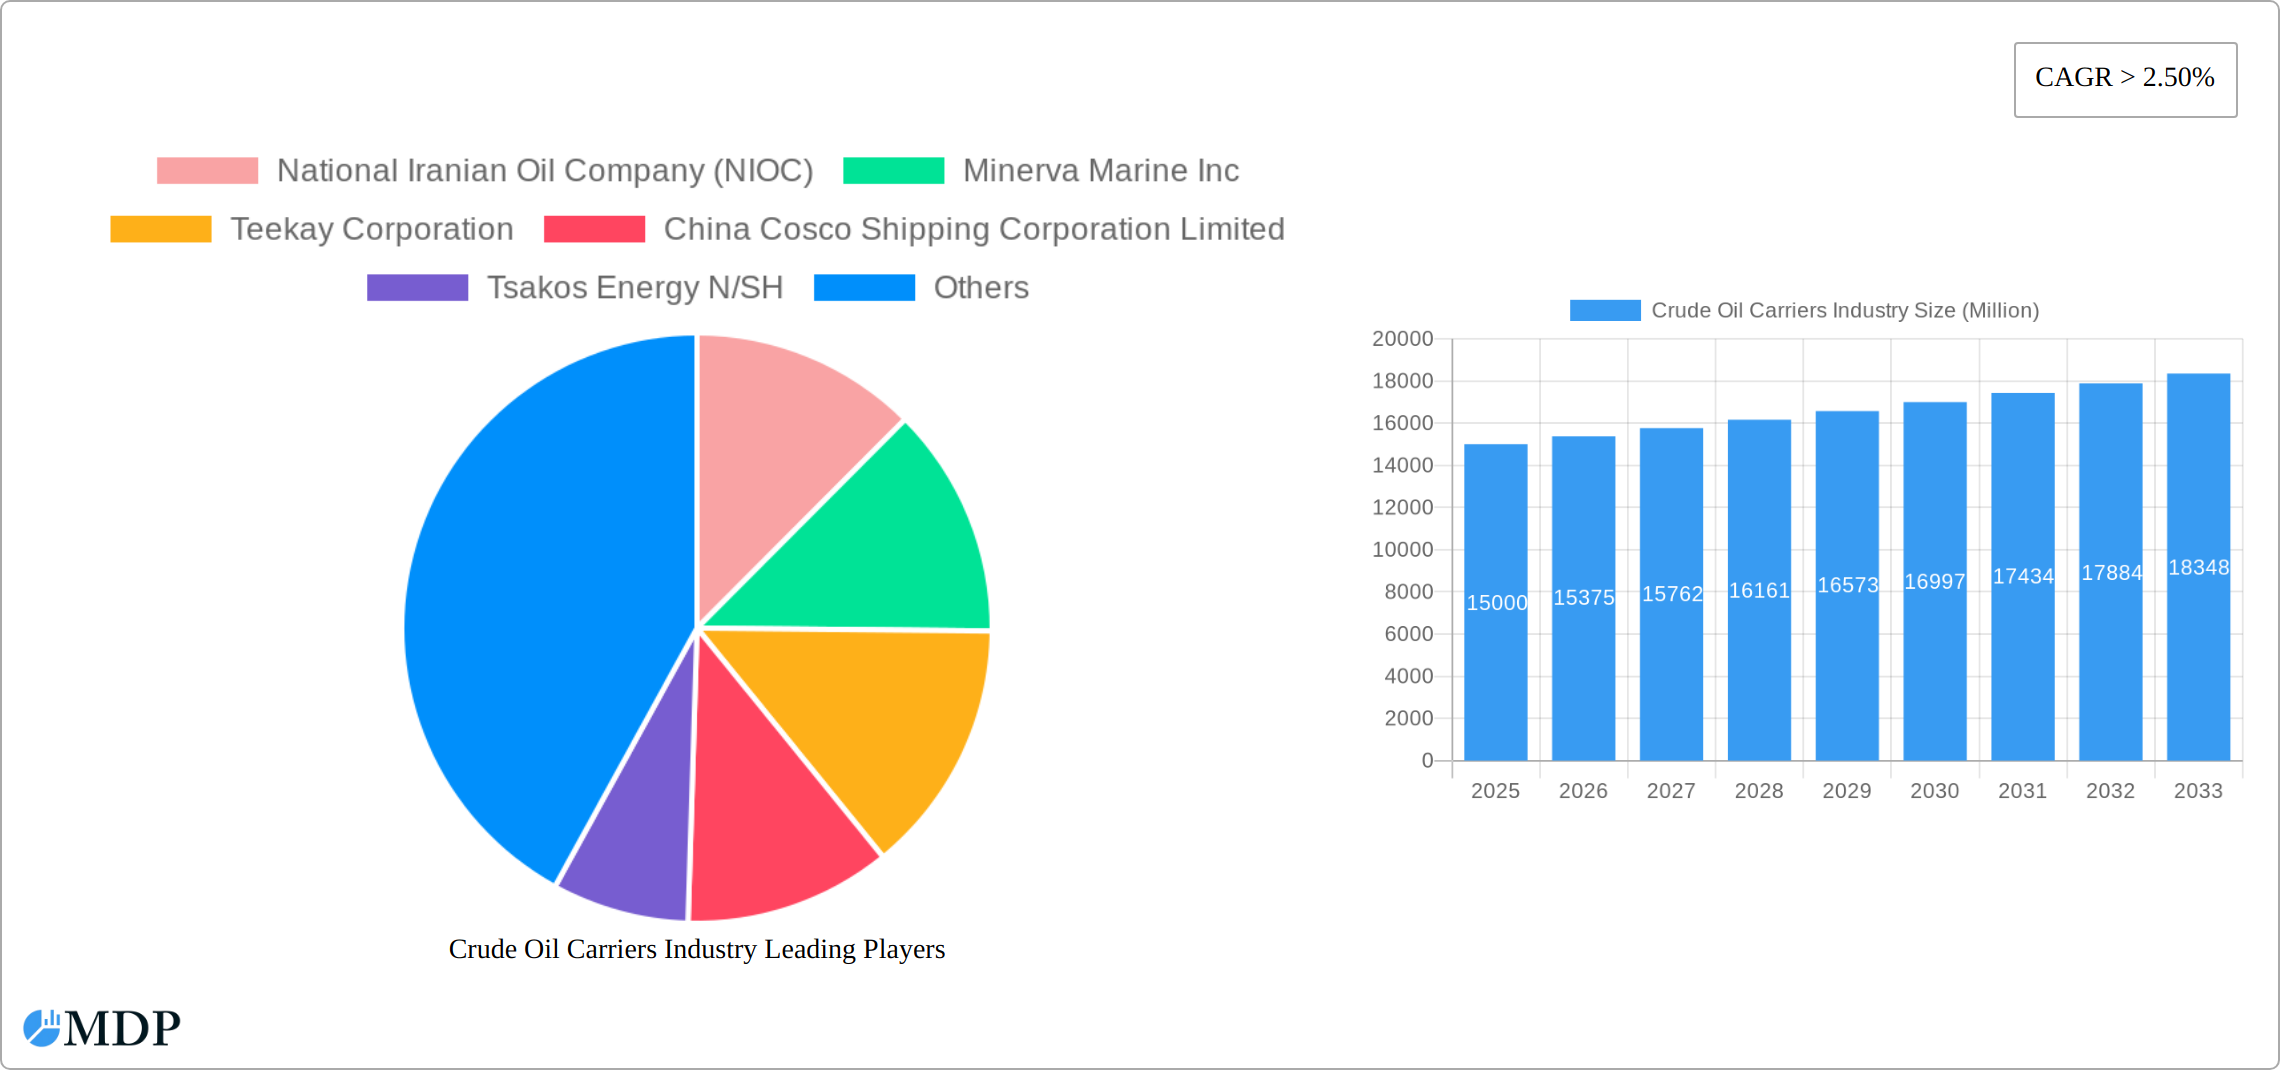
The Crude Oil Carriers market, valued at $225142.8 million in the base year 2025, is projected for significant expansion with a Compound Annual Growth Rate (CAGR) of 4.6% from 2025 to 2033. This growth is driven by escalating global energy demand, particularly in Asia-Pacific, and a shift towards larger, cost-efficient vessels like VLCCs and ULCCs. Investments in fleet modernization and efficiency technologies also support market expansion. Key challenges include geopolitical instability, fluctuating oil prices, and stringent environmental regulations requiring cleaner fuel adoption. The market is segmented by vessel size (Medium Range, Panamax, Aframax, Suezmax, VLCC, ULCC). Leading players such as National Iranian Oil Company (NIOC), Minerva Marine Inc., Teekay Corporation, and China Cosco Shipping Corporation Limited actively compete. Asia-Pacific is a primary growth region due to its increasing energy consumption.
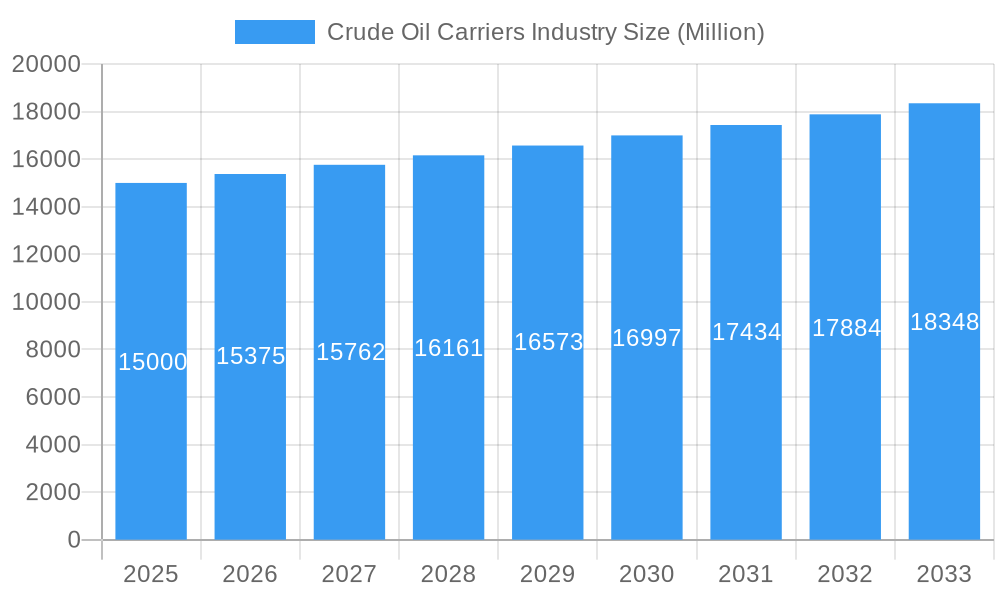
Crude Oil Carriers Industry Market Size (In Billion)
The competitive environment is defined by strategic alliances, fleet expansion, and innovation. Companies prioritize operational efficiency, risk management through advanced analytics, and sustainable, environmentally responsible practices. Future growth depends on navigating geopolitical risks, adapting to regulatory changes, and optimizing operations. Continuous monitoring of global energy trends, technological advancements, and geopolitical stability is essential for accurate forecasting.
Crude Oil Carriers Industry Company Market Share
Crude Oil Carriers Industry: A Comprehensive Market Report (2019-2033)
This comprehensive report provides an in-depth analysis of the Crude Oil Carriers industry, offering invaluable insights for investors, industry professionals, and strategic decision-makers. Covering the period from 2019 to 2033, with a base year of 2025 and a forecast period from 2025 to 2033, this report meticulously examines market dynamics, trends, leading players, and future prospects. The analysis encompasses various crude oil carrier segments, including Medium Range, Panamax, Aframax, Suezmax, Very Large Crude Carriers (VLCCs), and Ultra Large Crude Carriers (ULCCs). Expect detailed breakdowns, quantitative data, and actionable strategic recommendations.
Crude Oil Carriers Industry Market Dynamics & Concentration
This section analyzes the competitive landscape of the crude oil carriers industry, exploring market concentration, innovation drivers, regulatory frameworks, product substitutes, end-user trends, and mergers and acquisitions (M&A) activities.
The global crude oil carrier market is characterized by a moderately concentrated structure, with a few major players holding significant market share. For example, in 2024, the top five players (NIOC, Teekay Corporation, Cosco, Euronav, and PETRONAS) collectively held an estimated xx% market share in terms of vessel capacity. However, the presence of numerous smaller players contributes to competitive intensity.
- Market Concentration: xx% market share held by top 5 players in 2024 (estimated). This is expected to slightly decrease to xx% by 2033 due to increased participation from smaller players.
- Innovation Drivers: Technological advancements like improved vessel design (e.g., fuel efficiency improvements) and digitalization (e.g., fleet management systems) are driving innovation.
- Regulatory Frameworks: IMO 2020 sulfur cap regulations and future decarbonization targets are significantly influencing market dynamics, pushing companies to invest in cleaner technologies.
- Product Substitutes: While there are no direct substitutes for crude oil tankers, the efficiency of pipelines and other transportation methods could potentially impact market growth.
- End-User Trends: Demand fluctuations linked to global economic growth and shifts in energy consumption patterns (e.g., increasing renewable energy adoption) influence demand for crude oil carriers.
- M&A Activities: The industry witnessed xx M&A deals between 2019 and 2024, primarily driven by consolidation efforts and attempts to achieve economies of scale. A projected xx deals are expected between 2025-2033.
Crude Oil Carriers Industry Trends & Analysis
This section delves into the key trends shaping the crude oil carriers industry, including market growth drivers, technological disruptions, consumer preferences, and competitive dynamics.
Global demand for crude oil transportation is expected to fluctuate in the forecast period, influenced by global economic growth, geopolitical events, and energy transition policies. The industry is experiencing moderate growth, with a projected Compound Annual Growth Rate (CAGR) of xx% from 2025 to 2033. Market penetration of technologically advanced vessels, including those with enhanced fuel efficiency and emissions reduction technologies, is increasing steadily. The market is witnessing increased competition, particularly among larger players, prompting strategic alliances, and technological advancements. The shift towards environmentally friendly operations is driving significant investment in alternative fuels and technologies to meet stringent regulatory requirements. The increased volatility in oil prices also plays a significant role in the financial health of the industry, impacting investment decisions.
Leading Markets & Segments in Crude Oil Carriers Industry
This section identifies the dominant regions, countries, and vessel segments within the crude oil carriers market.
Dominant Segment: VLCCs (Very Large Crude Carriers) and ULCCs (Ultra Large Crude Carriers) are expected to remain the dominant segments throughout the forecast period, driven by the economies of scale they offer in transporting large volumes of crude oil.
- VLCC/ULCC segment dominance drivers:
- Economies of scale: Lower transportation costs per barrel due to high cargo capacity.
- Infrastructure suitability: Major ports are well-equipped to handle these large vessels.
- Demand for large-scale transportation: Efficient for transporting large crude oil volumes across long distances.
Other segments, such as Aframax, Suezmax, and Panamax, will maintain their market presence, albeit with comparatively lower growth rates, catering to specific regional and trade route needs. The Medium Range segment serves niche markets and shorter-haul routes.
Crude Oil Carriers Industry Product Developments
Recent product innovations in the crude oil carrier industry revolve around enhancing operational efficiency and environmental sustainability. This includes investments in fuel-efficient vessel designs, optimizing hull forms and propulsion systems, as well as implementing advanced digital technologies for fleet management and predictive maintenance. The incorporation of scrubbers to comply with stricter emission standards is also a prominent feature, along with exploration of alternative fuels. These developments contribute to cost reductions and a smaller environmental footprint, thereby improving competitive advantages in a rapidly changing regulatory landscape.
Key Drivers of Crude Oil Carriers Industry Growth
The crude oil carriers industry's growth is intricately linked to global energy demand, despite the increasing adoption of renewable energy sources. While the transition to cleaner energy is underway, the world remains heavily reliant on crude oil, particularly in developing economies experiencing rapid industrialization and population growth. This sustained global economic expansion, especially in emerging markets, continues to be a primary driver of crude oil consumption and, consequently, the demand for transportation via crude oil carriers. Beyond this fundamental demand, technological advancements play a crucial role. Innovations in vessel design, such as improved hull efficiency and the implementation of energy-saving devices, contribute to reduced fuel consumption and operational costs, enhancing the industry's profitability and sustainability. Furthermore, stricter environmental regulations, while presenting challenges, also stimulate investment in cleaner technologies and more efficient shipping practices, ultimately fostering growth. Favorable regulatory policies that encourage efficient and sustainable practices are also key catalysts for industry expansion and attract further investment.
Challenges in the Crude Oil Carriers Industry Market
The industry faces various challenges, including fluctuations in oil prices, impacting profitability and investment decisions. Furthermore, geopolitical instability and trade tensions can disrupt shipping routes and increase operating costs. Stringent environmental regulations and the transition to cleaner fuels present both an opportunity and a challenge, requiring significant capital expenditure to meet compliance standards. Lastly, intense competition among carriers necessitates continuous optimization of operational efficiency and strategic partnerships to remain competitive.
Emerging Opportunities in Crude Oil Carriers Industry
The crude oil carriers industry is poised for substantial growth fueled by several key emerging opportunities. Technological advancements are at the forefront, with the development and adoption of alternative fuels (such as LNG and biofuels) presenting significant potential for reducing emissions and improving environmental performance. Automation and digitalization are also transforming operations, increasing efficiency and reducing operational costs. Strategic partnerships and collaborations are crucial for driving innovation and accelerating the adoption of sustainable practices. Companies are forging alliances to share resources, expertise, and technology, creating competitive advantages and fostering a more collaborative industry ecosystem. Expansion into new and underserved markets, particularly in regions with burgeoning energy demands, offers considerable growth potential. Diversification of services, such as providing specialized services for the transportation of refined products or offering integrated logistics solutions, can further enhance revenue streams and create new market opportunities for established players.
Leading Players in the Crude Oil Carriers Industry Sector
- National Iranian Oil Company (NIOC)
- Minerva Marine Inc
- Teekay Corporation
- China Cosco Shipping Corporation Limited
- Tsakos Energy N/SH
- China Merchants Group Ltd
- Euronav NV
- Petroliam Nasional Berhad (PETRONAS)
- The National Shipping Co Saudi Arabia
- Angelicoussis Shipping Group Ltd
Key Milestones in Crude Oil Carriers Industry Industry
- 2019: IMO 2020 sulfur cap regulations implemented, impacting fuel choices and investments in scrubbers.
- 2020: COVID-19 pandemic significantly impacted global trade and shipping, leading to reduced demand.
- 2021: Recovery in oil demand started, but with volatility influenced by ongoing global uncertainties.
- 2022: Significant increase in crude oil prices impacted market dynamics and vessel charter rates.
- 2023: Continued focus on decarbonization and sustainable shipping practices by major players.
- 2024: Ongoing consolidation through M&A activities and strategic alliances.
Strategic Outlook for Crude Oil Carriers Industry Market
The future of the crude oil carriers industry is marked by the need for adaptation to a changing energy landscape and tightening environmental regulations. Growth will depend on the ability of companies to implement sustainable practices, adopt innovative technologies, and effectively manage operational costs amidst fluctuating oil prices and geopolitical factors. Long-term growth potential exists for those companies capable of leveraging strategic partnerships, expanding into emerging markets, and successfully navigating the transition towards a more sustainable shipping sector.
Crude Oil Carriers Industry Segmentation
-
1. Size
- 1.1. Medium Range
- 1.2. Panaxax
- 1.3. Aframax
- 1.4. Suezmax
- 1.5. Very Lar
Crude Oil Carriers Industry Segmentation By Geography
- 1. North America
- 2. Europe
- 3. Asia Pacific
- 4. South America
- 5. Middle East
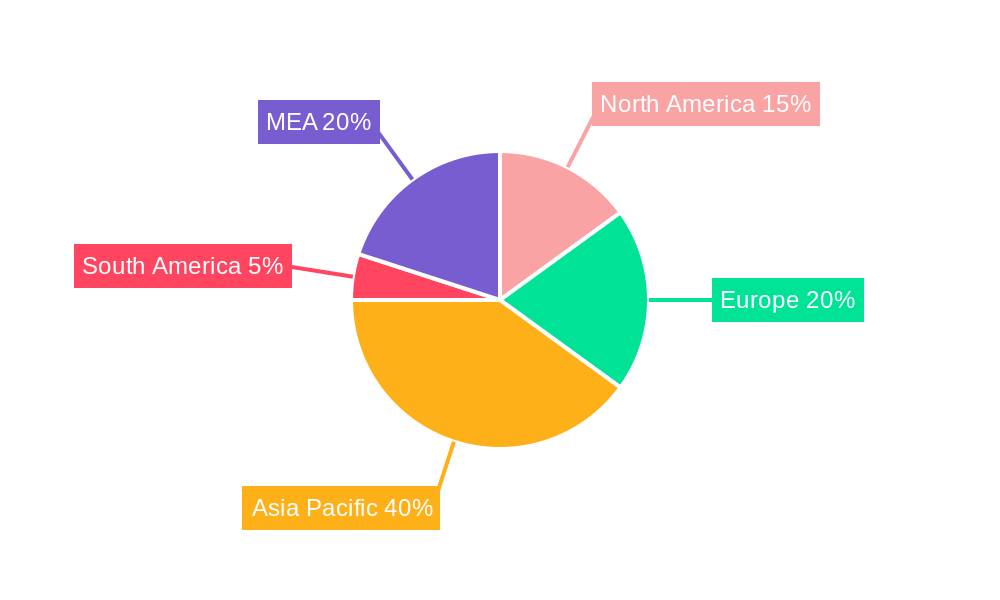
Crude Oil Carriers Industry Regional Market Share
Geographic Coverage of Crude Oil Carriers Industry
Crude Oil Carriers Industry REPORT HIGHLIGHTS
| Aspects | Details |
|---|---|
| Study Period | 2020-2034 |
| Base Year | 2025 |
| Estimated Year | 2026 |
| Forecast Period | 2026-2034 |
| Historical Period | 2020-2025 |
| Growth Rate | CAGR of 4.6% from 2020-2034 |
| Segmentation |
|
Table of Contents
- 1. Introduction
- 1.1. Research Scope
- 1.2. Market Segmentation
- 1.3. Research Objective
- 1.4. Definitions and Assumptions
- 2. Executive Summary
- 2.1. Market Snapshot
- 3. Market Dynamics
- 3.1. Market Drivers
- 3.2. Market Restrains
- 3.3. Market Trends
- 3.4. Market Opportunities
- 4. Market Factor Analysis
- 4.1. Porters Five Forces
- 4.1.1. Bargaining Power of Suppliers
- 4.1.2. Bargaining Power of Buyers
- 4.1.3. Threat of New Entrants
- 4.1.4. Threat of Substitutes
- 4.1.5. Competitive Rivalry
- 4.2. PESTEL analysis
- 4.3. BCG Analysis
- 4.3.1. Stars (High Growth, High Market Share)
- 4.3.2. Cash Cows (Low Growth, High Market Share)
- 4.3.3. Question Mark (High Growth, Low Market Share)
- 4.3.4. Dogs (Low Growth, Low Market Share)
- 4.4. Ansoff Matrix Analysis
- 4.5. Supply Chain Analysis
- 4.6. Regulatory Landscape
- 4.7. Current Market Potential and Opportunity Assessment (TAM–SAM–SOM Framework)
- 4.8. MDP Analyst Note
- 4.1. Porters Five Forces
- 5. Market Analysis, Insights and Forecast 2021-2033
- 5.1. Market Analysis, Insights and Forecast - by Size
- 5.1.1. Medium Range
- 5.1.2. Panaxax
- 5.1.3. Aframax
- 5.1.4. Suezmax
- 5.1.5. Very Lar
- 5.2. Market Analysis, Insights and Forecast - by Region
- 5.2.1. North America
- 5.2.2. Europe
- 5.2.3. Asia Pacific
- 5.2.4. South America
- 5.2.5. Middle East
- 5.1. Market Analysis, Insights and Forecast - by Size
- 6. Global Crude Oil Carriers Industry Analysis, Insights and Forecast, 2021-2033
- 6.1. Market Analysis, Insights and Forecast - by Size
- 6.1.1. Medium Range
- 6.1.2. Panaxax
- 6.1.3. Aframax
- 6.1.4. Suezmax
- 6.1.5. Very Lar
- 6.1. Market Analysis, Insights and Forecast - by Size
- 7. North America Crude Oil Carriers Industry Analysis, Insights and Forecast, 2020-2032
- 7.1. Market Analysis, Insights and Forecast - by Size
- 7.1.1. Medium Range
- 7.1.2. Panaxax
- 7.1.3. Aframax
- 7.1.4. Suezmax
- 7.1.5. Very Lar
- 7.1. Market Analysis, Insights and Forecast - by Size
- 8. Europe Crude Oil Carriers Industry Analysis, Insights and Forecast, 2020-2032
- 8.1. Market Analysis, Insights and Forecast - by Size
- 8.1.1. Medium Range
- 8.1.2. Panaxax
- 8.1.3. Aframax
- 8.1.4. Suezmax
- 8.1.5. Very Lar
- 8.1. Market Analysis, Insights and Forecast - by Size
- 9. Asia Pacific Crude Oil Carriers Industry Analysis, Insights and Forecast, 2020-2032
- 9.1. Market Analysis, Insights and Forecast - by Size
- 9.1.1. Medium Range
- 9.1.2. Panaxax
- 9.1.3. Aframax
- 9.1.4. Suezmax
- 9.1.5. Very Lar
- 9.1. Market Analysis, Insights and Forecast - by Size
- 10. South America Crude Oil Carriers Industry Analysis, Insights and Forecast, 2020-2032
- 10.1. Market Analysis, Insights and Forecast - by Size
- 10.1.1. Medium Range
- 10.1.2. Panaxax
- 10.1.3. Aframax
- 10.1.4. Suezmax
- 10.1.5. Very Lar
- 10.1. Market Analysis, Insights and Forecast - by Size
- 11. Middle East Crude Oil Carriers Industry Analysis, Insights and Forecast, 2020-2032
- 11.1. Market Analysis, Insights and Forecast - by Size
- 11.1.1. Medium Range
- 11.1.2. Panaxax
- 11.1.3. Aframax
- 11.1.4. Suezmax
- 11.1.5. Very Lar
- 11.1. Market Analysis, Insights and Forecast - by Size
- 12. Competitive Analysis
- 12.1. Company Profiles
- 12.1.1 National Iranian Oil Company (NIOC)
- 12.1.1.1. Company Overview
- 12.1.1.2. Products
- 12.1.1.3. Company Financials
- 12.1.1.4. SWOT Analysis
- 12.1.2 Minerva Marine Inc
- 12.1.2.1. Company Overview
- 12.1.2.2. Products
- 12.1.2.3. Company Financials
- 12.1.2.4. SWOT Analysis
- 12.1.3 Teekay Corporation
- 12.1.3.1. Company Overview
- 12.1.3.2. Products
- 12.1.3.3. Company Financials
- 12.1.3.4. SWOT Analysis
- 12.1.4 China Cosco Shipping Corporation Limited
- 12.1.4.1. Company Overview
- 12.1.4.2. Products
- 12.1.4.3. Company Financials
- 12.1.4.4. SWOT Analysis
- 12.1.5 Tsakos Energy N/SH
- 12.1.5.1. Company Overview
- 12.1.5.2. Products
- 12.1.5.3. Company Financials
- 12.1.5.4. SWOT Analysis
- 12.1.6 China Merchants Group Ltd
- 12.1.6.1. Company Overview
- 12.1.6.2. Products
- 12.1.6.3. Company Financials
- 12.1.6.4. SWOT Analysis
- 12.1.7 Euronav NV
- 12.1.7.1. Company Overview
- 12.1.7.2. Products
- 12.1.7.3. Company Financials
- 12.1.7.4. SWOT Analysis
- 12.1.8 Petroliam Nasional Berhad (PETRONAS)*List Not Exhaustive
- 12.1.8.1. Company Overview
- 12.1.8.2. Products
- 12.1.8.3. Company Financials
- 12.1.8.4. SWOT Analysis
- 12.1.9 The National Shipping Co Saudi Arabia
- 12.1.9.1. Company Overview
- 12.1.9.2. Products
- 12.1.9.3. Company Financials
- 12.1.9.4. SWOT Analysis
- 12.1.10 Angelicoussis Shipping Group Ltd
- 12.1.10.1. Company Overview
- 12.1.10.2. Products
- 12.1.10.3. Company Financials
- 12.1.10.4. SWOT Analysis
- 12.1.1 National Iranian Oil Company (NIOC)
- 12.2. Market Entropy
- 12.2.1 Company's Key Areas Served
- 12.2.2 Recent Developments
- 12.3. Company Market Share Analysis 2025
- 12.3.1 Top 5 Companies Market Share Analysis
- 12.3.2 Top 3 Companies Market Share Analysis
- 12.4. List of Potential Customers
- 13. Research Methodology
List of Figures
- Figure 1: Global Crude Oil Carriers Industry Revenue Breakdown (million, %) by Region 2025 & 2033
- Figure 2: Global Crude Oil Carriers Industry Volume Breakdown (metric tonnes, %) by Region 2025 & 2033
- Figure 3: North America Crude Oil Carriers Industry Revenue (million), by Size 2025 & 2033
- Figure 4: North America Crude Oil Carriers Industry Volume (metric tonnes), by Size 2025 & 2033
- Figure 5: North America Crude Oil Carriers Industry Revenue Share (%), by Size 2025 & 2033
- Figure 6: North America Crude Oil Carriers Industry Volume Share (%), by Size 2025 & 2033
- Figure 7: North America Crude Oil Carriers Industry Revenue (million), by Country 2025 & 2033
- Figure 8: North America Crude Oil Carriers Industry Volume (metric tonnes), by Country 2025 & 2033
- Figure 9: North America Crude Oil Carriers Industry Revenue Share (%), by Country 2025 & 2033
- Figure 10: North America Crude Oil Carriers Industry Volume Share (%), by Country 2025 & 2033
- Figure 11: Europe Crude Oil Carriers Industry Revenue (million), by Size 2025 & 2033
- Figure 12: Europe Crude Oil Carriers Industry Volume (metric tonnes), by Size 2025 & 2033
- Figure 13: Europe Crude Oil Carriers Industry Revenue Share (%), by Size 2025 & 2033
- Figure 14: Europe Crude Oil Carriers Industry Volume Share (%), by Size 2025 & 2033
- Figure 15: Europe Crude Oil Carriers Industry Revenue (million), by Country 2025 & 2033
- Figure 16: Europe Crude Oil Carriers Industry Volume (metric tonnes), by Country 2025 & 2033
- Figure 17: Europe Crude Oil Carriers Industry Revenue Share (%), by Country 2025 & 2033
- Figure 18: Europe Crude Oil Carriers Industry Volume Share (%), by Country 2025 & 2033
- Figure 19: Asia Pacific Crude Oil Carriers Industry Revenue (million), by Size 2025 & 2033
- Figure 20: Asia Pacific Crude Oil Carriers Industry Volume (metric tonnes), by Size 2025 & 2033
- Figure 21: Asia Pacific Crude Oil Carriers Industry Revenue Share (%), by Size 2025 & 2033
- Figure 22: Asia Pacific Crude Oil Carriers Industry Volume Share (%), by Size 2025 & 2033
- Figure 23: Asia Pacific Crude Oil Carriers Industry Revenue (million), by Country 2025 & 2033
- Figure 24: Asia Pacific Crude Oil Carriers Industry Volume (metric tonnes), by Country 2025 & 2033
- Figure 25: Asia Pacific Crude Oil Carriers Industry Revenue Share (%), by Country 2025 & 2033
- Figure 26: Asia Pacific Crude Oil Carriers Industry Volume Share (%), by Country 2025 & 2033
- Figure 27: South America Crude Oil Carriers Industry Revenue (million), by Size 2025 & 2033
- Figure 28: South America Crude Oil Carriers Industry Volume (metric tonnes), by Size 2025 & 2033
- Figure 29: South America Crude Oil Carriers Industry Revenue Share (%), by Size 2025 & 2033
- Figure 30: South America Crude Oil Carriers Industry Volume Share (%), by Size 2025 & 2033
- Figure 31: South America Crude Oil Carriers Industry Revenue (million), by Country 2025 & 2033
- Figure 32: South America Crude Oil Carriers Industry Volume (metric tonnes), by Country 2025 & 2033
- Figure 33: South America Crude Oil Carriers Industry Revenue Share (%), by Country 2025 & 2033
- Figure 34: South America Crude Oil Carriers Industry Volume Share (%), by Country 2025 & 2033
- Figure 35: Middle East Crude Oil Carriers Industry Revenue (million), by Size 2025 & 2033
- Figure 36: Middle East Crude Oil Carriers Industry Volume (metric tonnes), by Size 2025 & 2033
- Figure 37: Middle East Crude Oil Carriers Industry Revenue Share (%), by Size 2025 & 2033
- Figure 38: Middle East Crude Oil Carriers Industry Volume Share (%), by Size 2025 & 2033
- Figure 39: Middle East Crude Oil Carriers Industry Revenue (million), by Country 2025 & 2033
- Figure 40: Middle East Crude Oil Carriers Industry Volume (metric tonnes), by Country 2025 & 2033
- Figure 41: Middle East Crude Oil Carriers Industry Revenue Share (%), by Country 2025 & 2033
- Figure 42: Middle East Crude Oil Carriers Industry Volume Share (%), by Country 2025 & 2033
List of Tables
- Table 1: Global Crude Oil Carriers Industry Revenue million Forecast, by Size 2020 & 2033
- Table 2: Global Crude Oil Carriers Industry Volume metric tonnes Forecast, by Size 2020 & 2033
- Table 3: Global Crude Oil Carriers Industry Revenue million Forecast, by Region 2020 & 2033
- Table 4: Global Crude Oil Carriers Industry Volume metric tonnes Forecast, by Region 2020 & 2033
- Table 5: Global Crude Oil Carriers Industry Revenue million Forecast, by Size 2020 & 2033
- Table 6: Global Crude Oil Carriers Industry Volume metric tonnes Forecast, by Size 2020 & 2033
- Table 7: Global Crude Oil Carriers Industry Revenue million Forecast, by Country 2020 & 2033
- Table 8: Global Crude Oil Carriers Industry Volume metric tonnes Forecast, by Country 2020 & 2033
- Table 9: Global Crude Oil Carriers Industry Revenue million Forecast, by Size 2020 & 2033
- Table 10: Global Crude Oil Carriers Industry Volume metric tonnes Forecast, by Size 2020 & 2033
- Table 11: Global Crude Oil Carriers Industry Revenue million Forecast, by Country 2020 & 2033
- Table 12: Global Crude Oil Carriers Industry Volume metric tonnes Forecast, by Country 2020 & 2033
- Table 13: Global Crude Oil Carriers Industry Revenue million Forecast, by Size 2020 & 2033
- Table 14: Global Crude Oil Carriers Industry Volume metric tonnes Forecast, by Size 2020 & 2033
- Table 15: Global Crude Oil Carriers Industry Revenue million Forecast, by Country 2020 & 2033
- Table 16: Global Crude Oil Carriers Industry Volume metric tonnes Forecast, by Country 2020 & 2033
- Table 17: Global Crude Oil Carriers Industry Revenue million Forecast, by Size 2020 & 2033
- Table 18: Global Crude Oil Carriers Industry Volume metric tonnes Forecast, by Size 2020 & 2033
- Table 19: Global Crude Oil Carriers Industry Revenue million Forecast, by Country 2020 & 2033
- Table 20: Global Crude Oil Carriers Industry Volume metric tonnes Forecast, by Country 2020 & 2033
- Table 21: Global Crude Oil Carriers Industry Revenue million Forecast, by Size 2020 & 2033
- Table 22: Global Crude Oil Carriers Industry Volume metric tonnes Forecast, by Size 2020 & 2033
- Table 23: Global Crude Oil Carriers Industry Revenue million Forecast, by Country 2020 & 2033
- Table 24: Global Crude Oil Carriers Industry Volume metric tonnes Forecast, by Country 2020 & 2033
Frequently Asked Questions
1. What is the projected Compound Annual Growth Rate (CAGR) of the Crude Oil Carriers Industry?
The projected CAGR is approximately 4.6%.
2. Which companies are prominent players in the Crude Oil Carriers Industry?
Key companies in the market include National Iranian Oil Company (NIOC), Minerva Marine Inc, Teekay Corporation, China Cosco Shipping Corporation Limited, Tsakos Energy N/SH, China Merchants Group Ltd, Euronav NV, Petroliam Nasional Berhad (PETRONAS)*List Not Exhaustive, The National Shipping Co Saudi Arabia, Angelicoussis Shipping Group Ltd.
3. What are the main segments of the Crude Oil Carriers Industry?
The market segments include Size.
4. Can you provide details about the market size?
The market size is estimated to be USD 225142.8 million as of 2022.
5. What are some drivers contributing to market growth?
Increasing Electricity Demand; Rising Investments in the Coal Industry.
6. What are the notable trends driving market growth?
Very Large Crude Carrier to Dominate the Market.
7. Are there any restraints impacting market growth?
Increasing Installation of Renewable Energy Sources.
8. Can you provide examples of recent developments in the market?
N/A
9. What pricing options are available for accessing the report?
Pricing options include single-user, multi-user, and enterprise licenses priced at USD 4750, USD 5250, and USD 8750 respectively.
10. Is the market size provided in terms of value or volume?
The market size is provided in terms of value, measured in million and volume, measured in metric tonnes.
11. Are there any specific market keywords associated with the report?
Yes, the market keyword associated with the report is "Crude Oil Carriers Industry," which aids in identifying and referencing the specific market segment covered.
12. How do I determine which pricing option suits my needs best?
The pricing options vary based on user requirements and access needs. Individual users may opt for single-user licenses, while businesses requiring broader access may choose multi-user or enterprise licenses for cost-effective access to the report.
13. Are there any additional resources or data provided in the Crude Oil Carriers Industry report?
While the report offers comprehensive insights, it's advisable to review the specific contents or supplementary materials provided to ascertain if additional resources or data are available.
14. How can I stay updated on further developments or reports in the Crude Oil Carriers Industry?
To stay informed about further developments, trends, and reports in the Crude Oil Carriers Industry, consider subscribing to industry newsletters, following relevant companies and organizations, or regularly checking reputable industry news sources and publications.
Methodology
Step 1 - Identification of Relevant Samples Size from Population Database


Step 2 - Approaches for Defining Global Market Size (Value, Volume* & Price*)

Note*: In applicable scenarios
Step 3 - Data Sources
Primary Research
- Web Analytics
- Survey Reports
- Research Institute
- Latest Research Reports
- Opinion Leaders
Secondary Research
- Annual Reports
- White Paper
- Latest Press Release
- Industry Association
- Paid Database
- Investor Presentations

Step 4 - Data Triangulation
Involves using different sources of information in order to increase the validity of a study
These sources are likely to be stakeholders in a program - participants, other researchers, program staff, other community members, and so on.
Then we put all data in single framework & apply various statistical tools to find out the dynamic on the market.
During the analysis stage, feedback from the stakeholder groups would be compared to determine areas of agreement as well as areas of divergence