

Key Insights
The global cooling tower rental market is projected for substantial expansion, evidenced by a Compound Annual Growth Rate (CAGR) of 6.2%. This robust growth is attributed to escalating demand across various industrial and commercial sectors. Key drivers include the expansion of construction and industrial activities, necessitating temporary cooling solutions during project phases and peak operations. Furthermore, a growing preference for rental options over outright equipment purchase, driven by a desire to minimize upfront capital expenditure and embrace sustainable practices, is fueling market momentum. This trend is particularly pronounced in regions experiencing variable climates and seasonal cooling requirements, where rental services offer unparalleled flexibility and cost-efficiency. Additionally, the increasing emphasis on energy efficiency is prompting industries to adopt modern, energy-efficient rental cooling towers, promoting the integration of hybrid and advanced cooling technologies within the rental segment. The market is characterized by a strong presence of both wet and dry cooling tower rentals, serving a broad spectrum of industrial and commercial applications.
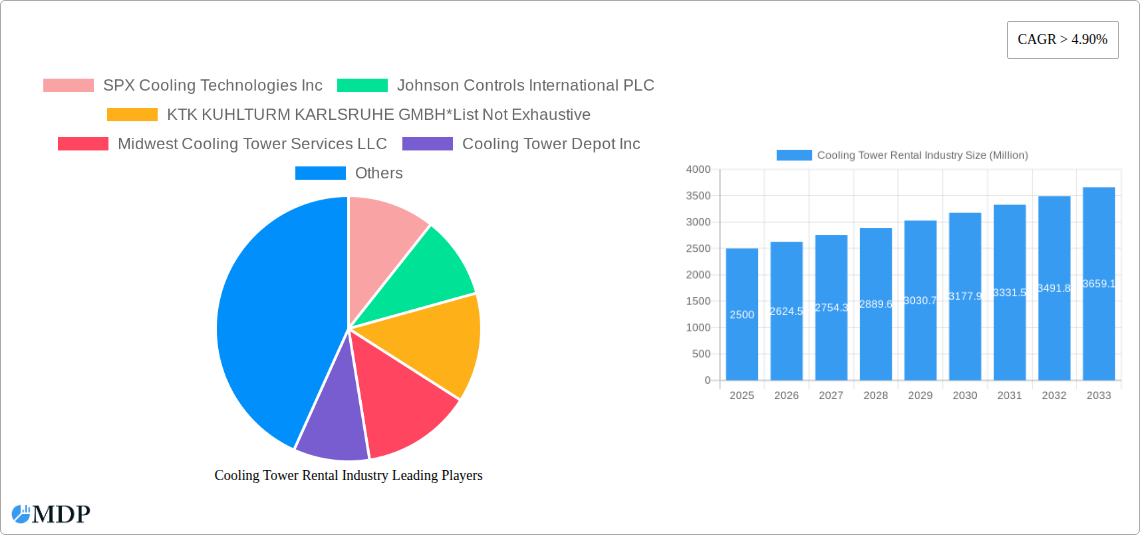
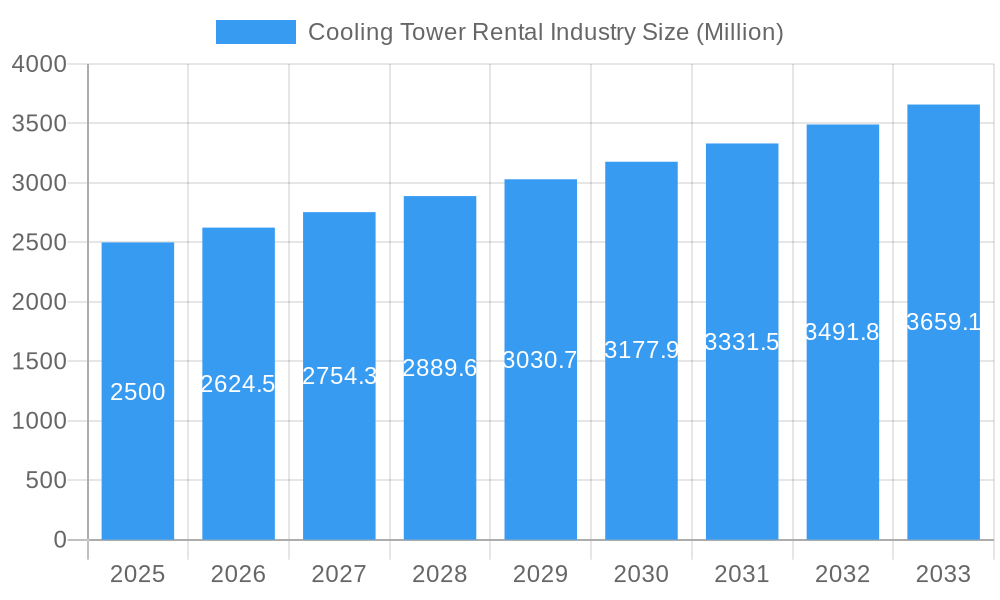
Cooling Tower Rental Industry Market Size (In Billion)
Geographically, North America and Europe currently dominate the cooling tower rental market, supported by mature industrial bases and ongoing infrastructure development. The Asia-Pacific region is anticipated to experience significant growth in the forecast period, driven by rapid industrialization and urbanization, particularly in economies like China and India. The competitive environment is diverse, featuring established industry leaders such as SPX Cooling Technologies Inc, Johnson Controls International PLC, and Baltimore Aircoil Co, alongside a multitude of regional and specialized rental providers. Projections indicate a positive future growth trajectory for the market, bolstered by sustained infrastructure investments and a heightened focus on sustainability. Continuous advancements in cooling tower technology are expected to enhance efficiency and mitigate environmental impact. The inherent flexibility and scalability of the rental model are key contributors to its sustained success within the broader cooling solutions landscape. The market size is estimated to reach 1.39 billion by 2025.
Cooling Tower Rental Industry Company Market Share
Cooling Tower Rental Industry: A Comprehensive Market Report (2019-2033)
This in-depth report provides a comprehensive analysis of the Cooling Tower Rental Industry, offering invaluable insights for stakeholders seeking to navigate this dynamic market. With a focus on market dynamics, leading players, and future trends, this report covers the period from 2019 to 2033, utilizing 2025 as the base and estimated year. The report projects a market valued at $XX Million in 2025, poised for significant growth during the forecast period (2025-2033).
Cooling Tower Rental Industry Market Dynamics & Concentration
This section analyzes the competitive landscape, innovation drivers, regulatory influences, and market trends within the cooling tower rental sector. The market is characterized by a moderate level of concentration, with several key players holding significant market share. However, the presence of numerous smaller, regional players contributes to a dynamic and competitive environment.
- Market Concentration: The top 5 players account for approximately XX% of the global market share in 2025. This signifies a moderately consolidated market with opportunities for both expansion and consolidation.
- Innovation Drivers: Advancements in cooling tower technology, including energy-efficient designs and smart monitoring systems, are driving market growth. The increasing focus on sustainability and reducing environmental impact is further fueling innovation.
- Regulatory Frameworks: Environmental regulations related to water usage and emissions are shaping the market. Compliance requirements drive demand for more efficient and environmentally friendly cooling tower rental solutions.
- Product Substitutes: While limited, alternative cooling technologies such as air cooling systems compete for market share, particularly in niche applications.
- End-User Trends: Growing demand from industrial sectors, particularly in manufacturing and energy production, is a key driver of market growth. The commercial sector also contributes significantly, with demand driven by large-scale HVAC systems.
- M&A Activities: The number of mergers and acquisitions in the industry averaged XX deals annually during the historical period (2019-2024). This suggests a consolidation trend among industry players aiming to expand their market presence and service capabilities.
Cooling Tower Rental Industry Industry Trends & Analysis
The cooling tower rental market is experiencing robust growth, driven by several key factors. The Compound Annual Growth Rate (CAGR) is estimated to be XX% during the forecast period (2025-2033). This growth is attributed to several factors, including increasing industrialization, stringent environmental regulations, and growing adoption of energy-efficient cooling technologies.
Market penetration of rental cooling towers is increasing steadily, particularly in regions experiencing rapid industrial expansion and urbanization. Technological disruptions, such as the adoption of IoT-enabled monitoring systems and advanced control technologies, are enhancing efficiency and improving operational performance. Shifting consumer preferences toward sustainable and environmentally responsible solutions are influencing demand for energy-efficient models. Intense competition among major players is further driving innovation and price optimization, making cooling tower rental solutions more accessible.
Leading Markets & Segments in Cooling Tower Rental Industry
The industrial sector dominates the cooling tower rental market, accounting for approximately XX% of the total market value in 2025. This is followed by the commercial sector. Geographically, [Dominant Region, e.g., North America] holds the largest market share, driven by a strong industrial base and supportive economic policies.
- Key Drivers for [Dominant Region]:
- Robust industrial infrastructure.
- Favorable government regulations and incentives.
- High concentration of manufacturing and energy production facilities.
Segment Analysis:
- Wet Cooling Towers: This segment holds the largest market share due to their cost-effectiveness and wide applicability.
- Dry Cooling Towers: This segment is experiencing moderate growth due to the increasing demand for water-saving solutions in water-stressed regions.
- Hybrid Cooling Towers: This segment is witnessing increasing adoption due to its advantages of offering energy efficiency and water conservation features.
Detailed analysis of individual country and segment market dynamics is provided within the full report.
Cooling Tower Rental Industry Product Developments
Recent product innovations focus on enhancing efficiency, reducing environmental impact, and improving ease of use. Developments include advanced control systems, improved heat transfer designs, and IoT integration for remote monitoring and predictive maintenance. These advancements provide significant competitive advantages by reducing operational costs, extending equipment lifespan, and optimizing performance. The market fit of these innovations aligns perfectly with the growing demand for sustainable and efficient cooling solutions.
Key Drivers of Cooling Tower Rental Industry Growth
Several factors are driving the growth of the cooling tower rental market. Strong industrial growth, particularly in emerging economies, creates a substantial demand for cooling solutions. Stringent environmental regulations promoting water conservation and reduced emissions incentivize the adoption of efficient rental models. Furthermore, technological advancements such as improved energy efficiency and remote monitoring capabilities enhance the attractiveness of rental services.
Challenges in the Cooling Tower Rental Industry Market
The industry faces several challenges including:
- Supply chain disruptions: These can lead to increased costs and delays in project completion.
- Intense competition: This necessitates continuous innovation and competitive pricing strategies.
- Fluctuating raw material prices: These can impact profitability and require flexible pricing models.
- Regulatory compliance: Adherence to environmental regulations demands continuous investment in upgrades and maintenance.
Emerging Opportunities in Cooling Tower Rental Industry
The Cooling Tower Rental Industry presents significant growth opportunities. Expansion into new geographic markets, particularly in developing economies with growing industrial sectors, presents a significant potential for market expansion. Strategic partnerships with industrial manufacturers and energy providers can also provide opportunities to offer integrated cooling solutions. Furthermore, technological innovations such as AI-powered predictive maintenance and autonomous control systems can open up new avenues for increased efficiency and service offerings.
Leading Players in the Cooling Tower Rental Industry Sector
- SPX Cooling Technologies Inc
- Johnson Controls International PLC
- KTK KUHLTURM KARLSRUHE GMBH
- Midwest Cooling Tower Services LLC
- Cooling Tower Depot Inc
- Caterpillar Inc
- Aggreko PLC
- Baltimore Aircoil Co
- Carrier Rental Systems Inc
- United Rentals Inc
Key Milestones in Cooling Tower Rental Industry Industry
- 2020: COVID-19 pandemic significantly impacted the market due to reduced industrial activity and refinery shutdowns.
- 2021-2024: Gradual market recovery with increased focus on energy efficiency and sustainability.
- [Insert Year]: Launch of a new energy-efficient cooling tower model by [Company Name].
- [Insert Year]: Acquisition of [Company A] by [Company B], leading to market consolidation.
- [Insert Year]: Introduction of IoT-enabled monitoring system by [Company Name].
Strategic Outlook for Cooling Tower Rental Industry Market
The Cooling Tower Rental Industry is poised for sustained growth, driven by ongoing industrial expansion, increasing emphasis on sustainability, and continuous technological advancements. Strategic opportunities lie in developing innovative products and services, fostering strategic partnerships, and expanding into new geographical markets. The focus on energy efficiency and optimized operational performance will continue to shape the market, creating a favorable outlook for industry players who can adapt and innovate.
Cooling Tower Rental Industry Segmentation
-
1. Type
- 1.1. Wet
- 1.2. Dry
- 1.3. Hybrid
-
2. End User
- 2.1. Commercial
- 2.2. Industrial
Cooling Tower Rental Industry Segmentation By Geography
- 1. North America
- 2. Europe
- 3. Asia Pacific
- 4. Middle East and Africa
- 5. South America
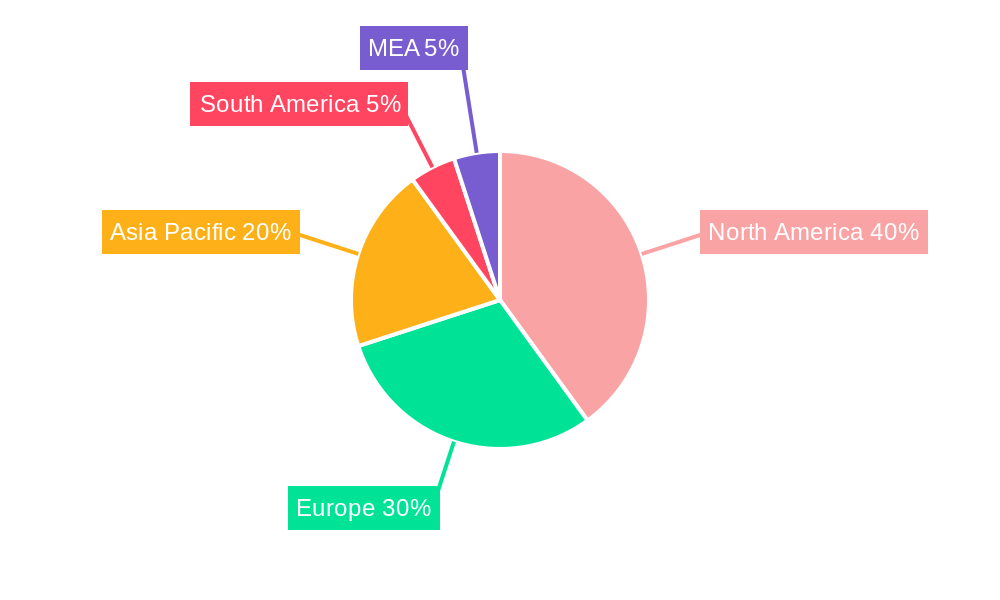
Cooling Tower Rental Industry Regional Market Share
Geographic Coverage of Cooling Tower Rental Industry
Cooling Tower Rental Industry REPORT HIGHLIGHTS
| Aspects | Details |
|---|---|
| Study Period | 2020-2034 |
| Base Year | 2025 |
| Estimated Year | 2026 |
| Forecast Period | 2026-2034 |
| Historical Period | 2020-2025 |
| Growth Rate | CAGR of 6.2% from 2020-2034 |
| Segmentation |
|
Table of Contents
- 1. Introduction
- 1.1. Research Scope
- 1.2. Market Segmentation
- 1.3. Research Objective
- 1.4. Definitions and Assumptions
- 2. Executive Summary
- 2.1. Market Snapshot
- 3. Market Dynamics
- 3.1. Market Drivers
- 3.2. Market Restrains
- 3.3. Market Trends
- 3.4. Market Opportunities
- 4. Market Factor Analysis
- 4.1. Porters Five Forces
- 4.1.1. Bargaining Power of Suppliers
- 4.1.2. Bargaining Power of Buyers
- 4.1.3. Threat of New Entrants
- 4.1.4. Threat of Substitutes
- 4.1.5. Competitive Rivalry
- 4.2. PESTEL analysis
- 4.3. BCG Analysis
- 4.3.1. Stars (High Growth, High Market Share)
- 4.3.2. Cash Cows (Low Growth, High Market Share)
- 4.3.3. Question Mark (High Growth, Low Market Share)
- 4.3.4. Dogs (Low Growth, Low Market Share)
- 4.4. Ansoff Matrix Analysis
- 4.5. Supply Chain Analysis
- 4.6. Regulatory Landscape
- 4.7. Current Market Potential and Opportunity Assessment (TAM–SAM–SOM Framework)
- 4.8. MDP Analyst Note
- 4.1. Porters Five Forces
- 5. Market Analysis, Insights and Forecast 2021-2033
- 5.1. Market Analysis, Insights and Forecast - by Type
- 5.1.1. Wet
- 5.1.2. Dry
- 5.1.3. Hybrid
- 5.2. Market Analysis, Insights and Forecast - by End User
- 5.2.1. Commercial
- 5.2.2. Industrial
- 5.3. Market Analysis, Insights and Forecast - by Region
- 5.3.1. North America
- 5.3.2. Europe
- 5.3.3. Asia Pacific
- 5.3.4. Middle East and Africa
- 5.3.5. South America
- 5.1. Market Analysis, Insights and Forecast - by Type
- 6. Global Cooling Tower Rental Industry Analysis, Insights and Forecast, 2021-2033
- 6.1. Market Analysis, Insights and Forecast - by Type
- 6.1.1. Wet
- 6.1.2. Dry
- 6.1.3. Hybrid
- 6.2. Market Analysis, Insights and Forecast - by End User
- 6.2.1. Commercial
- 6.2.2. Industrial
- 6.1. Market Analysis, Insights and Forecast - by Type
- 7. North America Cooling Tower Rental Industry Analysis, Insights and Forecast, 2020-2032
- 7.1. Market Analysis, Insights and Forecast - by Type
- 7.1.1. Wet
- 7.1.2. Dry
- 7.1.3. Hybrid
- 7.2. Market Analysis, Insights and Forecast - by End User
- 7.2.1. Commercial
- 7.2.2. Industrial
- 7.1. Market Analysis, Insights and Forecast - by Type
- 8. Europe Cooling Tower Rental Industry Analysis, Insights and Forecast, 2020-2032
- 8.1. Market Analysis, Insights and Forecast - by Type
- 8.1.1. Wet
- 8.1.2. Dry
- 8.1.3. Hybrid
- 8.2. Market Analysis, Insights and Forecast - by End User
- 8.2.1. Commercial
- 8.2.2. Industrial
- 8.1. Market Analysis, Insights and Forecast - by Type
- 9. Asia Pacific Cooling Tower Rental Industry Analysis, Insights and Forecast, 2020-2032
- 9.1. Market Analysis, Insights and Forecast - by Type
- 9.1.1. Wet
- 9.1.2. Dry
- 9.1.3. Hybrid
- 9.2. Market Analysis, Insights and Forecast - by End User
- 9.2.1. Commercial
- 9.2.2. Industrial
- 9.1. Market Analysis, Insights and Forecast - by Type
- 10. Middle East and Africa Cooling Tower Rental Industry Analysis, Insights and Forecast, 2020-2032
- 10.1. Market Analysis, Insights and Forecast - by Type
- 10.1.1. Wet
- 10.1.2. Dry
- 10.1.3. Hybrid
- 10.2. Market Analysis, Insights and Forecast - by End User
- 10.2.1. Commercial
- 10.2.2. Industrial
- 10.1. Market Analysis, Insights and Forecast - by Type
- 11. South America Cooling Tower Rental Industry Analysis, Insights and Forecast, 2020-2032
- 11.1. Market Analysis, Insights and Forecast - by Type
- 11.1.1. Wet
- 11.1.2. Dry
- 11.1.3. Hybrid
- 11.2. Market Analysis, Insights and Forecast - by End User
- 11.2.1. Commercial
- 11.2.2. Industrial
- 11.1. Market Analysis, Insights and Forecast - by Type
- 12. Competitive Analysis
- 12.1. Company Profiles
- 12.1.1 SPX Cooling Technologies Inc
- 12.1.1.1. Company Overview
- 12.1.1.2. Products
- 12.1.1.3. Company Financials
- 12.1.1.4. SWOT Analysis
- 12.1.2 Johnson Controls International PLC
- 12.1.2.1. Company Overview
- 12.1.2.2. Products
- 12.1.2.3. Company Financials
- 12.1.2.4. SWOT Analysis
- 12.1.3 KTK KUHLTURM KARLSRUHE GMBH*List Not Exhaustive
- 12.1.3.1. Company Overview
- 12.1.3.2. Products
- 12.1.3.3. Company Financials
- 12.1.3.4. SWOT Analysis
- 12.1.4 Midwest Cooling Tower Services LLC
- 12.1.4.1. Company Overview
- 12.1.4.2. Products
- 12.1.4.3. Company Financials
- 12.1.4.4. SWOT Analysis
- 12.1.5 Cooling Tower Depot Inc
- 12.1.5.1. Company Overview
- 12.1.5.2. Products
- 12.1.5.3. Company Financials
- 12.1.5.4. SWOT Analysis
- 12.1.6 Caterpillar Inc
- 12.1.6.1. Company Overview
- 12.1.6.2. Products
- 12.1.6.3. Company Financials
- 12.1.6.4. SWOT Analysis
- 12.1.7 Aggreko PLC
- 12.1.7.1. Company Overview
- 12.1.7.2. Products
- 12.1.7.3. Company Financials
- 12.1.7.4. SWOT Analysis
- 12.1.8 Baltimore Aircoil Co
- 12.1.8.1. Company Overview
- 12.1.8.2. Products
- 12.1.8.3. Company Financials
- 12.1.8.4. SWOT Analysis
- 12.1.9 Carrier Rental Systems Inc
- 12.1.9.1. Company Overview
- 12.1.9.2. Products
- 12.1.9.3. Company Financials
- 12.1.9.4. SWOT Analysis
- 12.1.10 United Rentals Inc
- 12.1.10.1. Company Overview
- 12.1.10.2. Products
- 12.1.10.3. Company Financials
- 12.1.10.4. SWOT Analysis
- 12.1.1 SPX Cooling Technologies Inc
- 12.2. Market Entropy
- 12.2.1 Company's Key Areas Served
- 12.2.2 Recent Developments
- 12.3. Company Market Share Analysis 2025
- 12.3.1 Top 5 Companies Market Share Analysis
- 12.3.2 Top 3 Companies Market Share Analysis
- 12.4. List of Potential Customers
- 13. Research Methodology
List of Figures
- Figure 1: Global Cooling Tower Rental Industry Revenue Breakdown (billion, %) by Region 2025 & 2033
- Figure 2: North America Cooling Tower Rental Industry Revenue (billion), by Type 2025 & 2033
- Figure 3: North America Cooling Tower Rental Industry Revenue Share (%), by Type 2025 & 2033
- Figure 4: North America Cooling Tower Rental Industry Revenue (billion), by End User 2025 & 2033
- Figure 5: North America Cooling Tower Rental Industry Revenue Share (%), by End User 2025 & 2033
- Figure 6: North America Cooling Tower Rental Industry Revenue (billion), by Country 2025 & 2033
- Figure 7: North America Cooling Tower Rental Industry Revenue Share (%), by Country 2025 & 2033
- Figure 8: Europe Cooling Tower Rental Industry Revenue (billion), by Type 2025 & 2033
- Figure 9: Europe Cooling Tower Rental Industry Revenue Share (%), by Type 2025 & 2033
- Figure 10: Europe Cooling Tower Rental Industry Revenue (billion), by End User 2025 & 2033
- Figure 11: Europe Cooling Tower Rental Industry Revenue Share (%), by End User 2025 & 2033
- Figure 12: Europe Cooling Tower Rental Industry Revenue (billion), by Country 2025 & 2033
- Figure 13: Europe Cooling Tower Rental Industry Revenue Share (%), by Country 2025 & 2033
- Figure 14: Asia Pacific Cooling Tower Rental Industry Revenue (billion), by Type 2025 & 2033
- Figure 15: Asia Pacific Cooling Tower Rental Industry Revenue Share (%), by Type 2025 & 2033
- Figure 16: Asia Pacific Cooling Tower Rental Industry Revenue (billion), by End User 2025 & 2033
- Figure 17: Asia Pacific Cooling Tower Rental Industry Revenue Share (%), by End User 2025 & 2033
- Figure 18: Asia Pacific Cooling Tower Rental Industry Revenue (billion), by Country 2025 & 2033
- Figure 19: Asia Pacific Cooling Tower Rental Industry Revenue Share (%), by Country 2025 & 2033
- Figure 20: Middle East and Africa Cooling Tower Rental Industry Revenue (billion), by Type 2025 & 2033
- Figure 21: Middle East and Africa Cooling Tower Rental Industry Revenue Share (%), by Type 2025 & 2033
- Figure 22: Middle East and Africa Cooling Tower Rental Industry Revenue (billion), by End User 2025 & 2033
- Figure 23: Middle East and Africa Cooling Tower Rental Industry Revenue Share (%), by End User 2025 & 2033
- Figure 24: Middle East and Africa Cooling Tower Rental Industry Revenue (billion), by Country 2025 & 2033
- Figure 25: Middle East and Africa Cooling Tower Rental Industry Revenue Share (%), by Country 2025 & 2033
- Figure 26: South America Cooling Tower Rental Industry Revenue (billion), by Type 2025 & 2033
- Figure 27: South America Cooling Tower Rental Industry Revenue Share (%), by Type 2025 & 2033
- Figure 28: South America Cooling Tower Rental Industry Revenue (billion), by End User 2025 & 2033
- Figure 29: South America Cooling Tower Rental Industry Revenue Share (%), by End User 2025 & 2033
- Figure 30: South America Cooling Tower Rental Industry Revenue (billion), by Country 2025 & 2033
- Figure 31: South America Cooling Tower Rental Industry Revenue Share (%), by Country 2025 & 2033
List of Tables
- Table 1: Global Cooling Tower Rental Industry Revenue billion Forecast, by Type 2020 & 2033
- Table 2: Global Cooling Tower Rental Industry Revenue billion Forecast, by End User 2020 & 2033
- Table 3: Global Cooling Tower Rental Industry Revenue billion Forecast, by Region 2020 & 2033
- Table 4: Global Cooling Tower Rental Industry Revenue billion Forecast, by Type 2020 & 2033
- Table 5: Global Cooling Tower Rental Industry Revenue billion Forecast, by End User 2020 & 2033
- Table 6: Global Cooling Tower Rental Industry Revenue billion Forecast, by Country 2020 & 2033
- Table 7: Global Cooling Tower Rental Industry Revenue billion Forecast, by Type 2020 & 2033
- Table 8: Global Cooling Tower Rental Industry Revenue billion Forecast, by End User 2020 & 2033
- Table 9: Global Cooling Tower Rental Industry Revenue billion Forecast, by Country 2020 & 2033
- Table 10: Global Cooling Tower Rental Industry Revenue billion Forecast, by Type 2020 & 2033
- Table 11: Global Cooling Tower Rental Industry Revenue billion Forecast, by End User 2020 & 2033
- Table 12: Global Cooling Tower Rental Industry Revenue billion Forecast, by Country 2020 & 2033
- Table 13: Global Cooling Tower Rental Industry Revenue billion Forecast, by Type 2020 & 2033
- Table 14: Global Cooling Tower Rental Industry Revenue billion Forecast, by End User 2020 & 2033
- Table 15: Global Cooling Tower Rental Industry Revenue billion Forecast, by Country 2020 & 2033
- Table 16: Global Cooling Tower Rental Industry Revenue billion Forecast, by Type 2020 & 2033
- Table 17: Global Cooling Tower Rental Industry Revenue billion Forecast, by End User 2020 & 2033
- Table 18: Global Cooling Tower Rental Industry Revenue billion Forecast, by Country 2020 & 2033
Frequently Asked Questions
1. What is the projected Compound Annual Growth Rate (CAGR) of the Cooling Tower Rental Industry?
The projected CAGR is approximately 6.2%.
2. Which companies are prominent players in the Cooling Tower Rental Industry?
Key companies in the market include SPX Cooling Technologies Inc, Johnson Controls International PLC, KTK KUHLTURM KARLSRUHE GMBH*List Not Exhaustive, Midwest Cooling Tower Services LLC, Cooling Tower Depot Inc, Caterpillar Inc, Aggreko PLC, Baltimore Aircoil Co, Carrier Rental Systems Inc, United Rentals Inc.
3. What are the main segments of the Cooling Tower Rental Industry?
The market segments include Type, End User.
4. Can you provide details about the market size?
The market size is estimated to be USD 1.39 billion as of 2022.
5. What are some drivers contributing to market growth?
4.; Favorable Government Policies.
6. What are the notable trends driving market growth?
Industrial Segment to Dominate the Market.
7. Are there any restraints impacting market growth?
4.; Rising Emphasis on Other Alternative Clean Energy Sources.
8. Can you provide examples of recent developments in the market?
Restrictions and impacts related to COVID-19 significantly reduced activities like air travel and commuting. This reduced the demand for fuels for transportation, and the shutdown restrictions on refineries affected the downstream sector in 2020. Since cooling towers play a major role in refinery operations, the shutdowns and reduced production rates affected the market for cooling tower rental.
9. What pricing options are available for accessing the report?
Pricing options include single-user, multi-user, and enterprise licenses priced at USD 4750, USD 5250, and USD 8750 respectively.
10. Is the market size provided in terms of value or volume?
The market size is provided in terms of value, measured in billion.
11. Are there any specific market keywords associated with the report?
Yes, the market keyword associated with the report is "Cooling Tower Rental Industry," which aids in identifying and referencing the specific market segment covered.
12. How do I determine which pricing option suits my needs best?
The pricing options vary based on user requirements and access needs. Individual users may opt for single-user licenses, while businesses requiring broader access may choose multi-user or enterprise licenses for cost-effective access to the report.
13. Are there any additional resources or data provided in the Cooling Tower Rental Industry report?
While the report offers comprehensive insights, it's advisable to review the specific contents or supplementary materials provided to ascertain if additional resources or data are available.
14. How can I stay updated on further developments or reports in the Cooling Tower Rental Industry?
To stay informed about further developments, trends, and reports in the Cooling Tower Rental Industry, consider subscribing to industry newsletters, following relevant companies and organizations, or regularly checking reputable industry news sources and publications.
Methodology
Step 1 - Identification of Relevant Samples Size from Population Database


Step 2 - Approaches for Defining Global Market Size (Value, Volume* & Price*)

Note*: In applicable scenarios
Step 3 - Data Sources
Primary Research
- Web Analytics
- Survey Reports
- Research Institute
- Latest Research Reports
- Opinion Leaders
Secondary Research
- Annual Reports
- White Paper
- Latest Press Release
- Industry Association
- Paid Database
- Investor Presentations

Step 4 - Data Triangulation
Involves using different sources of information in order to increase the validity of a study
These sources are likely to be stakeholders in a program - participants, other researchers, program staff, other community members, and so on.
Then we put all data in single framework & apply various statistical tools to find out the dynamic on the market.
During the analysis stage, feedback from the stakeholder groups would be compared to determine areas of agreement as well as areas of divergence