

Key Insights
The global centrifugal pumps market is poised for significant expansion, driven by escalating demand across diverse industrial sectors. With a projected market size of $33.7 billion in the base year 2025, the market is anticipated to grow at a robust Compound Annual Growth Rate (CAGR) of 5.1% through 2033. Key growth catalysts include the indispensable role of centrifugal pumps in the oil and gas industry for efficient fluid management, coupled with the burgeoning power generation sector and ongoing global infrastructure development. Technological innovations in impeller designs (open, semi-open, and enclosed) and multi-stage pump technologies are further enhancing operational efficiency and performance, thereby attracting substantial investment. The market is segmented by pump stage (single-stage and multi-stage) and end-user industries (oil & gas, power generation, and others), offering granular insights into specific growth drivers. Geographically, North America, Europe, and Asia-Pacific are dominant regions, with China, the United States, and major European economies serving as critical hubs for both production and consumption.
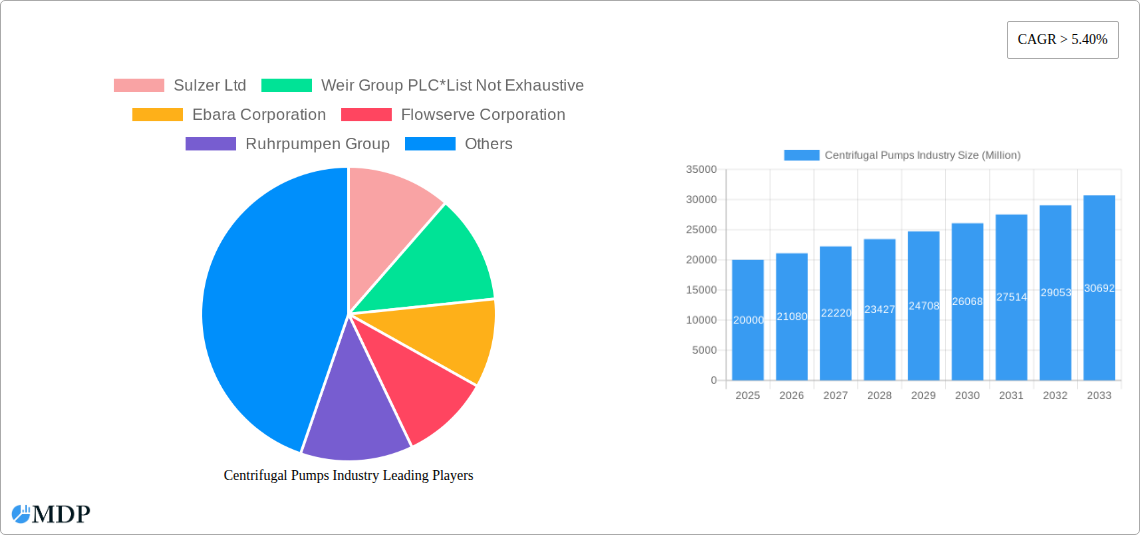
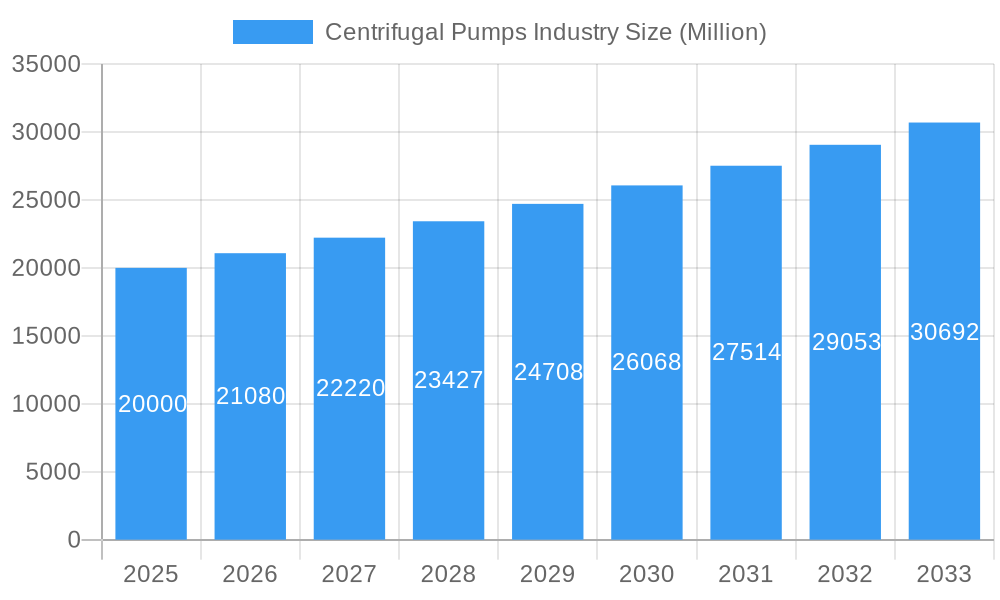
Centrifugal Pumps Industry Market Size (In Billion)
Intense competition characterizes the centrifugal pumps market, with leading players actively pursuing market share through innovation, strategic alliances, and global expansion. However, market dynamics are influenced by challenges such as volatile raw material pricing and stringent environmental regulations. Despite these headwinds, the long-term outlook for the centrifugal pumps market remains highly favorable, underpinned by sustained demand from pivotal industries and continuous technological advancements that yield more efficient and durable pumping solutions essential for various industrial processes. Analysis indicates that the multi-stage pump segment is expected to exhibit accelerated growth compared to single-stage pumps, driven by the rising demand for high-pressure applications in the oil and gas and power generation sectors.
Centrifugal Pumps Industry Company Market Share
Centrifugal Pumps Industry: A Comprehensive Market Report (2019-2033)
This comprehensive report provides an in-depth analysis of the global centrifugal pumps industry, offering invaluable insights for stakeholders, investors, and industry professionals. With a study period spanning 2019-2033, a base year of 2025, and a forecast period of 2025-2033, this report leverages historical data (2019-2024) to project future market trends and growth opportunities. The report covers key market segments, leading players, and significant industry developments, providing a holistic view of this dynamic sector. The total market size is estimated to reach xx Million by 2033.
Centrifugal Pumps Industry Market Dynamics & Concentration
The centrifugal pumps market is characterized by a moderately concentrated landscape, with several major players holding significant market share. Market concentration is influenced by factors such as technological advancements, regulatory changes, and strategic mergers and acquisitions (M&A). Innovation, particularly in energy efficiency and smart technologies, is a key driver, pushing companies to develop higher-performing and more sustainable pumps. Stringent environmental regulations are also shaping market dynamics, incentivizing the adoption of energy-efficient models. Product substitutes, while limited, include other pumping technologies like positive displacement pumps, but centrifugal pumps maintain dominance due to their cost-effectiveness and versatility.
End-user trends are crucial, with the Oil and Gas and Power Generation sectors representing major demand drivers. The increasing need for efficient fluid handling in these industries fuels significant growth. M&A activity has been notable, with several significant deals shaping market consolidation in recent years. For example, the number of M&A deals in the sector reached approximately xx in 2022, consolidating market share among key players. The largest deals involved players such as KSB's acquisition of Bharat Pumps, significantly impacting the market share distribution.
Centrifugal Pumps Industry Industry Trends & Analysis
The centrifugal pumps market exhibits a robust growth trajectory, driven by several key factors. The compound annual growth rate (CAGR) is projected to be xx% during the forecast period (2025-2033), exceeding xx Million in value by 2033. This growth is fueled by rising infrastructure development globally, particularly in developing economies. Increased industrialization and urbanization are major drivers, boosting demand for efficient fluid handling solutions across diverse sectors. Technological advancements, particularly in smart pumps and IoT integration, are revolutionizing the industry, enhancing efficiency, monitoring capabilities, and predictive maintenance. Consumer preferences are shifting toward energy-efficient and environmentally friendly solutions, driving demand for high-efficiency centrifugal pumps with reduced carbon footprints. Competitive dynamics are characterized by intense rivalry among leading players, fostering innovation and technological advancements. Market penetration of smart pumps is gradually increasing, with a projected penetration rate of xx% by 2033.
Leading Markets & Segments in Centrifugal Pumps Industry
The centrifugal pumps market is geographically diverse, with strong presence across several regions. However, the Asia-Pacific region, particularly China and India, demonstrates significant growth potential driven by rapid industrialization and infrastructure development.
- Dominant Segments:
- Stage: Multi-stage pumps hold a larger market share due to their ability to handle higher pressures and flow rates, crucial for many industrial applications.
- End-User: The Oil and Gas sector remains a dominant end-user segment due to the extensive use of centrifugal pumps in oil and gas extraction, processing, and transportation. The Power Generation sector is another significant end-user due to their essential role in cooling systems and water management.
- Impeller Type: Enclosed impeller pumps are highly preferred for their robust design and efficiency in handling various fluids, leading to a large segment share.
Key drivers for dominance include:
- Economic Policies: Government investments in infrastructure development and supportive industrial policies drive significant demand, particularly in the Asia-Pacific region.
- Infrastructure Development: Expansion of oil and gas pipelines, power generation projects, and industrial facilities significantly contributes to market growth.
Centrifugal Pumps Industry Product Developments
Recent years have witnessed notable advancements in centrifugal pump technology. The focus is on enhancing energy efficiency, incorporating smart features for predictive maintenance, and improving operational reliability. GSD's launch of the ISH/ISP high-efficiency centrifugal pump, equipped with IoT capabilities for real-time monitoring, exemplifies this trend. This innovation provides significant competitive advantages through reduced energy consumption, improved operational efficiency, and enhanced predictive capabilities.
Key Drivers of Centrifugal Pumps Industry Growth
Several factors are driving the growth of the centrifugal pumps industry:
- Technological advancements: Development of energy-efficient pumps, smart pumps with IoT integration, and advanced materials are enhancing pump performance and efficiency.
- Economic growth: Expanding industrial sectors and infrastructure development projects in developing economies are creating substantial demand.
- Favorable regulatory environment: Government regulations promoting energy efficiency and environmental sustainability are boosting the adoption of advanced pump technologies.
Challenges in the Centrifugal Pumps Industry Market
The centrifugal pumps industry faces several challenges:
- Supply chain disruptions: Global supply chain disruptions and fluctuations in raw material prices can impact production costs and availability.
- Intense competition: The market is highly competitive, with numerous players vying for market share, putting pressure on pricing and margins.
- Environmental regulations: Stringent environmental regulations regarding energy consumption and emissions necessitate continuous innovation and adaptation. These regulations could lead to xx Million in increased compliance costs annually by 2033.
Emerging Opportunities in Centrifugal Pumps Industry
The centrifugal pumps industry presents several lucrative opportunities:
- Smart pump technology: Integration of IoT and advanced sensors to enable predictive maintenance, remote monitoring, and optimized energy management.
- Strategic partnerships and collaborations: Joint ventures and collaborations to leverage technological expertise and market access.
- Market expansion in developing economies: Targeting emerging markets with high growth potential in infrastructure development and industrialization.
Leading Players in the Centrifugal Pumps Industry Sector
- Sulzer Ltd
- Weir Group PLC
- Ebara Corporation
- Flowserve Corporation
- Ruhrpumpen Group
- Schlumberger Ltd
- KSB SE & Co KGaA
- ITT Inc
- Dover Corporation
- Baker Hughes Company
Key Milestones in Centrifugal Pumps Industry Industry
- April 2022: GSD launched the ISH/ISP high-efficiency centrifugal pump with integrated IoT capabilities for enhanced monitoring and predictive maintenance.
- March 2023: KSB acquired Bharat Pumps, expanding its market reach and aftermarket services in India.
Strategic Outlook for Centrifugal Pumps Industry Market
The centrifugal pumps market is poised for sustained growth driven by technological advancements, increasing industrialization, and infrastructure development. Strategic opportunities lie in focusing on energy efficiency, smart technologies, and expanding into high-growth markets. Companies that can effectively adapt to evolving regulations and consumer preferences while investing in innovation will be best positioned for success in this dynamic sector.
Centrifugal Pumps Industry Segmentation
-
1. Stage
- 1.1. Single-stage Pumps
- 1.2. Multi-stage Pumps
-
2. End-User
- 2.1. Oil and Gas
- 2.2. Power Generation
- 2.3. Other End-Users
-
3. Impeller Type
- 3.1. Open
- 3.2. Partially Open
- 3.3. Enclosed
Centrifugal Pumps Industry Segmentation By Geography
- 1. North America
- 2. Europe
- 3. Asia Pacific
- 4. South America
- 5. Middle East and Africa
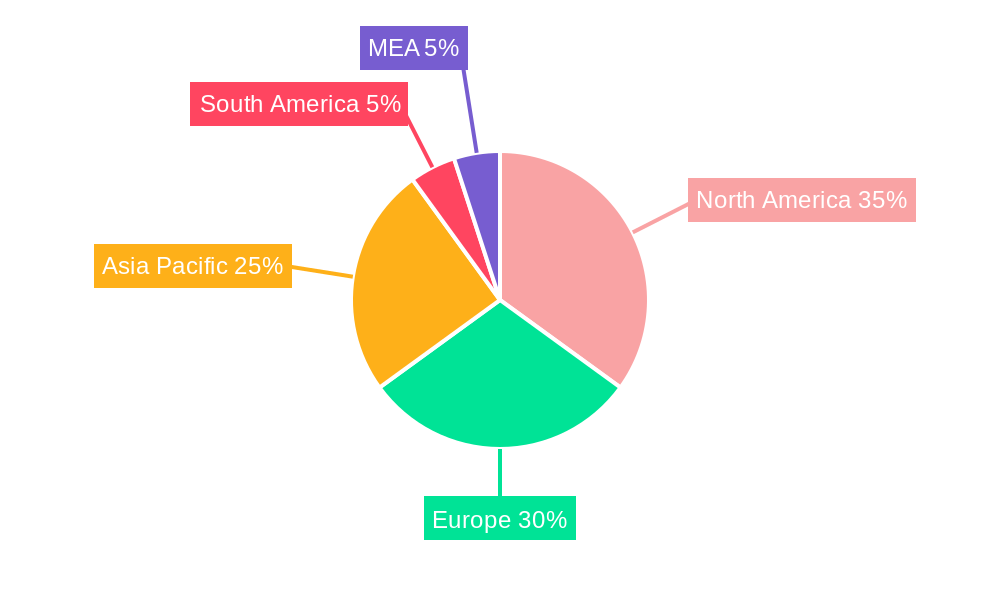
Centrifugal Pumps Industry Regional Market Share
Geographic Coverage of Centrifugal Pumps Industry
Centrifugal Pumps Industry REPORT HIGHLIGHTS
| Aspects | Details |
|---|---|
| Study Period | 2020-2034 |
| Base Year | 2025 |
| Estimated Year | 2026 |
| Forecast Period | 2026-2034 |
| Historical Period | 2020-2025 |
| Growth Rate | CAGR of 5.1% from 2020-2034 |
| Segmentation |
|
Table of Contents
- 1. Introduction
- 1.1. Research Scope
- 1.2. Market Segmentation
- 1.3. Research Objective
- 1.4. Definitions and Assumptions
- 2. Executive Summary
- 2.1. Market Snapshot
- 3. Market Dynamics
- 3.1. Market Drivers
- 3.2. Market Restrains
- 3.3. Market Trends
- 3.4. Market Opportunities
- 4. Market Factor Analysis
- 4.1. Porters Five Forces
- 4.1.1. Bargaining Power of Suppliers
- 4.1.2. Bargaining Power of Buyers
- 4.1.3. Threat of New Entrants
- 4.1.4. Threat of Substitutes
- 4.1.5. Competitive Rivalry
- 4.2. PESTEL analysis
- 4.3. BCG Analysis
- 4.3.1. Stars (High Growth, High Market Share)
- 4.3.2. Cash Cows (Low Growth, High Market Share)
- 4.3.3. Question Mark (High Growth, Low Market Share)
- 4.3.4. Dogs (Low Growth, Low Market Share)
- 4.4. Ansoff Matrix Analysis
- 4.5. Supply Chain Analysis
- 4.6. Regulatory Landscape
- 4.7. Current Market Potential and Opportunity Assessment (TAM–SAM–SOM Framework)
- 4.8. MDP Analyst Note
- 4.1. Porters Five Forces
- 5. Market Analysis, Insights and Forecast 2021-2033
- 5.1. Market Analysis, Insights and Forecast - by Stage
- 5.1.1. Single-stage Pumps
- 5.1.2. Multi-stage Pumps
- 5.2. Market Analysis, Insights and Forecast - by End-User
- 5.2.1. Oil and Gas
- 5.2.2. Power Generation
- 5.2.3. Other End-Users
- 5.3. Market Analysis, Insights and Forecast - by Impeller Type
- 5.3.1. Open
- 5.3.2. Partially Open
- 5.3.3. Enclosed
- 5.4. Market Analysis, Insights and Forecast - by Region
- 5.4.1. North America
- 5.4.2. Europe
- 5.4.3. Asia Pacific
- 5.4.4. South America
- 5.4.5. Middle East and Africa
- 5.1. Market Analysis, Insights and Forecast - by Stage
- 6. Global Centrifugal Pumps Industry Analysis, Insights and Forecast, 2021-2033
- 6.1. Market Analysis, Insights and Forecast - by Stage
- 6.1.1. Single-stage Pumps
- 6.1.2. Multi-stage Pumps
- 6.2. Market Analysis, Insights and Forecast - by End-User
- 6.2.1. Oil and Gas
- 6.2.2. Power Generation
- 6.2.3. Other End-Users
- 6.3. Market Analysis, Insights and Forecast - by Impeller Type
- 6.3.1. Open
- 6.3.2. Partially Open
- 6.3.3. Enclosed
- 6.1. Market Analysis, Insights and Forecast - by Stage
- 7. North America Centrifugal Pumps Industry Analysis, Insights and Forecast, 2020-2032
- 7.1. Market Analysis, Insights and Forecast - by Stage
- 7.1.1. Single-stage Pumps
- 7.1.2. Multi-stage Pumps
- 7.2. Market Analysis, Insights and Forecast - by End-User
- 7.2.1. Oil and Gas
- 7.2.2. Power Generation
- 7.2.3. Other End-Users
- 7.3. Market Analysis, Insights and Forecast - by Impeller Type
- 7.3.1. Open
- 7.3.2. Partially Open
- 7.3.3. Enclosed
- 7.1. Market Analysis, Insights and Forecast - by Stage
- 8. Europe Centrifugal Pumps Industry Analysis, Insights and Forecast, 2020-2032
- 8.1. Market Analysis, Insights and Forecast - by Stage
- 8.1.1. Single-stage Pumps
- 8.1.2. Multi-stage Pumps
- 8.2. Market Analysis, Insights and Forecast - by End-User
- 8.2.1. Oil and Gas
- 8.2.2. Power Generation
- 8.2.3. Other End-Users
- 8.3. Market Analysis, Insights and Forecast - by Impeller Type
- 8.3.1. Open
- 8.3.2. Partially Open
- 8.3.3. Enclosed
- 8.1. Market Analysis, Insights and Forecast - by Stage
- 9. Asia Pacific Centrifugal Pumps Industry Analysis, Insights and Forecast, 2020-2032
- 9.1. Market Analysis, Insights and Forecast - by Stage
- 9.1.1. Single-stage Pumps
- 9.1.2. Multi-stage Pumps
- 9.2. Market Analysis, Insights and Forecast - by End-User
- 9.2.1. Oil and Gas
- 9.2.2. Power Generation
- 9.2.3. Other End-Users
- 9.3. Market Analysis, Insights and Forecast - by Impeller Type
- 9.3.1. Open
- 9.3.2. Partially Open
- 9.3.3. Enclosed
- 9.1. Market Analysis, Insights and Forecast - by Stage
- 10. South America Centrifugal Pumps Industry Analysis, Insights and Forecast, 2020-2032
- 10.1. Market Analysis, Insights and Forecast - by Stage
- 10.1.1. Single-stage Pumps
- 10.1.2. Multi-stage Pumps
- 10.2. Market Analysis, Insights and Forecast - by End-User
- 10.2.1. Oil and Gas
- 10.2.2. Power Generation
- 10.2.3. Other End-Users
- 10.3. Market Analysis, Insights and Forecast - by Impeller Type
- 10.3.1. Open
- 10.3.2. Partially Open
- 10.3.3. Enclosed
- 10.1. Market Analysis, Insights and Forecast - by Stage
- 11. Middle East and Africa Centrifugal Pumps Industry Analysis, Insights and Forecast, 2020-2032
- 11.1. Market Analysis, Insights and Forecast - by Stage
- 11.1.1. Single-stage Pumps
- 11.1.2. Multi-stage Pumps
- 11.2. Market Analysis, Insights and Forecast - by End-User
- 11.2.1. Oil and Gas
- 11.2.2. Power Generation
- 11.2.3. Other End-Users
- 11.3. Market Analysis, Insights and Forecast - by Impeller Type
- 11.3.1. Open
- 11.3.2. Partially Open
- 11.3.3. Enclosed
- 11.1. Market Analysis, Insights and Forecast - by Stage
- 12. Competitive Analysis
- 12.1. Company Profiles
- 12.1.1 Sulzer Ltd
- 12.1.1.1. Company Overview
- 12.1.1.2. Products
- 12.1.1.3. Company Financials
- 12.1.1.4. SWOT Analysis
- 12.1.2 Weir Group PLC*List Not Exhaustive
- 12.1.2.1. Company Overview
- 12.1.2.2. Products
- 12.1.2.3. Company Financials
- 12.1.2.4. SWOT Analysis
- 12.1.3 Ebara Corporation
- 12.1.3.1. Company Overview
- 12.1.3.2. Products
- 12.1.3.3. Company Financials
- 12.1.3.4. SWOT Analysis
- 12.1.4 Flowserve Corporation
- 12.1.4.1. Company Overview
- 12.1.4.2. Products
- 12.1.4.3. Company Financials
- 12.1.4.4. SWOT Analysis
- 12.1.5 Ruhrpumpen Group
- 12.1.5.1. Company Overview
- 12.1.5.2. Products
- 12.1.5.3. Company Financials
- 12.1.5.4. SWOT Analysis
- 12.1.6 Schlumberger Ltd
- 12.1.6.1. Company Overview
- 12.1.6.2. Products
- 12.1.6.3. Company Financials
- 12.1.6.4. SWOT Analysis
- 12.1.7 KSB SE & Co KGaA
- 12.1.7.1. Company Overview
- 12.1.7.2. Products
- 12.1.7.3. Company Financials
- 12.1.7.4. SWOT Analysis
- 12.1.8 ITT Inc
- 12.1.8.1. Company Overview
- 12.1.8.2. Products
- 12.1.8.3. Company Financials
- 12.1.8.4. SWOT Analysis
- 12.1.9 Dover Corporation
- 12.1.9.1. Company Overview
- 12.1.9.2. Products
- 12.1.9.3. Company Financials
- 12.1.9.4. SWOT Analysis
- 12.1.10 Baker Hughes Company
- 12.1.10.1. Company Overview
- 12.1.10.2. Products
- 12.1.10.3. Company Financials
- 12.1.10.4. SWOT Analysis
- 12.1.1 Sulzer Ltd
- 12.2. Market Entropy
- 12.2.1 Company's Key Areas Served
- 12.2.2 Recent Developments
- 12.3. Company Market Share Analysis 2025
- 12.3.1 Top 5 Companies Market Share Analysis
- 12.3.2 Top 3 Companies Market Share Analysis
- 12.4. List of Potential Customers
- 13. Research Methodology
List of Figures
- Figure 1: Global Centrifugal Pumps Industry Revenue Breakdown (billion, %) by Region 2025 & 2033
- Figure 2: Global Centrifugal Pumps Industry Volume Breakdown (K Units, %) by Region 2025 & 2033
- Figure 3: North America Centrifugal Pumps Industry Revenue (billion), by Stage 2025 & 2033
- Figure 4: North America Centrifugal Pumps Industry Volume (K Units), by Stage 2025 & 2033
- Figure 5: North America Centrifugal Pumps Industry Revenue Share (%), by Stage 2025 & 2033
- Figure 6: North America Centrifugal Pumps Industry Volume Share (%), by Stage 2025 & 2033
- Figure 7: North America Centrifugal Pumps Industry Revenue (billion), by End-User 2025 & 2033
- Figure 8: North America Centrifugal Pumps Industry Volume (K Units), by End-User 2025 & 2033
- Figure 9: North America Centrifugal Pumps Industry Revenue Share (%), by End-User 2025 & 2033
- Figure 10: North America Centrifugal Pumps Industry Volume Share (%), by End-User 2025 & 2033
- Figure 11: North America Centrifugal Pumps Industry Revenue (billion), by Impeller Type 2025 & 2033
- Figure 12: North America Centrifugal Pumps Industry Volume (K Units), by Impeller Type 2025 & 2033
- Figure 13: North America Centrifugal Pumps Industry Revenue Share (%), by Impeller Type 2025 & 2033
- Figure 14: North America Centrifugal Pumps Industry Volume Share (%), by Impeller Type 2025 & 2033
- Figure 15: North America Centrifugal Pumps Industry Revenue (billion), by Country 2025 & 2033
- Figure 16: North America Centrifugal Pumps Industry Volume (K Units), by Country 2025 & 2033
- Figure 17: North America Centrifugal Pumps Industry Revenue Share (%), by Country 2025 & 2033
- Figure 18: North America Centrifugal Pumps Industry Volume Share (%), by Country 2025 & 2033
- Figure 19: Europe Centrifugal Pumps Industry Revenue (billion), by Stage 2025 & 2033
- Figure 20: Europe Centrifugal Pumps Industry Volume (K Units), by Stage 2025 & 2033
- Figure 21: Europe Centrifugal Pumps Industry Revenue Share (%), by Stage 2025 & 2033
- Figure 22: Europe Centrifugal Pumps Industry Volume Share (%), by Stage 2025 & 2033
- Figure 23: Europe Centrifugal Pumps Industry Revenue (billion), by End-User 2025 & 2033
- Figure 24: Europe Centrifugal Pumps Industry Volume (K Units), by End-User 2025 & 2033
- Figure 25: Europe Centrifugal Pumps Industry Revenue Share (%), by End-User 2025 & 2033
- Figure 26: Europe Centrifugal Pumps Industry Volume Share (%), by End-User 2025 & 2033
- Figure 27: Europe Centrifugal Pumps Industry Revenue (billion), by Impeller Type 2025 & 2033
- Figure 28: Europe Centrifugal Pumps Industry Volume (K Units), by Impeller Type 2025 & 2033
- Figure 29: Europe Centrifugal Pumps Industry Revenue Share (%), by Impeller Type 2025 & 2033
- Figure 30: Europe Centrifugal Pumps Industry Volume Share (%), by Impeller Type 2025 & 2033
- Figure 31: Europe Centrifugal Pumps Industry Revenue (billion), by Country 2025 & 2033
- Figure 32: Europe Centrifugal Pumps Industry Volume (K Units), by Country 2025 & 2033
- Figure 33: Europe Centrifugal Pumps Industry Revenue Share (%), by Country 2025 & 2033
- Figure 34: Europe Centrifugal Pumps Industry Volume Share (%), by Country 2025 & 2033
- Figure 35: Asia Pacific Centrifugal Pumps Industry Revenue (billion), by Stage 2025 & 2033
- Figure 36: Asia Pacific Centrifugal Pumps Industry Volume (K Units), by Stage 2025 & 2033
- Figure 37: Asia Pacific Centrifugal Pumps Industry Revenue Share (%), by Stage 2025 & 2033
- Figure 38: Asia Pacific Centrifugal Pumps Industry Volume Share (%), by Stage 2025 & 2033
- Figure 39: Asia Pacific Centrifugal Pumps Industry Revenue (billion), by End-User 2025 & 2033
- Figure 40: Asia Pacific Centrifugal Pumps Industry Volume (K Units), by End-User 2025 & 2033
- Figure 41: Asia Pacific Centrifugal Pumps Industry Revenue Share (%), by End-User 2025 & 2033
- Figure 42: Asia Pacific Centrifugal Pumps Industry Volume Share (%), by End-User 2025 & 2033
- Figure 43: Asia Pacific Centrifugal Pumps Industry Revenue (billion), by Impeller Type 2025 & 2033
- Figure 44: Asia Pacific Centrifugal Pumps Industry Volume (K Units), by Impeller Type 2025 & 2033
- Figure 45: Asia Pacific Centrifugal Pumps Industry Revenue Share (%), by Impeller Type 2025 & 2033
- Figure 46: Asia Pacific Centrifugal Pumps Industry Volume Share (%), by Impeller Type 2025 & 2033
- Figure 47: Asia Pacific Centrifugal Pumps Industry Revenue (billion), by Country 2025 & 2033
- Figure 48: Asia Pacific Centrifugal Pumps Industry Volume (K Units), by Country 2025 & 2033
- Figure 49: Asia Pacific Centrifugal Pumps Industry Revenue Share (%), by Country 2025 & 2033
- Figure 50: Asia Pacific Centrifugal Pumps Industry Volume Share (%), by Country 2025 & 2033
- Figure 51: South America Centrifugal Pumps Industry Revenue (billion), by Stage 2025 & 2033
- Figure 52: South America Centrifugal Pumps Industry Volume (K Units), by Stage 2025 & 2033
- Figure 53: South America Centrifugal Pumps Industry Revenue Share (%), by Stage 2025 & 2033
- Figure 54: South America Centrifugal Pumps Industry Volume Share (%), by Stage 2025 & 2033
- Figure 55: South America Centrifugal Pumps Industry Revenue (billion), by End-User 2025 & 2033
- Figure 56: South America Centrifugal Pumps Industry Volume (K Units), by End-User 2025 & 2033
- Figure 57: South America Centrifugal Pumps Industry Revenue Share (%), by End-User 2025 & 2033
- Figure 58: South America Centrifugal Pumps Industry Volume Share (%), by End-User 2025 & 2033
- Figure 59: South America Centrifugal Pumps Industry Revenue (billion), by Impeller Type 2025 & 2033
- Figure 60: South America Centrifugal Pumps Industry Volume (K Units), by Impeller Type 2025 & 2033
- Figure 61: South America Centrifugal Pumps Industry Revenue Share (%), by Impeller Type 2025 & 2033
- Figure 62: South America Centrifugal Pumps Industry Volume Share (%), by Impeller Type 2025 & 2033
- Figure 63: South America Centrifugal Pumps Industry Revenue (billion), by Country 2025 & 2033
- Figure 64: South America Centrifugal Pumps Industry Volume (K Units), by Country 2025 & 2033
- Figure 65: South America Centrifugal Pumps Industry Revenue Share (%), by Country 2025 & 2033
- Figure 66: South America Centrifugal Pumps Industry Volume Share (%), by Country 2025 & 2033
- Figure 67: Middle East and Africa Centrifugal Pumps Industry Revenue (billion), by Stage 2025 & 2033
- Figure 68: Middle East and Africa Centrifugal Pumps Industry Volume (K Units), by Stage 2025 & 2033
- Figure 69: Middle East and Africa Centrifugal Pumps Industry Revenue Share (%), by Stage 2025 & 2033
- Figure 70: Middle East and Africa Centrifugal Pumps Industry Volume Share (%), by Stage 2025 & 2033
- Figure 71: Middle East and Africa Centrifugal Pumps Industry Revenue (billion), by End-User 2025 & 2033
- Figure 72: Middle East and Africa Centrifugal Pumps Industry Volume (K Units), by End-User 2025 & 2033
- Figure 73: Middle East and Africa Centrifugal Pumps Industry Revenue Share (%), by End-User 2025 & 2033
- Figure 74: Middle East and Africa Centrifugal Pumps Industry Volume Share (%), by End-User 2025 & 2033
- Figure 75: Middle East and Africa Centrifugal Pumps Industry Revenue (billion), by Impeller Type 2025 & 2033
- Figure 76: Middle East and Africa Centrifugal Pumps Industry Volume (K Units), by Impeller Type 2025 & 2033
- Figure 77: Middle East and Africa Centrifugal Pumps Industry Revenue Share (%), by Impeller Type 2025 & 2033
- Figure 78: Middle East and Africa Centrifugal Pumps Industry Volume Share (%), by Impeller Type 2025 & 2033
- Figure 79: Middle East and Africa Centrifugal Pumps Industry Revenue (billion), by Country 2025 & 2033
- Figure 80: Middle East and Africa Centrifugal Pumps Industry Volume (K Units), by Country 2025 & 2033
- Figure 81: Middle East and Africa Centrifugal Pumps Industry Revenue Share (%), by Country 2025 & 2033
- Figure 82: Middle East and Africa Centrifugal Pumps Industry Volume Share (%), by Country 2025 & 2033
List of Tables
- Table 1: Global Centrifugal Pumps Industry Revenue billion Forecast, by Stage 2020 & 2033
- Table 2: Global Centrifugal Pumps Industry Volume K Units Forecast, by Stage 2020 & 2033
- Table 3: Global Centrifugal Pumps Industry Revenue billion Forecast, by End-User 2020 & 2033
- Table 4: Global Centrifugal Pumps Industry Volume K Units Forecast, by End-User 2020 & 2033
- Table 5: Global Centrifugal Pumps Industry Revenue billion Forecast, by Impeller Type 2020 & 2033
- Table 6: Global Centrifugal Pumps Industry Volume K Units Forecast, by Impeller Type 2020 & 2033
- Table 7: Global Centrifugal Pumps Industry Revenue billion Forecast, by Region 2020 & 2033
- Table 8: Global Centrifugal Pumps Industry Volume K Units Forecast, by Region 2020 & 2033
- Table 9: Global Centrifugal Pumps Industry Revenue billion Forecast, by Stage 2020 & 2033
- Table 10: Global Centrifugal Pumps Industry Volume K Units Forecast, by Stage 2020 & 2033
- Table 11: Global Centrifugal Pumps Industry Revenue billion Forecast, by End-User 2020 & 2033
- Table 12: Global Centrifugal Pumps Industry Volume K Units Forecast, by End-User 2020 & 2033
- Table 13: Global Centrifugal Pumps Industry Revenue billion Forecast, by Impeller Type 2020 & 2033
- Table 14: Global Centrifugal Pumps Industry Volume K Units Forecast, by Impeller Type 2020 & 2033
- Table 15: Global Centrifugal Pumps Industry Revenue billion Forecast, by Country 2020 & 2033
- Table 16: Global Centrifugal Pumps Industry Volume K Units Forecast, by Country 2020 & 2033
- Table 17: Global Centrifugal Pumps Industry Revenue billion Forecast, by Stage 2020 & 2033
- Table 18: Global Centrifugal Pumps Industry Volume K Units Forecast, by Stage 2020 & 2033
- Table 19: Global Centrifugal Pumps Industry Revenue billion Forecast, by End-User 2020 & 2033
- Table 20: Global Centrifugal Pumps Industry Volume K Units Forecast, by End-User 2020 & 2033
- Table 21: Global Centrifugal Pumps Industry Revenue billion Forecast, by Impeller Type 2020 & 2033
- Table 22: Global Centrifugal Pumps Industry Volume K Units Forecast, by Impeller Type 2020 & 2033
- Table 23: Global Centrifugal Pumps Industry Revenue billion Forecast, by Country 2020 & 2033
- Table 24: Global Centrifugal Pumps Industry Volume K Units Forecast, by Country 2020 & 2033
- Table 25: Global Centrifugal Pumps Industry Revenue billion Forecast, by Stage 2020 & 2033
- Table 26: Global Centrifugal Pumps Industry Volume K Units Forecast, by Stage 2020 & 2033
- Table 27: Global Centrifugal Pumps Industry Revenue billion Forecast, by End-User 2020 & 2033
- Table 28: Global Centrifugal Pumps Industry Volume K Units Forecast, by End-User 2020 & 2033
- Table 29: Global Centrifugal Pumps Industry Revenue billion Forecast, by Impeller Type 2020 & 2033
- Table 30: Global Centrifugal Pumps Industry Volume K Units Forecast, by Impeller Type 2020 & 2033
- Table 31: Global Centrifugal Pumps Industry Revenue billion Forecast, by Country 2020 & 2033
- Table 32: Global Centrifugal Pumps Industry Volume K Units Forecast, by Country 2020 & 2033
- Table 33: Global Centrifugal Pumps Industry Revenue billion Forecast, by Stage 2020 & 2033
- Table 34: Global Centrifugal Pumps Industry Volume K Units Forecast, by Stage 2020 & 2033
- Table 35: Global Centrifugal Pumps Industry Revenue billion Forecast, by End-User 2020 & 2033
- Table 36: Global Centrifugal Pumps Industry Volume K Units Forecast, by End-User 2020 & 2033
- Table 37: Global Centrifugal Pumps Industry Revenue billion Forecast, by Impeller Type 2020 & 2033
- Table 38: Global Centrifugal Pumps Industry Volume K Units Forecast, by Impeller Type 2020 & 2033
- Table 39: Global Centrifugal Pumps Industry Revenue billion Forecast, by Country 2020 & 2033
- Table 40: Global Centrifugal Pumps Industry Volume K Units Forecast, by Country 2020 & 2033
- Table 41: Global Centrifugal Pumps Industry Revenue billion Forecast, by Stage 2020 & 2033
- Table 42: Global Centrifugal Pumps Industry Volume K Units Forecast, by Stage 2020 & 2033
- Table 43: Global Centrifugal Pumps Industry Revenue billion Forecast, by End-User 2020 & 2033
- Table 44: Global Centrifugal Pumps Industry Volume K Units Forecast, by End-User 2020 & 2033
- Table 45: Global Centrifugal Pumps Industry Revenue billion Forecast, by Impeller Type 2020 & 2033
- Table 46: Global Centrifugal Pumps Industry Volume K Units Forecast, by Impeller Type 2020 & 2033
- Table 47: Global Centrifugal Pumps Industry Revenue billion Forecast, by Country 2020 & 2033
- Table 48: Global Centrifugal Pumps Industry Volume K Units Forecast, by Country 2020 & 2033
Frequently Asked Questions
1. What is the projected Compound Annual Growth Rate (CAGR) of the Centrifugal Pumps Industry?
The projected CAGR is approximately 5.1%.
2. Which companies are prominent players in the Centrifugal Pumps Industry?
Key companies in the market include Sulzer Ltd, Weir Group PLC*List Not Exhaustive, Ebara Corporation, Flowserve Corporation, Ruhrpumpen Group, Schlumberger Ltd, KSB SE & Co KGaA, ITT Inc, Dover Corporation, Baker Hughes Company.
3. What are the main segments of the Centrifugal Pumps Industry?
The market segments include Stage, End-User, Impeller Type.
4. Can you provide details about the market size?
The market size is estimated to be USD 33.7 billion as of 2022.
5. What are some drivers contributing to market growth?
Growing demand for natural gas and developing gas infrastructure and increasing offshore oil and Gas Exploration Activities.
6. What are the notable trends driving market growth?
Oil and Gas Segment to Dominate the Market.
7. Are there any restraints impacting market growth?
Adoption of Cleaner Alternatives.
8. Can you provide examples of recent developments in the market?
April 2022: GSD held an internal product launch of the ISH/ISP high-efficiency centrifugal pump. ISH/ISP high-efficiency centrifugal pump can be equipped with sensors at the reserved position in the design to realize the real-time monitoring, predictive alarm, fault analysis, energy efficiency analysis and operation state optimization of the equipment by matching with the GSD intelligent IOT system.
9. What pricing options are available for accessing the report?
Pricing options include single-user, multi-user, and enterprise licenses priced at USD 4750, USD 5250, and USD 8750 respectively.
10. Is the market size provided in terms of value or volume?
The market size is provided in terms of value, measured in billion and volume, measured in K Units.
11. Are there any specific market keywords associated with the report?
Yes, the market keyword associated with the report is "Centrifugal Pumps Industry," which aids in identifying and referencing the specific market segment covered.
12. How do I determine which pricing option suits my needs best?
The pricing options vary based on user requirements and access needs. Individual users may opt for single-user licenses, while businesses requiring broader access may choose multi-user or enterprise licenses for cost-effective access to the report.
13. Are there any additional resources or data provided in the Centrifugal Pumps Industry report?
While the report offers comprehensive insights, it's advisable to review the specific contents or supplementary materials provided to ascertain if additional resources or data are available.
14. How can I stay updated on further developments or reports in the Centrifugal Pumps Industry?
To stay informed about further developments, trends, and reports in the Centrifugal Pumps Industry, consider subscribing to industry newsletters, following relevant companies and organizations, or regularly checking reputable industry news sources and publications.
Methodology
Step 1 - Identification of Relevant Samples Size from Population Database


Step 2 - Approaches for Defining Global Market Size (Value, Volume* & Price*)

Note*: In applicable scenarios
Step 3 - Data Sources
Primary Research
- Web Analytics
- Survey Reports
- Research Institute
- Latest Research Reports
- Opinion Leaders
Secondary Research
- Annual Reports
- White Paper
- Latest Press Release
- Industry Association
- Paid Database
- Investor Presentations

Step 4 - Data Triangulation
Involves using different sources of information in order to increase the validity of a study
These sources are likely to be stakeholders in a program - participants, other researchers, program staff, other community members, and so on.
Then we put all data in single framework & apply various statistical tools to find out the dynamic on the market.
During the analysis stage, feedback from the stakeholder groups would be compared to determine areas of agreement as well as areas of divergence