

Key Insights
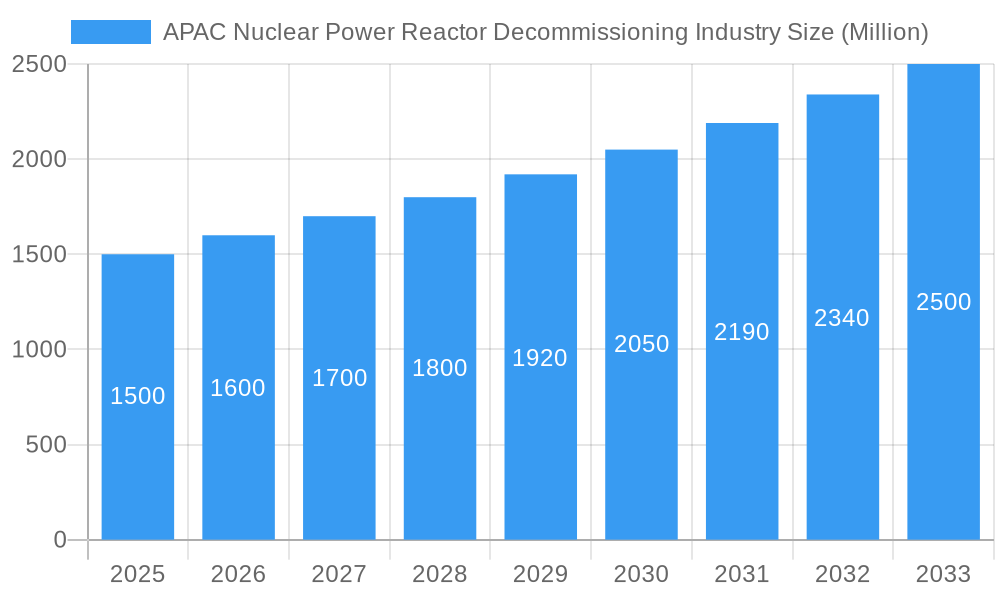
The Asia-Pacific (APAC) nuclear power reactor decommissioning market is poised for significant expansion, driven by the increasing number of aging nuclear facilities, particularly in Japan and South Korea. Reactors built in the 1970s and 1980s are nearing or have surpassed their operational lifespans, mandating decommissioning. Stringent government regulations on nuclear safety and environmental concerns surrounding spent nuclear fuel further accelerate this trend. The market is segmented by reactor type (PWR, PHWR, BWR, etc.), application (commercial, prototype, research), and capacity (below 100MW, 100-1000MW, above 1000MW). Japan, with its substantial fleet of aging reactors and established decommissioning expertise, currently dominates the market. However, China's expanding nuclear power generation will be a key growth contributor in the coming years, offering substantial opportunities for decommissioning service providers. While high costs and complex technical challenges present restraints, the continuous aging of reactors is expected to drive market growth. The APAC nuclear power reactor decommissioning market is projected to achieve a Compound Annual Growth Rate (CAGR) of 3.59% between 2025 and 2033, with an estimated market size of $8.01 billion by 2025.
APAC Nuclear Power Reactor Decommissioning Industry Market Size (In Billion)
Government policies, technological innovation, and international collaboration are shaping the APAC decommissioning market's trajectory. Leading companies such as Toshiba, Korea Hydro & Nuclear Power, and Orano are actively involved in securing contracts and advancing decommissioning technologies. The successful decommissioning of large-scale reactors and the development of effective waste management solutions are critical for market advancement. The adoption of international expertise and cutting-edge technologies from mature decommissioning industries will be instrumental in shaping the APAC market landscape. The Rest of Asia-Pacific, encompassing nations like India and South Korea, will experience growth as their nuclear power plants approach the end of their service lives, creating lucrative opportunities. A primary focus will remain on ensuring safe, efficient, and environmentally responsible decommissioning processes that align with global safety standards.
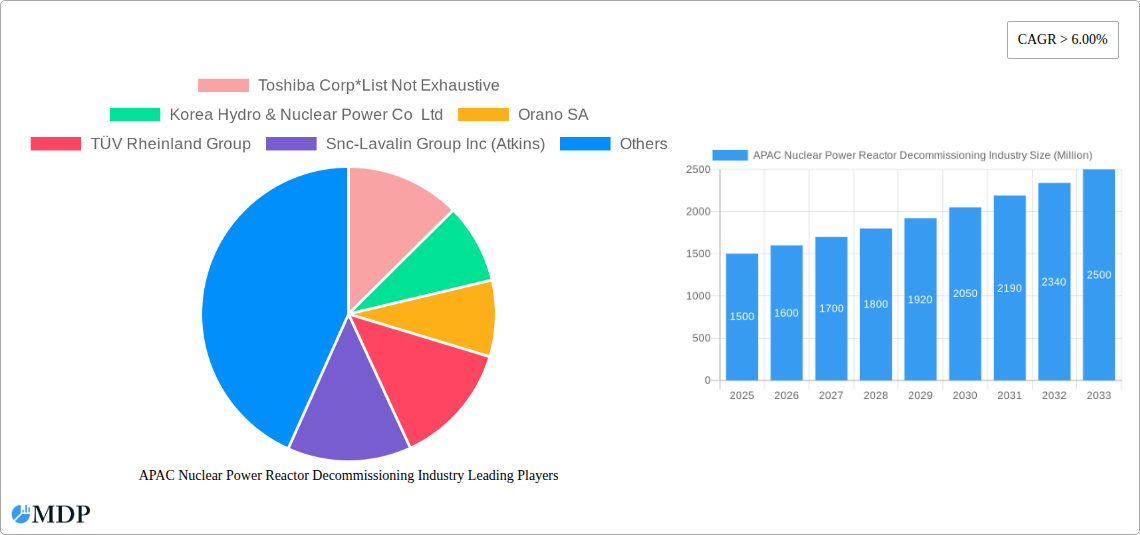
APAC Nuclear Power Reactor Decommissioning Industry Company Market Share
APAC Nuclear Power Reactor Decommissioning Industry: A Comprehensive Market Report (2019-2033)
This comprehensive report provides an in-depth analysis of the Asia-Pacific (APAC) nuclear power reactor decommissioning industry, offering crucial insights for stakeholders, investors, and industry professionals. With a study period spanning 2019-2033, a base year of 2025, and a forecast period of 2025-2033, this report meticulously examines market dynamics, key players, technological advancements, and future growth potential. The report leverages extensive data analysis and expert insights to present a clear and actionable understanding of this critical sector. Market values are expressed in Millions.
APAC Nuclear Power Reactor Decommissioning Industry Market Dynamics & Concentration
The APAC nuclear power reactor decommissioning market is characterized by a moderate level of concentration, with several key players dominating specific segments. Market share analysis reveals that Toshiba Corp holds approximately xx% of the market, while Korea Hydro & Nuclear Power Co Ltd commands approximately xx%. Innovation is driven primarily by the need for safer, faster, and more cost-effective decommissioning techniques, particularly in light of aging reactors and incidents such as Fukushima. Stringent regulatory frameworks, varying across APAC nations, significantly impact the market, while the lack of readily available substitutes for existing decommissioning technologies limits competition. End-user trends lean towards prioritizing safety and environmental compliance, pushing for advancements in waste management and site remediation. M&A activity has been relatively low in recent years, with approximately xx deals recorded between 2019 and 2024, signaling a potentially consolidating market.
APAC Nuclear Power Reactor Decommissioning Industry Industry Trends & Analysis
The APAC nuclear power reactor decommissioning market is experiencing robust growth, fueled by aging reactor fleets and the need to address environmental concerns. The Compound Annual Growth Rate (CAGR) for the period 2025-2033 is projected at xx%, driven by increasing government regulations, heightened safety concerns following major incidents, and technological advancements in dismantling and waste management. Market penetration of advanced decommissioning technologies, such as robotics and remote-controlled systems, is gradually increasing, although adoption rates vary across regions. Competitive dynamics are shaped by technological capabilities, regulatory compliance expertise, and project management skills. Consumer preferences, largely dictated by governments and regulatory bodies, emphasize cost-effectiveness, safety, and environmental responsibility.
Leading Markets & Segments in APAC Nuclear Power Reactor Decommissioning Industry
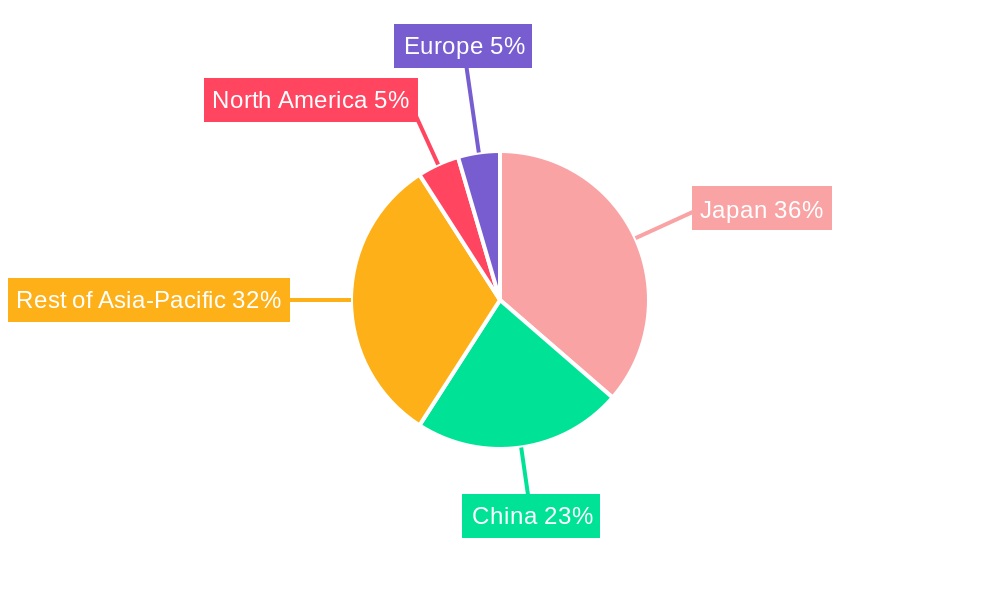
- Dominant Region: Japan, driven by the Fukushima Daiichi decommissioning project, represents the largest market share, accounting for approximately xx% of the total APAC market in 2025. China follows with xx%, and the "Rest of Asia-Pacific" accounts for xx%.
- Dominant Reactor Type: Pressurized Water Reactors (PWRs) constitute the largest segment, reflecting their widespread deployment across the region.
- Dominant Application: Commercial Power Reactors dominate the application segment due to the larger scale of decommissioning requirements.
- Dominant Capacity: The 100-1000 MW capacity segment holds the largest market share, driven by the prevalence of reactors within this size range.
Key drivers for Japan's dominance include significant government investment, stringent safety regulations post-Fukushima, and a large inventory of aging reactors. China's growth is fueled by its expanding nuclear power program and increasing focus on environmental sustainability.
Key Drivers (Japan):
- Massive government funding for Fukushima remediation.
- Stringent post-Fukushima safety regulations.
- Aging reactor fleet requiring decommissioning.
Key Drivers (China):
- Expanding nuclear power capacity.
- Increased emphasis on environmental protection.
- Investment in advanced decommissioning technologies.
APAC Nuclear Power Reactor Decommissioning Industry Product Developments
Recent product developments focus on enhancing safety, efficiency, and reducing the environmental impact of decommissioning. This includes the deployment of advanced robotics, remote-controlled equipment, and improved waste management systems. The competitive advantage lies in offering integrated solutions that combine specialized expertise with cutting-edge technology, minimizing decommissioning time and cost while adhering to strict safety and environmental regulations.
Key Drivers of APAC Nuclear Power Reactor Decommissioning Industry Growth
The growth of the APAC nuclear power reactor decommissioning industry is primarily driven by stringent governmental regulations enforcing safety and environmental standards, the increasing age of numerous reactors necessitating decommissioning, and technological advancements that offer improved efficiency and cost-effectiveness. Furthermore, substantial investments from governments and private sectors in advanced decommissioning technologies contribute significantly to the growth trajectory.
Challenges in the APAC Nuclear Power Reactor Decommissioning Industry Market
Key challenges include the high cost of decommissioning, particularly for large-scale projects, which requires substantial upfront investment and long-term financial commitments. Supply chain disruptions and the availability of skilled labor can also significantly impede project timelines. Furthermore, differing and evolving regulatory landscapes across various APAC nations create complexities in project management and compliance. These factors can lead to delays and cost overruns, ultimately affecting market growth.
Emerging Opportunities in APAP Nuclear Power Reactor Decommissioning Industry
Significant opportunities exist for companies that can offer innovative and cost-effective decommissioning solutions, particularly in the development and application of advanced robotics, AI-powered monitoring systems, and efficient waste management technologies. Strategic partnerships between international companies and local entities can accelerate technology transfer and market expansion. The expansion of the nuclear power sector in some APAC countries is likely to generate future decommissioning needs, creating long-term growth potential.
Leading Players in the APAC Nuclear Power Reactor Decommissioning Industry Sector
- Toshiba Corp
- Korea Hydro & Nuclear Power Co Ltd
- Orano SA
- TÜV Rheinland Group
- Snc-Lavalin Group Inc (Atkins)
- The Japan Atomic Power Co
- GE- Hitachi Nuclear Energy Ltd
- Tokyo Electric Power Company Holdings Inc
Key Milestones in APAC Nuclear Power Reactor Decommissioning Industry Industry
- January 2022: The Japanese government announced its plan to release 1.25 Million tonnes of treated wastewater from the Fukushima Daiichi nuclear power plant, signifying a major step in the decommissioning process. This decision highlighted the scale of the undertaking and its implications for the market.
- May 2022: Jacobs Engineering Group's selection by Tokyo Electric Power Company (TEPCO) to assist with Fukushima Daiichi's decommissioning underscores the increasing demand for specialized expertise and resources in large-scale projects.
Strategic Outlook for APAC Nuclear Power Reactor Decommissioning Industry Market
The APAC nuclear power reactor decommissioning market is poised for significant growth, driven by a combination of factors, including aging reactor fleets, strengthened regulatory environments, and continuous technological advancements. Opportunities for strategic growth include focusing on developing cost-effective and environmentally sound solutions, fostering strategic partnerships to leverage expertise and resources, and expanding into emerging markets within the region. The long-term outlook remains positive, with substantial market potential driven by the need for safe and efficient decommissioning of nuclear power plants throughout APAC.
APAC Nuclear Power Reactor Decommissioning Industry Segmentation
-
1. Reactor Type
- 1.1. Pressurized Water Reactor
- 1.2. Pressurized Heavy Water Reactor
- 1.3. Boiling Water Reactor
- 1.4. High-temperature Gas-cooled Reactor
- 1.5. Liquid Metal Fast Breeder Reactor
- 1.6. Other Reactor Types
-
2. Application
- 2.1. Commercial Power Reactor
- 2.2. Prototype Power Reactor
- 2.3. Research Reactor
-
3. Capacity
- 3.1. Below 100 MW
- 3.2. 100-1000 MW
- 3.3. Above 1000 MW
APAC Nuclear Power Reactor Decommissioning Industry Segmentation By Geography
-
1. North America
- 1.1. United States
- 1.2. Canada
- 1.3. Mexico
-
2. South America
- 2.1. Brazil
- 2.2. Argentina
- 2.3. Rest of South America
-
3. Europe
- 3.1. United Kingdom
- 3.2. Germany
- 3.3. France
- 3.4. Italy
- 3.5. Spain
- 3.6. Russia
- 3.7. Benelux
- 3.8. Nordics
- 3.9. Rest of Europe
-
4. Middle East & Africa
- 4.1. Turkey
- 4.2. Israel
- 4.3. GCC
- 4.4. North Africa
- 4.5. South Africa
- 4.6. Rest of Middle East & Africa
-
5. Asia Pacific
- 5.1. China
- 5.2. India
- 5.3. Japan
- 5.4. South Korea
- 5.5. ASEAN
- 5.6. Oceania
- 5.7. Rest of Asia Pacific
APAC Nuclear Power Reactor Decommissioning Industry Regional Market Share
Geographic Coverage of APAC Nuclear Power Reactor Decommissioning Industry
APAC Nuclear Power Reactor Decommissioning Industry REPORT HIGHLIGHTS
| Aspects | Details |
|---|---|
| Study Period | 2020-2034 |
| Base Year | 2025 |
| Estimated Year | 2026 |
| Forecast Period | 2026-2034 |
| Historical Period | 2020-2025 |
| Growth Rate | CAGR of 3.59% from 2020-2034 |
| Segmentation |
|
Table of Contents
- 1. Introduction
- 1.1. Research Scope
- 1.2. Market Segmentation
- 1.3. Research Objective
- 1.4. Definitions and Assumptions
- 2. Executive Summary
- 2.1. Market Snapshot
- 3. Market Dynamics
- 3.1. Market Drivers
- 3.2. Market Restrains
- 3.3. Market Trends
- 3.4. Market Opportunities
- 4. Market Factor Analysis
- 4.1. Porters Five Forces
- 4.1.1. Bargaining Power of Suppliers
- 4.1.2. Bargaining Power of Buyers
- 4.1.3. Threat of New Entrants
- 4.1.4. Threat of Substitutes
- 4.1.5. Competitive Rivalry
- 4.2. PESTEL analysis
- 4.3. BCG Analysis
- 4.3.1. Stars (High Growth, High Market Share)
- 4.3.2. Cash Cows (Low Growth, High Market Share)
- 4.3.3. Question Mark (High Growth, Low Market Share)
- 4.3.4. Dogs (Low Growth, Low Market Share)
- 4.4. Ansoff Matrix Analysis
- 4.5. Supply Chain Analysis
- 4.6. Regulatory Landscape
- 4.7. Current Market Potential and Opportunity Assessment (TAM–SAM–SOM Framework)
- 4.8. MDP Analyst Note
- 4.1. Porters Five Forces
- 5. Market Analysis, Insights and Forecast 2021-2033
- 5.1. Market Analysis, Insights and Forecast - by Reactor Type
- 5.1.1. Pressurized Water Reactor
- 5.1.2. Pressurized Heavy Water Reactor
- 5.1.3. Boiling Water Reactor
- 5.1.4. High-temperature Gas-cooled Reactor
- 5.1.5. Liquid Metal Fast Breeder Reactor
- 5.1.6. Other Reactor Types
- 5.2. Market Analysis, Insights and Forecast - by Application
- 5.2.1. Commercial Power Reactor
- 5.2.2. Prototype Power Reactor
- 5.2.3. Research Reactor
- 5.3. Market Analysis, Insights and Forecast - by Capacity
- 5.3.1. Below 100 MW
- 5.3.2. 100-1000 MW
- 5.3.3. Above 1000 MW
- 5.4. Market Analysis, Insights and Forecast - by Region
- 5.4.1. North America
- 5.4.2. South America
- 5.4.3. Europe
- 5.4.4. Middle East & Africa
- 5.4.5. Asia Pacific
- 5.1. Market Analysis, Insights and Forecast - by Reactor Type
- 6. Global APAC Nuclear Power Reactor Decommissioning Industry Analysis, Insights and Forecast, 2021-2033
- 6.1. Market Analysis, Insights and Forecast - by Reactor Type
- 6.1.1. Pressurized Water Reactor
- 6.1.2. Pressurized Heavy Water Reactor
- 6.1.3. Boiling Water Reactor
- 6.1.4. High-temperature Gas-cooled Reactor
- 6.1.5. Liquid Metal Fast Breeder Reactor
- 6.1.6. Other Reactor Types
- 6.2. Market Analysis, Insights and Forecast - by Application
- 6.2.1. Commercial Power Reactor
- 6.2.2. Prototype Power Reactor
- 6.2.3. Research Reactor
- 6.3. Market Analysis, Insights and Forecast - by Capacity
- 6.3.1. Below 100 MW
- 6.3.2. 100-1000 MW
- 6.3.3. Above 1000 MW
- 6.1. Market Analysis, Insights and Forecast - by Reactor Type
- 7. North America APAC Nuclear Power Reactor Decommissioning Industry Analysis, Insights and Forecast, 2020-2032
- 7.1. Market Analysis, Insights and Forecast - by Reactor Type
- 7.1.1. Pressurized Water Reactor
- 7.1.2. Pressurized Heavy Water Reactor
- 7.1.3. Boiling Water Reactor
- 7.1.4. High-temperature Gas-cooled Reactor
- 7.1.5. Liquid Metal Fast Breeder Reactor
- 7.1.6. Other Reactor Types
- 7.2. Market Analysis, Insights and Forecast - by Application
- 7.2.1. Commercial Power Reactor
- 7.2.2. Prototype Power Reactor
- 7.2.3. Research Reactor
- 7.3. Market Analysis, Insights and Forecast - by Capacity
- 7.3.1. Below 100 MW
- 7.3.2. 100-1000 MW
- 7.3.3. Above 1000 MW
- 7.1. Market Analysis, Insights and Forecast - by Reactor Type
- 8. South America APAC Nuclear Power Reactor Decommissioning Industry Analysis, Insights and Forecast, 2020-2032
- 8.1. Market Analysis, Insights and Forecast - by Reactor Type
- 8.1.1. Pressurized Water Reactor
- 8.1.2. Pressurized Heavy Water Reactor
- 8.1.3. Boiling Water Reactor
- 8.1.4. High-temperature Gas-cooled Reactor
- 8.1.5. Liquid Metal Fast Breeder Reactor
- 8.1.6. Other Reactor Types
- 8.2. Market Analysis, Insights and Forecast - by Application
- 8.2.1. Commercial Power Reactor
- 8.2.2. Prototype Power Reactor
- 8.2.3. Research Reactor
- 8.3. Market Analysis, Insights and Forecast - by Capacity
- 8.3.1. Below 100 MW
- 8.3.2. 100-1000 MW
- 8.3.3. Above 1000 MW
- 8.1. Market Analysis, Insights and Forecast - by Reactor Type
- 9. Europe APAC Nuclear Power Reactor Decommissioning Industry Analysis, Insights and Forecast, 2020-2032
- 9.1. Market Analysis, Insights and Forecast - by Reactor Type
- 9.1.1. Pressurized Water Reactor
- 9.1.2. Pressurized Heavy Water Reactor
- 9.1.3. Boiling Water Reactor
- 9.1.4. High-temperature Gas-cooled Reactor
- 9.1.5. Liquid Metal Fast Breeder Reactor
- 9.1.6. Other Reactor Types
- 9.2. Market Analysis, Insights and Forecast - by Application
- 9.2.1. Commercial Power Reactor
- 9.2.2. Prototype Power Reactor
- 9.2.3. Research Reactor
- 9.3. Market Analysis, Insights and Forecast - by Capacity
- 9.3.1. Below 100 MW
- 9.3.2. 100-1000 MW
- 9.3.3. Above 1000 MW
- 9.1. Market Analysis, Insights and Forecast - by Reactor Type
- 10. Middle East & Africa APAC Nuclear Power Reactor Decommissioning Industry Analysis, Insights and Forecast, 2020-2032
- 10.1. Market Analysis, Insights and Forecast - by Reactor Type
- 10.1.1. Pressurized Water Reactor
- 10.1.2. Pressurized Heavy Water Reactor
- 10.1.3. Boiling Water Reactor
- 10.1.4. High-temperature Gas-cooled Reactor
- 10.1.5. Liquid Metal Fast Breeder Reactor
- 10.1.6. Other Reactor Types
- 10.2. Market Analysis, Insights and Forecast - by Application
- 10.2.1. Commercial Power Reactor
- 10.2.2. Prototype Power Reactor
- 10.2.3. Research Reactor
- 10.3. Market Analysis, Insights and Forecast - by Capacity
- 10.3.1. Below 100 MW
- 10.3.2. 100-1000 MW
- 10.3.3. Above 1000 MW
- 10.1. Market Analysis, Insights and Forecast - by Reactor Type
- 11. Asia Pacific APAC Nuclear Power Reactor Decommissioning Industry Analysis, Insights and Forecast, 2020-2032
- 11.1. Market Analysis, Insights and Forecast - by Reactor Type
- 11.1.1. Pressurized Water Reactor
- 11.1.2. Pressurized Heavy Water Reactor
- 11.1.3. Boiling Water Reactor
- 11.1.4. High-temperature Gas-cooled Reactor
- 11.1.5. Liquid Metal Fast Breeder Reactor
- 11.1.6. Other Reactor Types
- 11.2. Market Analysis, Insights and Forecast - by Application
- 11.2.1. Commercial Power Reactor
- 11.2.2. Prototype Power Reactor
- 11.2.3. Research Reactor
- 11.3. Market Analysis, Insights and Forecast - by Capacity
- 11.3.1. Below 100 MW
- 11.3.2. 100-1000 MW
- 11.3.3. Above 1000 MW
- 11.1. Market Analysis, Insights and Forecast - by Reactor Type
- 12. Competitive Analysis
- 12.1. Company Profiles
- 12.1.1 Toshiba Corp*List Not Exhaustive
- 12.1.1.1. Company Overview
- 12.1.1.2. Products
- 12.1.1.3. Company Financials
- 12.1.1.4. SWOT Analysis
- 12.1.2 Korea Hydro & Nuclear Power Co Ltd
- 12.1.2.1. Company Overview
- 12.1.2.2. Products
- 12.1.2.3. Company Financials
- 12.1.2.4. SWOT Analysis
- 12.1.3 Orano SA
- 12.1.3.1. Company Overview
- 12.1.3.2. Products
- 12.1.3.3. Company Financials
- 12.1.3.4. SWOT Analysis
- 12.1.4 TÜV Rheinland Group
- 12.1.4.1. Company Overview
- 12.1.4.2. Products
- 12.1.4.3. Company Financials
- 12.1.4.4. SWOT Analysis
- 12.1.5 Snc-Lavalin Group Inc (Atkins)
- 12.1.5.1. Company Overview
- 12.1.5.2. Products
- 12.1.5.3. Company Financials
- 12.1.5.4. SWOT Analysis
- 12.1.6 The Japan Atomic Power Co
- 12.1.6.1. Company Overview
- 12.1.6.2. Products
- 12.1.6.3. Company Financials
- 12.1.6.4. SWOT Analysis
- 12.1.7 GE- Hitachi Nuclear Energy Ltd
- 12.1.7.1. Company Overview
- 12.1.7.2. Products
- 12.1.7.3. Company Financials
- 12.1.7.4. SWOT Analysis
- 12.1.8 Tokyo Electric Power Company Holdings Inc
- 12.1.8.1. Company Overview
- 12.1.8.2. Products
- 12.1.8.3. Company Financials
- 12.1.8.4. SWOT Analysis
- 12.1.1 Toshiba Corp*List Not Exhaustive
- 12.2. Market Entropy
- 12.2.1 Company's Key Areas Served
- 12.2.2 Recent Developments
- 12.3. Company Market Share Analysis 2025
- 12.3.1 Top 5 Companies Market Share Analysis
- 12.3.2 Top 3 Companies Market Share Analysis
- 12.4. List of Potential Customers
- 13. Research Methodology
List of Figures
- Figure 1: Global APAC Nuclear Power Reactor Decommissioning Industry Revenue Breakdown (billion, %) by Region 2025 & 2033
- Figure 2: North America APAC Nuclear Power Reactor Decommissioning Industry Revenue (billion), by Reactor Type 2025 & 2033
- Figure 3: North America APAC Nuclear Power Reactor Decommissioning Industry Revenue Share (%), by Reactor Type 2025 & 2033
- Figure 4: North America APAC Nuclear Power Reactor Decommissioning Industry Revenue (billion), by Application 2025 & 2033
- Figure 5: North America APAC Nuclear Power Reactor Decommissioning Industry Revenue Share (%), by Application 2025 & 2033
- Figure 6: North America APAC Nuclear Power Reactor Decommissioning Industry Revenue (billion), by Capacity 2025 & 2033
- Figure 7: North America APAC Nuclear Power Reactor Decommissioning Industry Revenue Share (%), by Capacity 2025 & 2033
- Figure 8: North America APAC Nuclear Power Reactor Decommissioning Industry Revenue (billion), by Country 2025 & 2033
- Figure 9: North America APAC Nuclear Power Reactor Decommissioning Industry Revenue Share (%), by Country 2025 & 2033
- Figure 10: South America APAC Nuclear Power Reactor Decommissioning Industry Revenue (billion), by Reactor Type 2025 & 2033
- Figure 11: South America APAC Nuclear Power Reactor Decommissioning Industry Revenue Share (%), by Reactor Type 2025 & 2033
- Figure 12: South America APAC Nuclear Power Reactor Decommissioning Industry Revenue (billion), by Application 2025 & 2033
- Figure 13: South America APAC Nuclear Power Reactor Decommissioning Industry Revenue Share (%), by Application 2025 & 2033
- Figure 14: South America APAC Nuclear Power Reactor Decommissioning Industry Revenue (billion), by Capacity 2025 & 2033
- Figure 15: South America APAC Nuclear Power Reactor Decommissioning Industry Revenue Share (%), by Capacity 2025 & 2033
- Figure 16: South America APAC Nuclear Power Reactor Decommissioning Industry Revenue (billion), by Country 2025 & 2033
- Figure 17: South America APAC Nuclear Power Reactor Decommissioning Industry Revenue Share (%), by Country 2025 & 2033
- Figure 18: Europe APAC Nuclear Power Reactor Decommissioning Industry Revenue (billion), by Reactor Type 2025 & 2033
- Figure 19: Europe APAC Nuclear Power Reactor Decommissioning Industry Revenue Share (%), by Reactor Type 2025 & 2033
- Figure 20: Europe APAC Nuclear Power Reactor Decommissioning Industry Revenue (billion), by Application 2025 & 2033
- Figure 21: Europe APAC Nuclear Power Reactor Decommissioning Industry Revenue Share (%), by Application 2025 & 2033
- Figure 22: Europe APAC Nuclear Power Reactor Decommissioning Industry Revenue (billion), by Capacity 2025 & 2033
- Figure 23: Europe APAC Nuclear Power Reactor Decommissioning Industry Revenue Share (%), by Capacity 2025 & 2033
- Figure 24: Europe APAC Nuclear Power Reactor Decommissioning Industry Revenue (billion), by Country 2025 & 2033
- Figure 25: Europe APAC Nuclear Power Reactor Decommissioning Industry Revenue Share (%), by Country 2025 & 2033
- Figure 26: Middle East & Africa APAC Nuclear Power Reactor Decommissioning Industry Revenue (billion), by Reactor Type 2025 & 2033
- Figure 27: Middle East & Africa APAC Nuclear Power Reactor Decommissioning Industry Revenue Share (%), by Reactor Type 2025 & 2033
- Figure 28: Middle East & Africa APAC Nuclear Power Reactor Decommissioning Industry Revenue (billion), by Application 2025 & 2033
- Figure 29: Middle East & Africa APAC Nuclear Power Reactor Decommissioning Industry Revenue Share (%), by Application 2025 & 2033
- Figure 30: Middle East & Africa APAC Nuclear Power Reactor Decommissioning Industry Revenue (billion), by Capacity 2025 & 2033
- Figure 31: Middle East & Africa APAC Nuclear Power Reactor Decommissioning Industry Revenue Share (%), by Capacity 2025 & 2033
- Figure 32: Middle East & Africa APAC Nuclear Power Reactor Decommissioning Industry Revenue (billion), by Country 2025 & 2033
- Figure 33: Middle East & Africa APAC Nuclear Power Reactor Decommissioning Industry Revenue Share (%), by Country 2025 & 2033
- Figure 34: Asia Pacific APAC Nuclear Power Reactor Decommissioning Industry Revenue (billion), by Reactor Type 2025 & 2033
- Figure 35: Asia Pacific APAC Nuclear Power Reactor Decommissioning Industry Revenue Share (%), by Reactor Type 2025 & 2033
- Figure 36: Asia Pacific APAC Nuclear Power Reactor Decommissioning Industry Revenue (billion), by Application 2025 & 2033
- Figure 37: Asia Pacific APAC Nuclear Power Reactor Decommissioning Industry Revenue Share (%), by Application 2025 & 2033
- Figure 38: Asia Pacific APAC Nuclear Power Reactor Decommissioning Industry Revenue (billion), by Capacity 2025 & 2033
- Figure 39: Asia Pacific APAC Nuclear Power Reactor Decommissioning Industry Revenue Share (%), by Capacity 2025 & 2033
- Figure 40: Asia Pacific APAC Nuclear Power Reactor Decommissioning Industry Revenue (billion), by Country 2025 & 2033
- Figure 41: Asia Pacific APAC Nuclear Power Reactor Decommissioning Industry Revenue Share (%), by Country 2025 & 2033
List of Tables
- Table 1: Global APAC Nuclear Power Reactor Decommissioning Industry Revenue billion Forecast, by Reactor Type 2020 & 2033
- Table 2: Global APAC Nuclear Power Reactor Decommissioning Industry Revenue billion Forecast, by Application 2020 & 2033
- Table 3: Global APAC Nuclear Power Reactor Decommissioning Industry Revenue billion Forecast, by Capacity 2020 & 2033
- Table 4: Global APAC Nuclear Power Reactor Decommissioning Industry Revenue billion Forecast, by Region 2020 & 2033
- Table 5: Global APAC Nuclear Power Reactor Decommissioning Industry Revenue billion Forecast, by Reactor Type 2020 & 2033
- Table 6: Global APAC Nuclear Power Reactor Decommissioning Industry Revenue billion Forecast, by Application 2020 & 2033
- Table 7: Global APAC Nuclear Power Reactor Decommissioning Industry Revenue billion Forecast, by Capacity 2020 & 2033
- Table 8: Global APAC Nuclear Power Reactor Decommissioning Industry Revenue billion Forecast, by Country 2020 & 2033
- Table 9: United States APAC Nuclear Power Reactor Decommissioning Industry Revenue (billion) Forecast, by Application 2020 & 2033
- Table 10: Canada APAC Nuclear Power Reactor Decommissioning Industry Revenue (billion) Forecast, by Application 2020 & 2033
- Table 11: Mexico APAC Nuclear Power Reactor Decommissioning Industry Revenue (billion) Forecast, by Application 2020 & 2033
- Table 12: Global APAC Nuclear Power Reactor Decommissioning Industry Revenue billion Forecast, by Reactor Type 2020 & 2033
- Table 13: Global APAC Nuclear Power Reactor Decommissioning Industry Revenue billion Forecast, by Application 2020 & 2033
- Table 14: Global APAC Nuclear Power Reactor Decommissioning Industry Revenue billion Forecast, by Capacity 2020 & 2033
- Table 15: Global APAC Nuclear Power Reactor Decommissioning Industry Revenue billion Forecast, by Country 2020 & 2033
- Table 16: Brazil APAC Nuclear Power Reactor Decommissioning Industry Revenue (billion) Forecast, by Application 2020 & 2033
- Table 17: Argentina APAC Nuclear Power Reactor Decommissioning Industry Revenue (billion) Forecast, by Application 2020 & 2033
- Table 18: Rest of South America APAC Nuclear Power Reactor Decommissioning Industry Revenue (billion) Forecast, by Application 2020 & 2033
- Table 19: Global APAC Nuclear Power Reactor Decommissioning Industry Revenue billion Forecast, by Reactor Type 2020 & 2033
- Table 20: Global APAC Nuclear Power Reactor Decommissioning Industry Revenue billion Forecast, by Application 2020 & 2033
- Table 21: Global APAC Nuclear Power Reactor Decommissioning Industry Revenue billion Forecast, by Capacity 2020 & 2033
- Table 22: Global APAC Nuclear Power Reactor Decommissioning Industry Revenue billion Forecast, by Country 2020 & 2033
- Table 23: United Kingdom APAC Nuclear Power Reactor Decommissioning Industry Revenue (billion) Forecast, by Application 2020 & 2033
- Table 24: Germany APAC Nuclear Power Reactor Decommissioning Industry Revenue (billion) Forecast, by Application 2020 & 2033
- Table 25: France APAC Nuclear Power Reactor Decommissioning Industry Revenue (billion) Forecast, by Application 2020 & 2033
- Table 26: Italy APAC Nuclear Power Reactor Decommissioning Industry Revenue (billion) Forecast, by Application 2020 & 2033
- Table 27: Spain APAC Nuclear Power Reactor Decommissioning Industry Revenue (billion) Forecast, by Application 2020 & 2033
- Table 28: Russia APAC Nuclear Power Reactor Decommissioning Industry Revenue (billion) Forecast, by Application 2020 & 2033
- Table 29: Benelux APAC Nuclear Power Reactor Decommissioning Industry Revenue (billion) Forecast, by Application 2020 & 2033
- Table 30: Nordics APAC Nuclear Power Reactor Decommissioning Industry Revenue (billion) Forecast, by Application 2020 & 2033
- Table 31: Rest of Europe APAC Nuclear Power Reactor Decommissioning Industry Revenue (billion) Forecast, by Application 2020 & 2033
- Table 32: Global APAC Nuclear Power Reactor Decommissioning Industry Revenue billion Forecast, by Reactor Type 2020 & 2033
- Table 33: Global APAC Nuclear Power Reactor Decommissioning Industry Revenue billion Forecast, by Application 2020 & 2033
- Table 34: Global APAC Nuclear Power Reactor Decommissioning Industry Revenue billion Forecast, by Capacity 2020 & 2033
- Table 35: Global APAC Nuclear Power Reactor Decommissioning Industry Revenue billion Forecast, by Country 2020 & 2033
- Table 36: Turkey APAC Nuclear Power Reactor Decommissioning Industry Revenue (billion) Forecast, by Application 2020 & 2033
- Table 37: Israel APAC Nuclear Power Reactor Decommissioning Industry Revenue (billion) Forecast, by Application 2020 & 2033
- Table 38: GCC APAC Nuclear Power Reactor Decommissioning Industry Revenue (billion) Forecast, by Application 2020 & 2033
- Table 39: North Africa APAC Nuclear Power Reactor Decommissioning Industry Revenue (billion) Forecast, by Application 2020 & 2033
- Table 40: South Africa APAC Nuclear Power Reactor Decommissioning Industry Revenue (billion) Forecast, by Application 2020 & 2033
- Table 41: Rest of Middle East & Africa APAC Nuclear Power Reactor Decommissioning Industry Revenue (billion) Forecast, by Application 2020 & 2033
- Table 42: Global APAC Nuclear Power Reactor Decommissioning Industry Revenue billion Forecast, by Reactor Type 2020 & 2033
- Table 43: Global APAC Nuclear Power Reactor Decommissioning Industry Revenue billion Forecast, by Application 2020 & 2033
- Table 44: Global APAC Nuclear Power Reactor Decommissioning Industry Revenue billion Forecast, by Capacity 2020 & 2033
- Table 45: Global APAC Nuclear Power Reactor Decommissioning Industry Revenue billion Forecast, by Country 2020 & 2033
- Table 46: China APAC Nuclear Power Reactor Decommissioning Industry Revenue (billion) Forecast, by Application 2020 & 2033
- Table 47: India APAC Nuclear Power Reactor Decommissioning Industry Revenue (billion) Forecast, by Application 2020 & 2033
- Table 48: Japan APAC Nuclear Power Reactor Decommissioning Industry Revenue (billion) Forecast, by Application 2020 & 2033
- Table 49: South Korea APAC Nuclear Power Reactor Decommissioning Industry Revenue (billion) Forecast, by Application 2020 & 2033
- Table 50: ASEAN APAC Nuclear Power Reactor Decommissioning Industry Revenue (billion) Forecast, by Application 2020 & 2033
- Table 51: Oceania APAC Nuclear Power Reactor Decommissioning Industry Revenue (billion) Forecast, by Application 2020 & 2033
- Table 52: Rest of Asia Pacific APAC Nuclear Power Reactor Decommissioning Industry Revenue (billion) Forecast, by Application 2020 & 2033
Frequently Asked Questions
1. What is the projected Compound Annual Growth Rate (CAGR) of the APAC Nuclear Power Reactor Decommissioning Industry?
The projected CAGR is approximately 3.59%.
2. Which companies are prominent players in the APAC Nuclear Power Reactor Decommissioning Industry?
Key companies in the market include Toshiba Corp*List Not Exhaustive, Korea Hydro & Nuclear Power Co Ltd, Orano SA, TÜV Rheinland Group, Snc-Lavalin Group Inc (Atkins), The Japan Atomic Power Co, GE- Hitachi Nuclear Energy Ltd, Tokyo Electric Power Company Holdings Inc.
3. What are the main segments of the APAC Nuclear Power Reactor Decommissioning Industry?
The market segments include Reactor Type, Application, Capacity.
4. Can you provide details about the market size?
The market size is estimated to be USD 8.01 billion as of 2022.
5. What are some drivers contributing to market growth?
Rising Demand for Reliable Electricity; Increasing Government Support for Hydropower Generation.
6. What are the notable trends driving market growth?
Commercial Power Reactor Expected to Dominate the Market.
7. Are there any restraints impacting market growth?
Negative Environmental Consequences of Hydropower Projects.
8. Can you provide examples of recent developments in the market?
May 2022: USA-based engineering group Jacobs has been selected by Tokyo Electric Power Company (Tepco) to support decommissioning efforts at its damaged Fukushima Daiichi nuclear power plant in Japan.
9. What pricing options are available for accessing the report?
Pricing options include single-user, multi-user, and enterprise licenses priced at USD 4750, USD 5250, and USD 8750 respectively.
10. Is the market size provided in terms of value or volume?
The market size is provided in terms of value, measured in billion.
11. Are there any specific market keywords associated with the report?
Yes, the market keyword associated with the report is "APAC Nuclear Power Reactor Decommissioning Industry," which aids in identifying and referencing the specific market segment covered.
12. How do I determine which pricing option suits my needs best?
The pricing options vary based on user requirements and access needs. Individual users may opt for single-user licenses, while businesses requiring broader access may choose multi-user or enterprise licenses for cost-effective access to the report.
13. Are there any additional resources or data provided in the APAC Nuclear Power Reactor Decommissioning Industry report?
While the report offers comprehensive insights, it's advisable to review the specific contents or supplementary materials provided to ascertain if additional resources or data are available.
14. How can I stay updated on further developments or reports in the APAC Nuclear Power Reactor Decommissioning Industry?
To stay informed about further developments, trends, and reports in the APAC Nuclear Power Reactor Decommissioning Industry, consider subscribing to industry newsletters, following relevant companies and organizations, or regularly checking reputable industry news sources and publications.
Methodology
Step 1 - Identification of Relevant Samples Size from Population Database


Step 2 - Approaches for Defining Global Market Size (Value, Volume* & Price*)

Note*: In applicable scenarios
Step 3 - Data Sources
Primary Research
- Web Analytics
- Survey Reports
- Research Institute
- Latest Research Reports
- Opinion Leaders
Secondary Research
- Annual Reports
- White Paper
- Latest Press Release
- Industry Association
- Paid Database
- Investor Presentations

Step 4 - Data Triangulation
Involves using different sources of information in order to increase the validity of a study
These sources are likely to be stakeholders in a program - participants, other researchers, program staff, other community members, and so on.
Then we put all data in single framework & apply various statistical tools to find out the dynamic on the market.
During the analysis stage, feedback from the stakeholder groups would be compared to determine areas of agreement as well as areas of divergence