

Key Insights
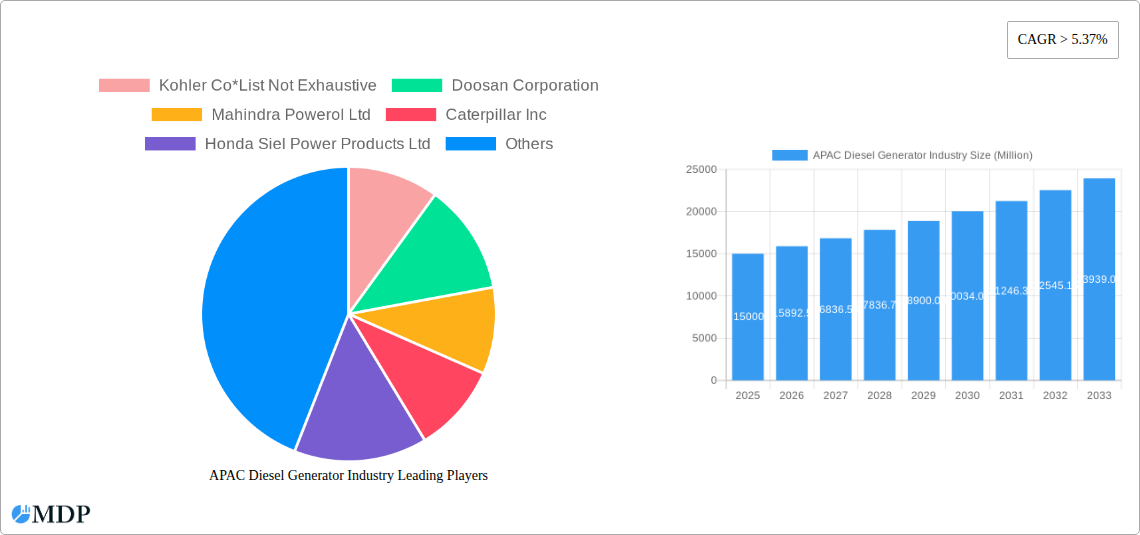
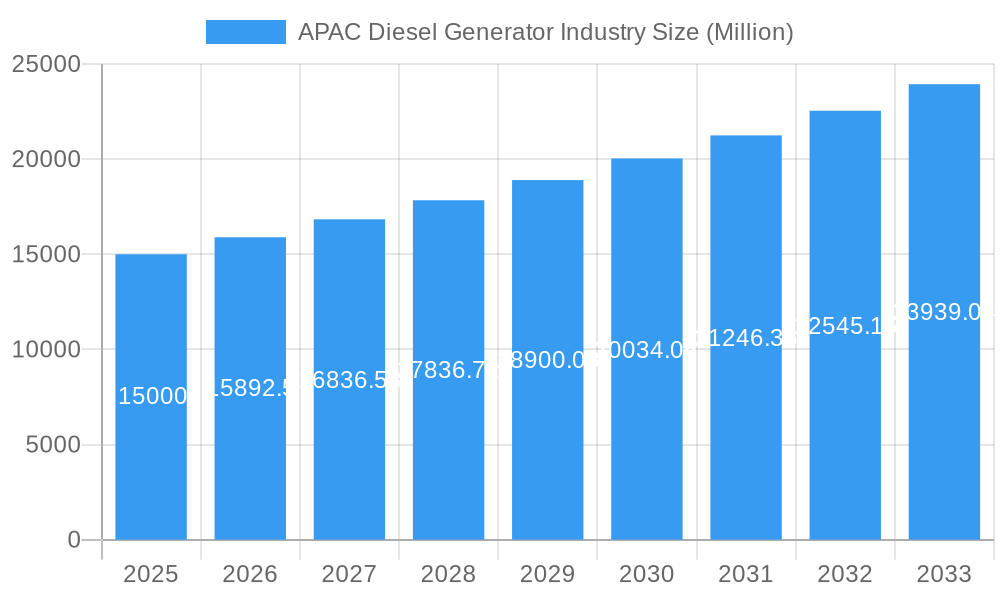
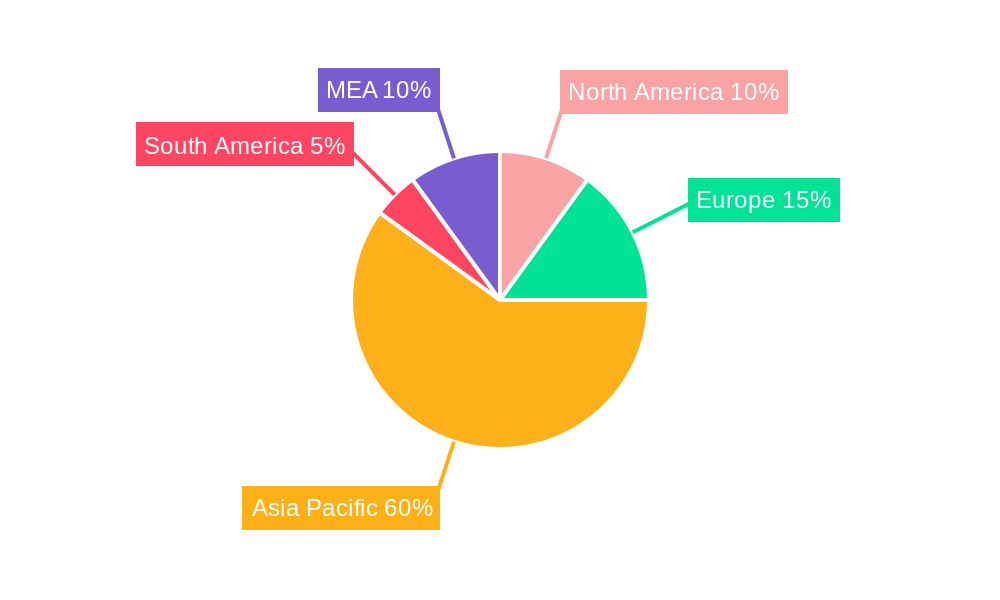
The Asia-Pacific (APAC) diesel generator market is poised for significant expansion, driven by rapid urbanization, industrial development, and the escalating need for dependable backup power across residential, commercial, and industrial sectors. Robust infrastructure development, particularly in emerging economies like India, China, and Southeast Asia, is a key catalyst for market growth. A prominent trend involves the increasing adoption of advanced diesel generators featuring enhanced fuel efficiency and reduced emissions, aligning with global sustainability objectives. However, stringent environmental regulations and the growing preference for renewable energy sources such as solar and wind power present challenges to sustained market expansion. The market is characterized by substantial demand for generators in the 75-350 kVA capacity range, primarily serving commercial and industrial applications requiring uninterrupted power. Standby power remains the leading application, with prime/continuous power applications also experiencing considerable growth due to increasing reliance on power-intensive industries. The competitive landscape is intense, with global and regional players actively pursuing market share through strategic alliances, technological innovation, and market expansion. Projecting from a global Compound Annual Growth Rate (CAGR) of 8.1%, the APAC diesel generator market is estimated to reach 39.3 billion by 2025, with continued growth expected through the forecast period (2025-2033).
APAC Diesel Generator Industry Market Size (In Billion)
Future growth will be influenced by the increasing integration of hybrid power systems, which combine diesel generators with renewable energy sources for improved sustainability and cost-effectiveness. Country-specific growth will vary based on governmental policies, economic performance, and infrastructure initiatives, with China and India expected to be primary market drivers. The market's future trajectory will depend on balancing the demand for reliable power with the accelerating adoption of sustainable energy alternatives.
APAC Diesel Generator Industry Company Market Share
APAC Diesel Generator Industry: A Comprehensive Market Report (2019-2033)
This comprehensive report provides an in-depth analysis of the Asia-Pacific (APAC) diesel generator industry, offering invaluable insights for stakeholders, investors, and industry professionals. Covering the period from 2019 to 2033, with a focus on 2025, this report meticulously examines market dynamics, trends, leading players, and future growth prospects. The report leverages extensive data analysis to provide actionable insights and strategic recommendations. Expect detailed segmentation by capacity (Below 75 kVA, 75-350 kVA, Above 350 kVA), end-user (Residential, Commercial, Industrial), and application (Standby Backup Power, Prime/Continuous Power, Peak Shaving Power).
APAC Diesel Generator Industry Market Dynamics & Concentration
The APAC diesel generator market exhibits a moderately concentrated landscape, with several key players holding significant market share. Market concentration is influenced by factors including economies of scale, technological advancements, and strategic mergers and acquisitions (M&A). The report analyzes market share distribution among leading players such as Kohler Co, Doosan Corporation, Mahindra Powerol Ltd, Caterpillar Inc, Honda Siel Power Products Ltd, Cummins Inc, Mitsubishi Heavy Industries Engine & Turbocharger Ltd, Yanmar Holdings co Ltd, and Generac Power Systems. The historical period (2019-2024) witnessed xx M&A deals, contributing to increased market consolidation. Innovation drivers, such as the development of cleaner and more efficient diesel generators, are shaping the industry. Stringent emission regulations are influencing the adoption of advanced technologies and driving a shift towards environmentally friendly alternatives. The report also explores the impact of product substitutes, such as renewable energy sources and grid power, and analyzes evolving end-user trends and preferences. Finally, the report quantifies the market share held by top 5 players at xx% in 2025 and predicts a xx% change by 2033.
APAC Diesel Generator Industry Industry Trends & Analysis
The APAC diesel generator market is experiencing robust growth, driven by increasing energy demand across various sectors. The report reveals a Compound Annual Growth Rate (CAGR) of xx% during the forecast period (2025-2033). This growth is fueled by rapid urbanization, industrialization, and expanding infrastructure projects across the region. Technological advancements, such as the integration of smart technologies and improved fuel efficiency, are also contributing to market expansion. Consumer preferences are shifting towards environmentally friendly and cost-effective solutions, impacting market dynamics. The competitive landscape is highly dynamic, with established players and new entrants vying for market share through product innovation, strategic partnerships, and aggressive pricing strategies. Market penetration of diesel generators in various end-user segments (Residential, Commercial, Industrial) is analyzed, indicating highest penetration in the Industrial segment at xx% in 2025. Further, the report projects this figure to reach xx% by 2033, demonstrating significant growth potential.
Leading Markets & Segments in APAC Diesel Generator Industry
The report identifies [Specific Country/Region - e.g., China or India] as the leading market in the APAC region, accounting for xx% of the total market revenue in 2025. This dominance is attributed to factors such as:
- Rapid Economic Growth: [Specific Country/Region]’s robust economic growth fuels increased energy demand across various sectors, boosting the need for reliable power backup solutions.
- Infrastructure Development: Large-scale infrastructure projects, including industrial parks and residential complexes, are driving demand for diesel generators.
- Government Initiatives: Supportive government policies and incentives for power generation projects are accelerating market growth.
Among the segments, the Industrial end-user segment dominates, representing xx% of the market in 2025, followed by the Commercial segment at xx%. The 75-350 kVA capacity segment holds the largest market share (xx% in 2025) due to its wide applicability across commercial and industrial sectors. The report further details the drivers and growth trajectories for each segment, offering a comprehensive picture of the market landscape.
APAC Diesel Generator Industry Product Developments
Recent product innovations focus on improving fuel efficiency, reducing emissions, and enhancing reliability. Manufacturers are integrating advanced technologies such as electronic control systems, smart monitoring capabilities, and advanced emission reduction systems. These innovations cater to growing environmental concerns and stringent emission regulations. The market sees a growing trend towards compact and modular designs, offering increased flexibility and ease of installation. The introduction of quieter and more fuel-efficient gensets are major competitive advantages, improving customer satisfaction and promoting wider adoption.
Key Drivers of APAP Diesel Generator Industry Growth
Several factors contribute to the growth of the APAC diesel generator market. These include:
- Rising Energy Demand: Rapid economic expansion and population growth across the region are driving significant increases in energy consumption.
- Infrastructure Development: The ongoing expansion of infrastructure projects, particularly in developing economies, creates a large demand for reliable power backup solutions.
- Government Support: Many governments in the region are actively promoting investments in power generation infrastructure, further bolstering market growth.
Challenges in the APAC Diesel Generator Industry Market
The APAC diesel generator market faces several challenges:
- Stringent Emission Regulations: The increasing implementation of stricter emission norms poses challenges for manufacturers, who must invest in cleaner technologies. This results in increased production costs, impacting profitability. (e.g., xx% increase in production costs).
- Supply Chain Disruptions: Global supply chain disruptions can impact the availability of key components, affecting production timelines and potentially leading to price increases. (e.g., xx% increase in lead times).
- Intense Competition: The presence of numerous players in the market creates intense competition, resulting in price pressures and the need for continuous innovation.
Emerging Opportunities in APAC Diesel Generator Industry
Several factors present significant growth opportunities:
The integration of renewable energy sources with diesel generators offers a pathway towards more sustainable power solutions. This approach addresses environmental concerns while ensuring power reliability. Strategic partnerships between diesel generator manufacturers and renewable energy companies are expected to gain momentum, creating synergistic opportunities for market expansion. Furthermore, the exploration of new markets and expansion into under-served regions present significant untapped potential.
Leading Players in the APAC Diesel Generator Industry Sector
- Kohler Co
- Doosan Corporation
- Mahindra Powerol Ltd
- Caterpillar Inc
- Honda Siel Power Products Ltd
- Cummins Inc
- Mitsubishi Heavy Industries Engine & Turbocharger Ltd
- Yanmar Holdings co Ltd
- Generac Power Systems
Key Milestones in APAC Diesel Generator Industry Industry
- June 2022: Kirloskar Group launched Kirloskar iGreen Version 2.0, featuring fuel-efficient gensets powered by the R550 series engines. This launch enhances the company's market position by offering a compact and efficient solution.
Strategic Outlook for APAC Diesel Generator Industry Market
The APAC diesel generator market is poised for sustained growth, driven by continued economic expansion, infrastructure development, and technological advancements. Strategic opportunities lie in focusing on innovation, enhancing fuel efficiency, incorporating smart technologies, and expanding into new markets. Companies that proactively adapt to changing regulations and consumer preferences will be best positioned to capitalize on the market's long-term potential.
APAC Diesel Generator Industry Segmentation
-
1. Capacity
- 1.1. Below 75 kVA
- 1.2. 75-350 kVA
- 1.3. Above 350 kVA
-
2. End-User
- 2.1. Residential
- 2.2. Commercial
- 2.3. Industrial
-
3. Application
- 3.1. Standby Backup Power
- 3.2. Prime/Continuous Power
- 3.3. Peak Shaving Power
-
4. Geography
- 4.1. China
- 4.2. India
- 4.3. Japan
- 4.4. South Korea
- 4.5. Rest of Asia-Pacific
APAC Diesel Generator Industry Segmentation By Geography
- 1. China
- 2. India
- 3. Japan
- 4. South Korea
- 5. Rest of Asia Pacific
APAC Diesel Generator Industry Regional Market Share
Geographic Coverage of APAC Diesel Generator Industry
APAC Diesel Generator Industry REPORT HIGHLIGHTS
| Aspects | Details |
|---|---|
| Study Period | 2020-2034 |
| Base Year | 2025 |
| Estimated Year | 2026 |
| Forecast Period | 2026-2034 |
| Historical Period | 2020-2025 |
| Growth Rate | CAGR of 8.1% from 2020-2034 |
| Segmentation |
|
Table of Contents
- 1. Introduction
- 1.1. Research Scope
- 1.2. Market Segmentation
- 1.3. Research Objective
- 1.4. Definitions and Assumptions
- 2. Executive Summary
- 2.1. Market Snapshot
- 3. Market Dynamics
- 3.1. Market Drivers
- 3.2. Market Restrains
- 3.3. Market Trends
- 3.4. Market Opportunities
- 4. Market Factor Analysis
- 4.1. Porters Five Forces
- 4.1.1. Bargaining Power of Suppliers
- 4.1.2. Bargaining Power of Buyers
- 4.1.3. Threat of New Entrants
- 4.1.4. Threat of Substitutes
- 4.1.5. Competitive Rivalry
- 4.2. PESTEL analysis
- 4.3. BCG Analysis
- 4.3.1. Stars (High Growth, High Market Share)
- 4.3.2. Cash Cows (Low Growth, High Market Share)
- 4.3.3. Question Mark (High Growth, Low Market Share)
- 4.3.4. Dogs (Low Growth, Low Market Share)
- 4.4. Ansoff Matrix Analysis
- 4.5. Supply Chain Analysis
- 4.6. Regulatory Landscape
- 4.7. Current Market Potential and Opportunity Assessment (TAM–SAM–SOM Framework)
- 4.8. MDP Analyst Note
- 4.1. Porters Five Forces
- 5. Market Analysis, Insights and Forecast 2021-2033
- 5.1. Market Analysis, Insights and Forecast - by Capacity
- 5.1.1. Below 75 kVA
- 5.1.2. 75-350 kVA
- 5.1.3. Above 350 kVA
- 5.2. Market Analysis, Insights and Forecast - by End-User
- 5.2.1. Residential
- 5.2.2. Commercial
- 5.2.3. Industrial
- 5.3. Market Analysis, Insights and Forecast - by Application
- 5.3.1. Standby Backup Power
- 5.3.2. Prime/Continuous Power
- 5.3.3. Peak Shaving Power
- 5.4. Market Analysis, Insights and Forecast - by Geography
- 5.4.1. China
- 5.4.2. India
- 5.4.3. Japan
- 5.4.4. South Korea
- 5.4.5. Rest of Asia-Pacific
- 5.5. Market Analysis, Insights and Forecast - by Region
- 5.5.1. China
- 5.5.2. India
- 5.5.3. Japan
- 5.5.4. South Korea
- 5.5.5. Rest of Asia Pacific
- 5.1. Market Analysis, Insights and Forecast - by Capacity
- 6. Global APAC Diesel Generator Industry Analysis, Insights and Forecast, 2021-2033
- 6.1. Market Analysis, Insights and Forecast - by Capacity
- 6.1.1. Below 75 kVA
- 6.1.2. 75-350 kVA
- 6.1.3. Above 350 kVA
- 6.2. Market Analysis, Insights and Forecast - by End-User
- 6.2.1. Residential
- 6.2.2. Commercial
- 6.2.3. Industrial
- 6.3. Market Analysis, Insights and Forecast - by Application
- 6.3.1. Standby Backup Power
- 6.3.2. Prime/Continuous Power
- 6.3.3. Peak Shaving Power
- 6.4. Market Analysis, Insights and Forecast - by Geography
- 6.4.1. China
- 6.4.2. India
- 6.4.3. Japan
- 6.4.4. South Korea
- 6.4.5. Rest of Asia-Pacific
- 6.1. Market Analysis, Insights and Forecast - by Capacity
- 7. China APAC Diesel Generator Industry Analysis, Insights and Forecast, 2020-2032
- 7.1. Market Analysis, Insights and Forecast - by Capacity
- 7.1.1. Below 75 kVA
- 7.1.2. 75-350 kVA
- 7.1.3. Above 350 kVA
- 7.2. Market Analysis, Insights and Forecast - by End-User
- 7.2.1. Residential
- 7.2.2. Commercial
- 7.2.3. Industrial
- 7.3. Market Analysis, Insights and Forecast - by Application
- 7.3.1. Standby Backup Power
- 7.3.2. Prime/Continuous Power
- 7.3.3. Peak Shaving Power
- 7.4. Market Analysis, Insights and Forecast - by Geography
- 7.4.1. China
- 7.4.2. India
- 7.4.3. Japan
- 7.4.4. South Korea
- 7.4.5. Rest of Asia-Pacific
- 7.1. Market Analysis, Insights and Forecast - by Capacity
- 8. India APAC Diesel Generator Industry Analysis, Insights and Forecast, 2020-2032
- 8.1. Market Analysis, Insights and Forecast - by Capacity
- 8.1.1. Below 75 kVA
- 8.1.2. 75-350 kVA
- 8.1.3. Above 350 kVA
- 8.2. Market Analysis, Insights and Forecast - by End-User
- 8.2.1. Residential
- 8.2.2. Commercial
- 8.2.3. Industrial
- 8.3. Market Analysis, Insights and Forecast - by Application
- 8.3.1. Standby Backup Power
- 8.3.2. Prime/Continuous Power
- 8.3.3. Peak Shaving Power
- 8.4. Market Analysis, Insights and Forecast - by Geography
- 8.4.1. China
- 8.4.2. India
- 8.4.3. Japan
- 8.4.4. South Korea
- 8.4.5. Rest of Asia-Pacific
- 8.1. Market Analysis, Insights and Forecast - by Capacity
- 9. Japan APAC Diesel Generator Industry Analysis, Insights and Forecast, 2020-2032
- 9.1. Market Analysis, Insights and Forecast - by Capacity
- 9.1.1. Below 75 kVA
- 9.1.2. 75-350 kVA
- 9.1.3. Above 350 kVA
- 9.2. Market Analysis, Insights and Forecast - by End-User
- 9.2.1. Residential
- 9.2.2. Commercial
- 9.2.3. Industrial
- 9.3. Market Analysis, Insights and Forecast - by Application
- 9.3.1. Standby Backup Power
- 9.3.2. Prime/Continuous Power
- 9.3.3. Peak Shaving Power
- 9.4. Market Analysis, Insights and Forecast - by Geography
- 9.4.1. China
- 9.4.2. India
- 9.4.3. Japan
- 9.4.4. South Korea
- 9.4.5. Rest of Asia-Pacific
- 9.1. Market Analysis, Insights and Forecast - by Capacity
- 10. South Korea APAC Diesel Generator Industry Analysis, Insights and Forecast, 2020-2032
- 10.1. Market Analysis, Insights and Forecast - by Capacity
- 10.1.1. Below 75 kVA
- 10.1.2. 75-350 kVA
- 10.1.3. Above 350 kVA
- 10.2. Market Analysis, Insights and Forecast - by End-User
- 10.2.1. Residential
- 10.2.2. Commercial
- 10.2.3. Industrial
- 10.3. Market Analysis, Insights and Forecast - by Application
- 10.3.1. Standby Backup Power
- 10.3.2. Prime/Continuous Power
- 10.3.3. Peak Shaving Power
- 10.4. Market Analysis, Insights and Forecast - by Geography
- 10.4.1. China
- 10.4.2. India
- 10.4.3. Japan
- 10.4.4. South Korea
- 10.4.5. Rest of Asia-Pacific
- 10.1. Market Analysis, Insights and Forecast - by Capacity
- 11. Rest of Asia Pacific APAC Diesel Generator Industry Analysis, Insights and Forecast, 2020-2032
- 11.1. Market Analysis, Insights and Forecast - by Capacity
- 11.1.1. Below 75 kVA
- 11.1.2. 75-350 kVA
- 11.1.3. Above 350 kVA
- 11.2. Market Analysis, Insights and Forecast - by End-User
- 11.2.1. Residential
- 11.2.2. Commercial
- 11.2.3. Industrial
- 11.3. Market Analysis, Insights and Forecast - by Application
- 11.3.1. Standby Backup Power
- 11.3.2. Prime/Continuous Power
- 11.3.3. Peak Shaving Power
- 11.4. Market Analysis, Insights and Forecast - by Geography
- 11.4.1. China
- 11.4.2. India
- 11.4.3. Japan
- 11.4.4. South Korea
- 11.4.5. Rest of Asia-Pacific
- 11.1. Market Analysis, Insights and Forecast - by Capacity
- 12. Competitive Analysis
- 12.1. Company Profiles
- 12.1.1 Kohler Co*List Not Exhaustive
- 12.1.1.1. Company Overview
- 12.1.1.2. Products
- 12.1.1.3. Company Financials
- 12.1.1.4. SWOT Analysis
- 12.1.2 Doosan Corporation
- 12.1.2.1. Company Overview
- 12.1.2.2. Products
- 12.1.2.3. Company Financials
- 12.1.2.4. SWOT Analysis
- 12.1.3 Mahindra Powerol Ltd
- 12.1.3.1. Company Overview
- 12.1.3.2. Products
- 12.1.3.3. Company Financials
- 12.1.3.4. SWOT Analysis
- 12.1.4 Caterpillar Inc
- 12.1.4.1. Company Overview
- 12.1.4.2. Products
- 12.1.4.3. Company Financials
- 12.1.4.4. SWOT Analysis
- 12.1.5 Honda Siel Power Products Ltd
- 12.1.5.1. Company Overview
- 12.1.5.2. Products
- 12.1.5.3. Company Financials
- 12.1.5.4. SWOT Analysis
- 12.1.6 Cummins Inc
- 12.1.6.1. Company Overview
- 12.1.6.2. Products
- 12.1.6.3. Company Financials
- 12.1.6.4. SWOT Analysis
- 12.1.7 Mitsubishi Heavy Industries Engine & Turbocharger Ltd
- 12.1.7.1. Company Overview
- 12.1.7.2. Products
- 12.1.7.3. Company Financials
- 12.1.7.4. SWOT Analysis
- 12.1.8 Yanmar Holdings co Ltd
- 12.1.8.1. Company Overview
- 12.1.8.2. Products
- 12.1.8.3. Company Financials
- 12.1.8.4. SWOT Analysis
- 12.1.9 Generac Power Systems
- 12.1.9.1. Company Overview
- 12.1.9.2. Products
- 12.1.9.3. Company Financials
- 12.1.9.4. SWOT Analysis
- 12.1.1 Kohler Co*List Not Exhaustive
- 12.2. Market Entropy
- 12.2.1 Company's Key Areas Served
- 12.2.2 Recent Developments
- 12.3. Company Market Share Analysis 2025
- 12.3.1 Top 5 Companies Market Share Analysis
- 12.3.2 Top 3 Companies Market Share Analysis
- 12.4. List of Potential Customers
- 13. Research Methodology
List of Figures
- Figure 1: Global APAC Diesel Generator Industry Revenue Breakdown (billion, %) by Region 2025 & 2033
- Figure 2: Global APAC Diesel Generator Industry Volume Breakdown (K Unit, %) by Region 2025 & 2033
- Figure 3: China APAC Diesel Generator Industry Revenue (billion), by Capacity 2025 & 2033
- Figure 4: China APAC Diesel Generator Industry Volume (K Unit), by Capacity 2025 & 2033
- Figure 5: China APAC Diesel Generator Industry Revenue Share (%), by Capacity 2025 & 2033
- Figure 6: China APAC Diesel Generator Industry Volume Share (%), by Capacity 2025 & 2033
- Figure 7: China APAC Diesel Generator Industry Revenue (billion), by End-User 2025 & 2033
- Figure 8: China APAC Diesel Generator Industry Volume (K Unit), by End-User 2025 & 2033
- Figure 9: China APAC Diesel Generator Industry Revenue Share (%), by End-User 2025 & 2033
- Figure 10: China APAC Diesel Generator Industry Volume Share (%), by End-User 2025 & 2033
- Figure 11: China APAC Diesel Generator Industry Revenue (billion), by Application 2025 & 2033
- Figure 12: China APAC Diesel Generator Industry Volume (K Unit), by Application 2025 & 2033
- Figure 13: China APAC Diesel Generator Industry Revenue Share (%), by Application 2025 & 2033
- Figure 14: China APAC Diesel Generator Industry Volume Share (%), by Application 2025 & 2033
- Figure 15: China APAC Diesel Generator Industry Revenue (billion), by Geography 2025 & 2033
- Figure 16: China APAC Diesel Generator Industry Volume (K Unit), by Geography 2025 & 2033
- Figure 17: China APAC Diesel Generator Industry Revenue Share (%), by Geography 2025 & 2033
- Figure 18: China APAC Diesel Generator Industry Volume Share (%), by Geography 2025 & 2033
- Figure 19: China APAC Diesel Generator Industry Revenue (billion), by Country 2025 & 2033
- Figure 20: China APAC Diesel Generator Industry Volume (K Unit), by Country 2025 & 2033
- Figure 21: China APAC Diesel Generator Industry Revenue Share (%), by Country 2025 & 2033
- Figure 22: China APAC Diesel Generator Industry Volume Share (%), by Country 2025 & 2033
- Figure 23: India APAC Diesel Generator Industry Revenue (billion), by Capacity 2025 & 2033
- Figure 24: India APAC Diesel Generator Industry Volume (K Unit), by Capacity 2025 & 2033
- Figure 25: India APAC Diesel Generator Industry Revenue Share (%), by Capacity 2025 & 2033
- Figure 26: India APAC Diesel Generator Industry Volume Share (%), by Capacity 2025 & 2033
- Figure 27: India APAC Diesel Generator Industry Revenue (billion), by End-User 2025 & 2033
- Figure 28: India APAC Diesel Generator Industry Volume (K Unit), by End-User 2025 & 2033
- Figure 29: India APAC Diesel Generator Industry Revenue Share (%), by End-User 2025 & 2033
- Figure 30: India APAC Diesel Generator Industry Volume Share (%), by End-User 2025 & 2033
- Figure 31: India APAC Diesel Generator Industry Revenue (billion), by Application 2025 & 2033
- Figure 32: India APAC Diesel Generator Industry Volume (K Unit), by Application 2025 & 2033
- Figure 33: India APAC Diesel Generator Industry Revenue Share (%), by Application 2025 & 2033
- Figure 34: India APAC Diesel Generator Industry Volume Share (%), by Application 2025 & 2033
- Figure 35: India APAC Diesel Generator Industry Revenue (billion), by Geography 2025 & 2033
- Figure 36: India APAC Diesel Generator Industry Volume (K Unit), by Geography 2025 & 2033
- Figure 37: India APAC Diesel Generator Industry Revenue Share (%), by Geography 2025 & 2033
- Figure 38: India APAC Diesel Generator Industry Volume Share (%), by Geography 2025 & 2033
- Figure 39: India APAC Diesel Generator Industry Revenue (billion), by Country 2025 & 2033
- Figure 40: India APAC Diesel Generator Industry Volume (K Unit), by Country 2025 & 2033
- Figure 41: India APAC Diesel Generator Industry Revenue Share (%), by Country 2025 & 2033
- Figure 42: India APAC Diesel Generator Industry Volume Share (%), by Country 2025 & 2033
- Figure 43: Japan APAC Diesel Generator Industry Revenue (billion), by Capacity 2025 & 2033
- Figure 44: Japan APAC Diesel Generator Industry Volume (K Unit), by Capacity 2025 & 2033
- Figure 45: Japan APAC Diesel Generator Industry Revenue Share (%), by Capacity 2025 & 2033
- Figure 46: Japan APAC Diesel Generator Industry Volume Share (%), by Capacity 2025 & 2033
- Figure 47: Japan APAC Diesel Generator Industry Revenue (billion), by End-User 2025 & 2033
- Figure 48: Japan APAC Diesel Generator Industry Volume (K Unit), by End-User 2025 & 2033
- Figure 49: Japan APAC Diesel Generator Industry Revenue Share (%), by End-User 2025 & 2033
- Figure 50: Japan APAC Diesel Generator Industry Volume Share (%), by End-User 2025 & 2033
- Figure 51: Japan APAC Diesel Generator Industry Revenue (billion), by Application 2025 & 2033
- Figure 52: Japan APAC Diesel Generator Industry Volume (K Unit), by Application 2025 & 2033
- Figure 53: Japan APAC Diesel Generator Industry Revenue Share (%), by Application 2025 & 2033
- Figure 54: Japan APAC Diesel Generator Industry Volume Share (%), by Application 2025 & 2033
- Figure 55: Japan APAC Diesel Generator Industry Revenue (billion), by Geography 2025 & 2033
- Figure 56: Japan APAC Diesel Generator Industry Volume (K Unit), by Geography 2025 & 2033
- Figure 57: Japan APAC Diesel Generator Industry Revenue Share (%), by Geography 2025 & 2033
- Figure 58: Japan APAC Diesel Generator Industry Volume Share (%), by Geography 2025 & 2033
- Figure 59: Japan APAC Diesel Generator Industry Revenue (billion), by Country 2025 & 2033
- Figure 60: Japan APAC Diesel Generator Industry Volume (K Unit), by Country 2025 & 2033
- Figure 61: Japan APAC Diesel Generator Industry Revenue Share (%), by Country 2025 & 2033
- Figure 62: Japan APAC Diesel Generator Industry Volume Share (%), by Country 2025 & 2033
- Figure 63: South Korea APAC Diesel Generator Industry Revenue (billion), by Capacity 2025 & 2033
- Figure 64: South Korea APAC Diesel Generator Industry Volume (K Unit), by Capacity 2025 & 2033
- Figure 65: South Korea APAC Diesel Generator Industry Revenue Share (%), by Capacity 2025 & 2033
- Figure 66: South Korea APAC Diesel Generator Industry Volume Share (%), by Capacity 2025 & 2033
- Figure 67: South Korea APAC Diesel Generator Industry Revenue (billion), by End-User 2025 & 2033
- Figure 68: South Korea APAC Diesel Generator Industry Volume (K Unit), by End-User 2025 & 2033
- Figure 69: South Korea APAC Diesel Generator Industry Revenue Share (%), by End-User 2025 & 2033
- Figure 70: South Korea APAC Diesel Generator Industry Volume Share (%), by End-User 2025 & 2033
- Figure 71: South Korea APAC Diesel Generator Industry Revenue (billion), by Application 2025 & 2033
- Figure 72: South Korea APAC Diesel Generator Industry Volume (K Unit), by Application 2025 & 2033
- Figure 73: South Korea APAC Diesel Generator Industry Revenue Share (%), by Application 2025 & 2033
- Figure 74: South Korea APAC Diesel Generator Industry Volume Share (%), by Application 2025 & 2033
- Figure 75: South Korea APAC Diesel Generator Industry Revenue (billion), by Geography 2025 & 2033
- Figure 76: South Korea APAC Diesel Generator Industry Volume (K Unit), by Geography 2025 & 2033
- Figure 77: South Korea APAC Diesel Generator Industry Revenue Share (%), by Geography 2025 & 2033
- Figure 78: South Korea APAC Diesel Generator Industry Volume Share (%), by Geography 2025 & 2033
- Figure 79: South Korea APAC Diesel Generator Industry Revenue (billion), by Country 2025 & 2033
- Figure 80: South Korea APAC Diesel Generator Industry Volume (K Unit), by Country 2025 & 2033
- Figure 81: South Korea APAC Diesel Generator Industry Revenue Share (%), by Country 2025 & 2033
- Figure 82: South Korea APAC Diesel Generator Industry Volume Share (%), by Country 2025 & 2033
- Figure 83: Rest of Asia Pacific APAC Diesel Generator Industry Revenue (billion), by Capacity 2025 & 2033
- Figure 84: Rest of Asia Pacific APAC Diesel Generator Industry Volume (K Unit), by Capacity 2025 & 2033
- Figure 85: Rest of Asia Pacific APAC Diesel Generator Industry Revenue Share (%), by Capacity 2025 & 2033
- Figure 86: Rest of Asia Pacific APAC Diesel Generator Industry Volume Share (%), by Capacity 2025 & 2033
- Figure 87: Rest of Asia Pacific APAC Diesel Generator Industry Revenue (billion), by End-User 2025 & 2033
- Figure 88: Rest of Asia Pacific APAC Diesel Generator Industry Volume (K Unit), by End-User 2025 & 2033
- Figure 89: Rest of Asia Pacific APAC Diesel Generator Industry Revenue Share (%), by End-User 2025 & 2033
- Figure 90: Rest of Asia Pacific APAC Diesel Generator Industry Volume Share (%), by End-User 2025 & 2033
- Figure 91: Rest of Asia Pacific APAC Diesel Generator Industry Revenue (billion), by Application 2025 & 2033
- Figure 92: Rest of Asia Pacific APAC Diesel Generator Industry Volume (K Unit), by Application 2025 & 2033
- Figure 93: Rest of Asia Pacific APAC Diesel Generator Industry Revenue Share (%), by Application 2025 & 2033
- Figure 94: Rest of Asia Pacific APAC Diesel Generator Industry Volume Share (%), by Application 2025 & 2033
- Figure 95: Rest of Asia Pacific APAC Diesel Generator Industry Revenue (billion), by Geography 2025 & 2033
- Figure 96: Rest of Asia Pacific APAC Diesel Generator Industry Volume (K Unit), by Geography 2025 & 2033
- Figure 97: Rest of Asia Pacific APAC Diesel Generator Industry Revenue Share (%), by Geography 2025 & 2033
- Figure 98: Rest of Asia Pacific APAC Diesel Generator Industry Volume Share (%), by Geography 2025 & 2033
- Figure 99: Rest of Asia Pacific APAC Diesel Generator Industry Revenue (billion), by Country 2025 & 2033
- Figure 100: Rest of Asia Pacific APAC Diesel Generator Industry Volume (K Unit), by Country 2025 & 2033
- Figure 101: Rest of Asia Pacific APAC Diesel Generator Industry Revenue Share (%), by Country 2025 & 2033
- Figure 102: Rest of Asia Pacific APAC Diesel Generator Industry Volume Share (%), by Country 2025 & 2033
List of Tables
- Table 1: Global APAC Diesel Generator Industry Revenue billion Forecast, by Capacity 2020 & 2033
- Table 2: Global APAC Diesel Generator Industry Volume K Unit Forecast, by Capacity 2020 & 2033
- Table 3: Global APAC Diesel Generator Industry Revenue billion Forecast, by End-User 2020 & 2033
- Table 4: Global APAC Diesel Generator Industry Volume K Unit Forecast, by End-User 2020 & 2033
- Table 5: Global APAC Diesel Generator Industry Revenue billion Forecast, by Application 2020 & 2033
- Table 6: Global APAC Diesel Generator Industry Volume K Unit Forecast, by Application 2020 & 2033
- Table 7: Global APAC Diesel Generator Industry Revenue billion Forecast, by Geography 2020 & 2033
- Table 8: Global APAC Diesel Generator Industry Volume K Unit Forecast, by Geography 2020 & 2033
- Table 9: Global APAC Diesel Generator Industry Revenue billion Forecast, by Region 2020 & 2033
- Table 10: Global APAC Diesel Generator Industry Volume K Unit Forecast, by Region 2020 & 2033
- Table 11: Global APAC Diesel Generator Industry Revenue billion Forecast, by Capacity 2020 & 2033
- Table 12: Global APAC Diesel Generator Industry Volume K Unit Forecast, by Capacity 2020 & 2033
- Table 13: Global APAC Diesel Generator Industry Revenue billion Forecast, by End-User 2020 & 2033
- Table 14: Global APAC Diesel Generator Industry Volume K Unit Forecast, by End-User 2020 & 2033
- Table 15: Global APAC Diesel Generator Industry Revenue billion Forecast, by Application 2020 & 2033
- Table 16: Global APAC Diesel Generator Industry Volume K Unit Forecast, by Application 2020 & 2033
- Table 17: Global APAC Diesel Generator Industry Revenue billion Forecast, by Geography 2020 & 2033
- Table 18: Global APAC Diesel Generator Industry Volume K Unit Forecast, by Geography 2020 & 2033
- Table 19: Global APAC Diesel Generator Industry Revenue billion Forecast, by Country 2020 & 2033
- Table 20: Global APAC Diesel Generator Industry Volume K Unit Forecast, by Country 2020 & 2033
- Table 21: Global APAC Diesel Generator Industry Revenue billion Forecast, by Capacity 2020 & 2033
- Table 22: Global APAC Diesel Generator Industry Volume K Unit Forecast, by Capacity 2020 & 2033
- Table 23: Global APAC Diesel Generator Industry Revenue billion Forecast, by End-User 2020 & 2033
- Table 24: Global APAC Diesel Generator Industry Volume K Unit Forecast, by End-User 2020 & 2033
- Table 25: Global APAC Diesel Generator Industry Revenue billion Forecast, by Application 2020 & 2033
- Table 26: Global APAC Diesel Generator Industry Volume K Unit Forecast, by Application 2020 & 2033
- Table 27: Global APAC Diesel Generator Industry Revenue billion Forecast, by Geography 2020 & 2033
- Table 28: Global APAC Diesel Generator Industry Volume K Unit Forecast, by Geography 2020 & 2033
- Table 29: Global APAC Diesel Generator Industry Revenue billion Forecast, by Country 2020 & 2033
- Table 30: Global APAC Diesel Generator Industry Volume K Unit Forecast, by Country 2020 & 2033
- Table 31: Global APAC Diesel Generator Industry Revenue billion Forecast, by Capacity 2020 & 2033
- Table 32: Global APAC Diesel Generator Industry Volume K Unit Forecast, by Capacity 2020 & 2033
- Table 33: Global APAC Diesel Generator Industry Revenue billion Forecast, by End-User 2020 & 2033
- Table 34: Global APAC Diesel Generator Industry Volume K Unit Forecast, by End-User 2020 & 2033
- Table 35: Global APAC Diesel Generator Industry Revenue billion Forecast, by Application 2020 & 2033
- Table 36: Global APAC Diesel Generator Industry Volume K Unit Forecast, by Application 2020 & 2033
- Table 37: Global APAC Diesel Generator Industry Revenue billion Forecast, by Geography 2020 & 2033
- Table 38: Global APAC Diesel Generator Industry Volume K Unit Forecast, by Geography 2020 & 2033
- Table 39: Global APAC Diesel Generator Industry Revenue billion Forecast, by Country 2020 & 2033
- Table 40: Global APAC Diesel Generator Industry Volume K Unit Forecast, by Country 2020 & 2033
- Table 41: Global APAC Diesel Generator Industry Revenue billion Forecast, by Capacity 2020 & 2033
- Table 42: Global APAC Diesel Generator Industry Volume K Unit Forecast, by Capacity 2020 & 2033
- Table 43: Global APAC Diesel Generator Industry Revenue billion Forecast, by End-User 2020 & 2033
- Table 44: Global APAC Diesel Generator Industry Volume K Unit Forecast, by End-User 2020 & 2033
- Table 45: Global APAC Diesel Generator Industry Revenue billion Forecast, by Application 2020 & 2033
- Table 46: Global APAC Diesel Generator Industry Volume K Unit Forecast, by Application 2020 & 2033
- Table 47: Global APAC Diesel Generator Industry Revenue billion Forecast, by Geography 2020 & 2033
- Table 48: Global APAC Diesel Generator Industry Volume K Unit Forecast, by Geography 2020 & 2033
- Table 49: Global APAC Diesel Generator Industry Revenue billion Forecast, by Country 2020 & 2033
- Table 50: Global APAC Diesel Generator Industry Volume K Unit Forecast, by Country 2020 & 2033
- Table 51: Global APAC Diesel Generator Industry Revenue billion Forecast, by Capacity 2020 & 2033
- Table 52: Global APAC Diesel Generator Industry Volume K Unit Forecast, by Capacity 2020 & 2033
- Table 53: Global APAC Diesel Generator Industry Revenue billion Forecast, by End-User 2020 & 2033
- Table 54: Global APAC Diesel Generator Industry Volume K Unit Forecast, by End-User 2020 & 2033
- Table 55: Global APAC Diesel Generator Industry Revenue billion Forecast, by Application 2020 & 2033
- Table 56: Global APAC Diesel Generator Industry Volume K Unit Forecast, by Application 2020 & 2033
- Table 57: Global APAC Diesel Generator Industry Revenue billion Forecast, by Geography 2020 & 2033
- Table 58: Global APAC Diesel Generator Industry Volume K Unit Forecast, by Geography 2020 & 2033
- Table 59: Global APAC Diesel Generator Industry Revenue billion Forecast, by Country 2020 & 2033
- Table 60: Global APAC Diesel Generator Industry Volume K Unit Forecast, by Country 2020 & 2033
Frequently Asked Questions
1. What is the projected Compound Annual Growth Rate (CAGR) of the APAC Diesel Generator Industry?
The projected CAGR is approximately 8.1%.
2. Which companies are prominent players in the APAC Diesel Generator Industry?
Key companies in the market include Kohler Co*List Not Exhaustive, Doosan Corporation, Mahindra Powerol Ltd, Caterpillar Inc, Honda Siel Power Products Ltd, Cummins Inc, Mitsubishi Heavy Industries Engine & Turbocharger Ltd, Yanmar Holdings co Ltd, Generac Power Systems.
3. What are the main segments of the APAC Diesel Generator Industry?
The market segments include Capacity, End-User, Application, Geography.
4. Can you provide details about the market size?
The market size is estimated to be USD 39.3 billion as of 2022.
5. What are some drivers contributing to market growth?
4.; Increased Demand for Uninterrupted and Reliable Power Supply4.; The Rise In the Industrial Sector.
6. What are the notable trends driving market growth?
Industrial Sector to Dominate the Market.
7. Are there any restraints impacting market growth?
4.; Advancements In Battery Technologies.
8. Can you provide examples of recent developments in the market?
June 2022: Kirloskar Group, an Indian conglomerate, unveiled Kirloskar iGreen Version 2.0 for the power generation business. The gensets powered with the R550 series of engines offer compactness, fuel efficiency, and high-power quality.
9. What pricing options are available for accessing the report?
Pricing options include single-user, multi-user, and enterprise licenses priced at USD 4750, USD 5250, and USD 8750 respectively.
10. Is the market size provided in terms of value or volume?
The market size is provided in terms of value, measured in billion and volume, measured in K Unit.
11. Are there any specific market keywords associated with the report?
Yes, the market keyword associated with the report is "APAC Diesel Generator Industry," which aids in identifying and referencing the specific market segment covered.
12. How do I determine which pricing option suits my needs best?
The pricing options vary based on user requirements and access needs. Individual users may opt for single-user licenses, while businesses requiring broader access may choose multi-user or enterprise licenses for cost-effective access to the report.
13. Are there any additional resources or data provided in the APAC Diesel Generator Industry report?
While the report offers comprehensive insights, it's advisable to review the specific contents or supplementary materials provided to ascertain if additional resources or data are available.
14. How can I stay updated on further developments or reports in the APAC Diesel Generator Industry?
To stay informed about further developments, trends, and reports in the APAC Diesel Generator Industry, consider subscribing to industry newsletters, following relevant companies and organizations, or regularly checking reputable industry news sources and publications.
Methodology
Step 1 - Identification of Relevant Samples Size from Population Database


Step 2 - Approaches for Defining Global Market Size (Value, Volume* & Price*)

Note*: In applicable scenarios
Step 3 - Data Sources
Primary Research
- Web Analytics
- Survey Reports
- Research Institute
- Latest Research Reports
- Opinion Leaders
Secondary Research
- Annual Reports
- White Paper
- Latest Press Release
- Industry Association
- Paid Database
- Investor Presentations

Step 4 - Data Triangulation
Involves using different sources of information in order to increase the validity of a study
These sources are likely to be stakeholders in a program - participants, other researchers, program staff, other community members, and so on.
Then we put all data in single framework & apply various statistical tools to find out the dynamic on the market.
During the analysis stage, feedback from the stakeholder groups would be compared to determine areas of agreement as well as areas of divergence