

Key Insights
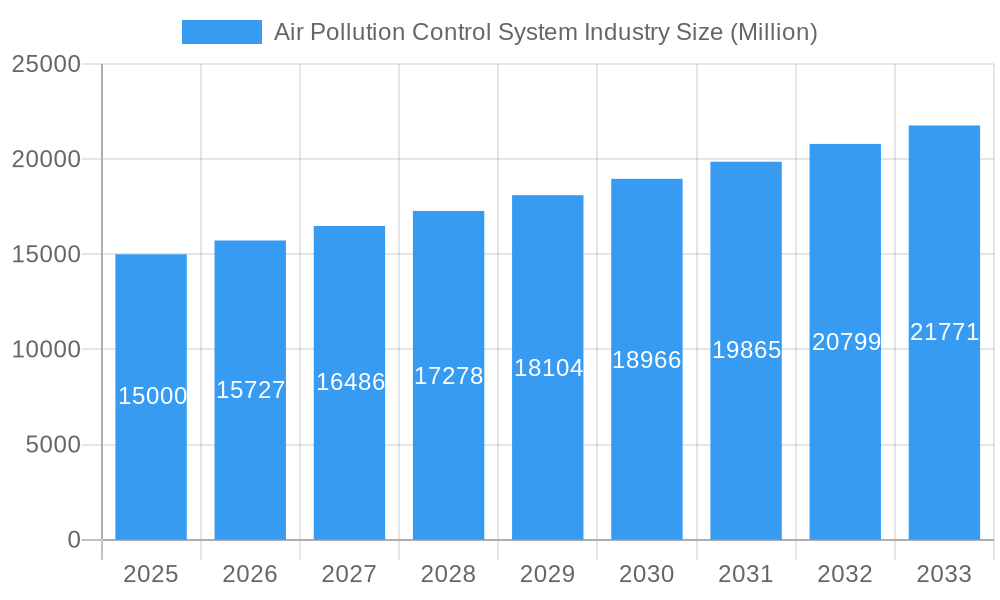
The global Air Pollution Control System (APCS) market is poised for significant expansion, propelled by escalating environmental mandates and intensified industrial activity, particularly in emerging economies. The market, valued at $103.66 billion in the base year 2025, is projected to achieve a Compound Annual Growth Rate (CAGR) of 6.3% from 2025 to 2033. Key growth catalysts include the power generation sector's increasing adoption of cleaner technologies like Electrostatic Precipitators (ESPs), Selective Catalytic Reduction (SCR) systems, and Fabric Filters, driven by emissions reduction pressures. Major industrial sectors such as cement, iron & steel, and chemicals are also significant contributors, implementing Flue Gas Desulfurization (FGD) and scrubbers to meet stringent emission standards. Furthermore, advancements in APCS technology are yielding more efficient and cost-effective solutions, enhancing accessibility across diverse industries.
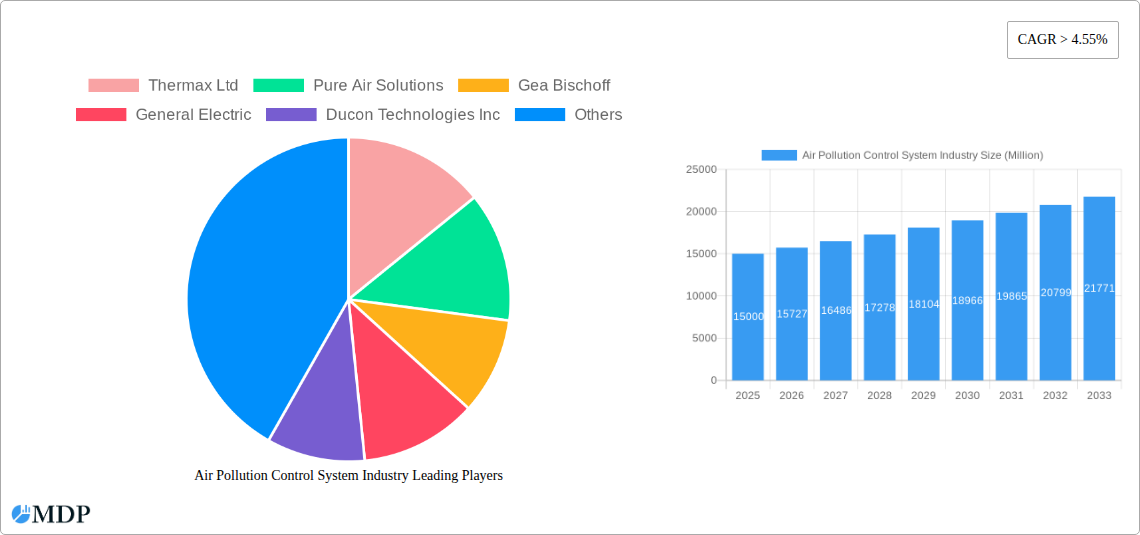
Air Pollution Control System Industry Market Size (In Billion)
Despite robust growth prospects, the APCS market faces impediments such as substantial initial capital expenditure and ongoing operational and maintenance costs, particularly for smaller enterprises in developing regions. Nevertheless, the imperative for air quality improvement and regulatory compliance is expected to drive sustained market development. The market exhibits strong demand across key applications including power generation, cement, iron & steel, and chemical industries. Geographically, the Asia-Pacific region, led by China and India's rapid industrialization, and North America, characterized by stringent environmental regulations and technological innovation, are anticipated to be primary growth centers. Prominent industry players such as Thermax Ltd, Pure Air Solutions, and General Electric are instrumental in shaping market dynamics through continuous innovation and strategic expansion.
Air Pollution Control System Industry Company Market Share
Air Pollution Control System Industry Market Report: 2019-2033
Dive deep into the comprehensive analysis of the Air Pollution Control System industry, projecting a market valuation of $XX Million by 2033. This in-depth report provides a detailed overview of market dynamics, leading players, and future growth opportunities, covering the period from 2019 to 2033, with 2025 as the base and estimated year.
This report is an essential resource for industry stakeholders, investors, and anyone seeking to understand the complexities and future potential of this critical sector. It offers actionable insights for strategic decision-making, supported by robust data analysis and expert forecasts.
Air Pollution Control System Industry Market Dynamics & Concentration
The global Air Pollution Control System market, valued at $XX Million in 2025, is characterized by a moderately concentrated landscape. Key players such as Thermax Ltd, GEA Bischoff (part of GEA Group), General Electric, Ducon Technologies Inc, Horiba Ltd, Hamon Corporation, Andritz AG, Siemens AG, Mitsubishi Hitachi Power Systems Ltd, Calgon Carbon Corporation, Babcock & Wilcox Enterprises Inc, and others hold significant market share, driving innovation and competition.
- Market Concentration: The top 5 players account for approximately XX% of the global market share in 2025.
- Innovation Drivers: Stringent environmental regulations and the rising demand for cleaner energy sources are major drivers of technological innovation in ESP, FGD, SCR, and other pollution control technologies.
- Regulatory Frameworks: Government regulations mandating emission reduction across various industries significantly influence market growth. Compliance costs and evolving standards shape market dynamics.
- Product Substitutes: While few direct substitutes exist for air pollution control systems, ongoing research into alternative technologies presents a potential long-term challenge.
- End-User Trends: Growing awareness of air quality's impact on public health drives increased adoption across diverse sectors. The power generation and cement industries remain major end-users.
- M&A Activities: The last five years witnessed XX M&A deals in the air pollution control system industry, primarily driven by strategies to expand market reach and technological capabilities. Larger companies are actively acquiring smaller, specialized firms.
Air Pollution Control System Industry Industry Trends & Analysis
The Air Pollution Control System market is projected to witness a CAGR of XX% during the forecast period (2025-2033). This growth is primarily fueled by increasing industrialization in developing economies, stricter emission norms, and the rising adoption of advanced technologies like AI-driven monitoring and control systems. Market penetration of advanced SCR systems is expected to increase from XX% in 2025 to XX% by 2033. The shift towards sustainable practices and renewable energy sources is also positively impacting the industry. Technological advancements, including the integration of IoT sensors and big data analytics for real-time monitoring and predictive maintenance, are creating new opportunities for market expansion. The competitive landscape is becoming more dynamic due to the emergence of innovative solutions and new entrants focusing on specialized niches. Consumer preferences are shifting towards environmentally friendly and cost-effective solutions, influencing product development and marketing strategies.
Leading Markets & Segments in Air Pollution Control System Industry
The Asia-Pacific region is projected to dominate the global market, driven by rapid industrial growth and increasing investments in infrastructure development, specifically in China and India. Within the different segments:
Type:
- Electrostatic Precipitators (ESP): The ESP segment is expected to maintain a significant market share, fueled by its established technology and relatively lower cost compared to other systems.
- Flue Gas Desulfurization (FGD): Stringent sulfur dioxide emission regulations drive demand for FGD systems, especially in the power generation sector.
- Scrubbers: The scrubber segment exhibits robust growth prospects due to its wide applicability across diverse industries.
- Selective Catalytic Reduction (SCR): SCR technology is witnessing significant adoption driven by the need for efficient NOx emission control, particularly in power plants and heavy industries.
- Fabric Filters: The fabric filter segment benefits from its versatility and effectiveness in capturing particulate matter.
Application:
- Power Generation: This remains the largest application segment, driven by stringent emission standards and the need to comply with environmental regulations.
- Cement Industry: Growing cement production globally contributes significantly to the market demand for air pollution control systems.
- Iron & Steel Industry: The industry's high emission levels necessitate the implementation of robust air pollution control measures, driving market growth.
- Chemical Industry: The chemical industry's diverse range of processes and emissions necessitates the use of customized air pollution control solutions.
- Others: Other applications, including waste-to-energy plants and various manufacturing processes, contribute to market growth.
Key Drivers:
- Stringent Environmental Regulations: Governments worldwide are implementing stricter emission norms, driving market expansion.
- Growing Industrialization: Rapid industrialization in developing economies increases the demand for air pollution control systems.
- Technological Advancements: The introduction of efficient and cost-effective technologies, such as AI-powered monitoring and control systems, is driving market growth.
- Infrastructure Development: Investments in infrastructure development across various sectors, including power and cement, contribute significantly to market expansion.
Air Pollution Control System Industry Product Developments
Recent advancements focus on developing more energy-efficient, cost-effective, and intelligent air pollution control systems. This includes the integration of IoT sensors, AI-powered predictive maintenance, and advanced materials for enhanced performance. Companies are emphasizing modular and customizable designs to cater to diverse industry requirements. Focus is also on reducing operational costs and improving system lifespan through innovative design and maintenance strategies.
Key Drivers of Air Pollution Control System Growth
The growth of the Air Pollution Control System industry is driven by a confluence of factors. Stringent environmental regulations globally are pushing industries to adopt advanced pollution control technologies. The increasing awareness of air pollution's detrimental effects on public health further fuels this demand. Additionally, technological advancements, leading to more efficient and cost-effective systems, are making adoption more attractive. Furthermore, the expansion of industrial sectors, particularly in emerging economies, contributes significantly to the market's growth trajectory.
Challenges in the Air Pollution Control System Industry Market
The industry faces several challenges, including the high initial investment cost associated with installing advanced pollution control systems. Fluctuating raw material prices and supply chain disruptions can impact profitability. Intense competition from established players and new entrants requires companies to constantly innovate and offer competitive pricing. Furthermore, adapting to evolving regulatory landscapes and ensuring compliance presents an ongoing challenge. The need for skilled labor for installation, operation, and maintenance adds to operational expenses. These factors, together, present considerable obstacles to sustained market growth.
Emerging Opportunities in Air Pollution Control System Industry
Significant growth opportunities exist for companies that can develop innovative, sustainable solutions addressing emerging pollutants. Strategic partnerships with technology providers, engineering firms, and end-users can facilitate market penetration and expand global reach. Focus on developing customized solutions for specific industry needs, particularly in emerging markets with rapidly growing industrial sectors, will prove rewarding. Furthermore, leveraging digital technologies such as AI, IoT, and big data analytics to improve system efficiency, operational optimization, and predictive maintenance represents a lucrative avenue for expansion.
Leading Players in the Air Pollution Control System Industry Sector
- Thermax Ltd
- Pure Air Solutions
- GEA Bischoff
- General Electric
- Ducon Technologies Inc
- Horiba Ltd
- Hamon Corporation
- Andritz AG
- Siemens AG
- Mitsubishi Hitachi Power Systems Ltd
- Calgon Carbon Corporation
- Fujian Longking Co Ltd
- Babcock & Wilcox Enterprises Inc
- Tri-mer
- Amec Foster Wheeler
- Esco International
Key Milestones in Air Pollution Control System Industry
- 2020: Introduction of AI-powered monitoring system by [Company Name].
- 2021: Merger between [Company A] and [Company B].
- 2022: Launch of a new, energy-efficient SCR system by [Company Name].
- 2023: Implementation of new emission standards in [Region/Country].
- 2024: Significant investment in R&D by [Company Name] for next-generation ESP technology.
Strategic Outlook for Air Pollution Control System Market
The Air Pollution Control System market is poised for robust growth in the coming years, driven by stringent environmental regulations, increasing industrial activity, and technological advancements. Strategic partnerships, focused R&D, and expansion into emerging markets represent crucial growth accelerators. Companies focusing on innovation, sustainability, and customer-centric solutions are best positioned to capitalize on the market's significant long-term potential. A proactive approach to adapting to evolving regulations and supply chain dynamics will be essential for sustained success.
Air Pollution Control System Industry Segmentation
-
1. Application
- 1.1. Power Generation
- 1.2. Cement Industry
- 1.3. Iron & Steel Industry
- 1.4. Chemical Industry
- 1.5. Others
-
2. Type
- 2.1. Electrostatic Precipitators (ESP)
- 2.2. Flue Gas Desulfurization (FGD)
- 2.3. Scrubbers
- 2.4. Selective Catalytic Reduction (SCR)
- 2.5. Fabric Filters
Air Pollution Control System Industry Segmentation By Geography
-
1. North America
- 1.1. United States
- 1.2. Canada
- 1.3. Rest of North America
-
2. Asia Pacific
- 2.1. India
- 2.2. China
- 2.3. Japan
- 2.4. Australia
- 2.5. Rest of Asia Pacific
-
3. Europe
- 3.1. Germany
- 3.2. France
- 3.3. United Kingdom
- 3.4. Italy
- 3.5. Rest of Europe
-
4. South America
- 4.1. Brazil
- 4.2. Argentina
- 4.3. Chile
- 4.4. Rest of South America
-
5. Middle East and Africa
- 5.1. Saudi Arabia
- 5.2. South Africa
- 5.3. Algeria
- 5.4. Rest of Middle East and Africa
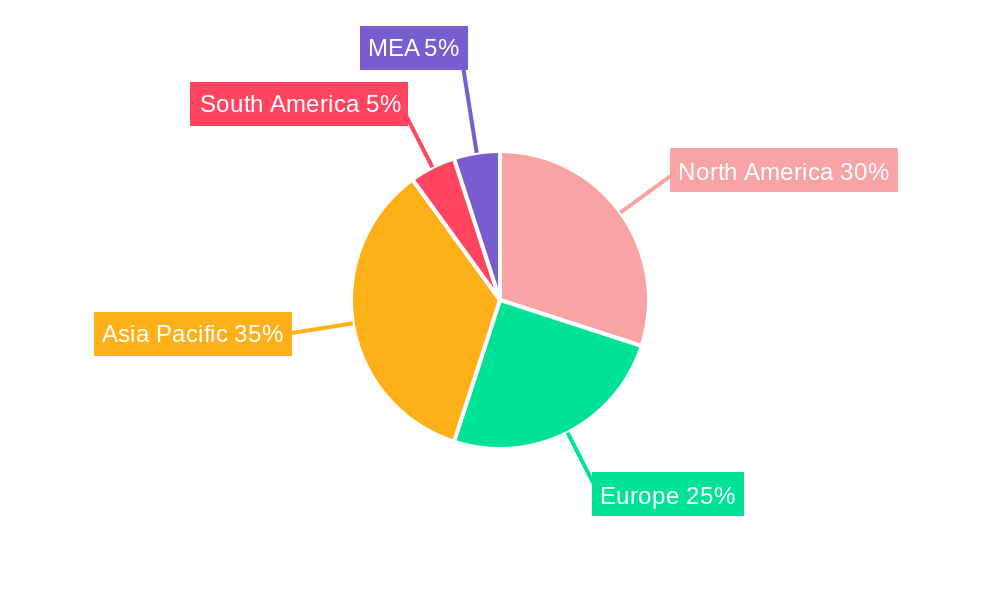
Air Pollution Control System Industry Regional Market Share
Geographic Coverage of Air Pollution Control System Industry
Air Pollution Control System Industry REPORT HIGHLIGHTS
| Aspects | Details |
|---|---|
| Study Period | 2020-2034 |
| Base Year | 2025 |
| Estimated Year | 2026 |
| Forecast Period | 2026-2034 |
| Historical Period | 2020-2025 |
| Growth Rate | CAGR of 6.3% from 2020-2034 |
| Segmentation |
|
Table of Contents
- 1. Introduction
- 1.1. Research Scope
- 1.2. Market Segmentation
- 1.3. Research Objective
- 1.4. Definitions and Assumptions
- 2. Executive Summary
- 2.1. Market Snapshot
- 3. Market Dynamics
- 3.1. Market Drivers
- 3.2. Market Restrains
- 3.3. Market Trends
- 3.4. Market Opportunities
- 4. Market Factor Analysis
- 4.1. Porters Five Forces
- 4.1.1. Bargaining Power of Suppliers
- 4.1.2. Bargaining Power of Buyers
- 4.1.3. Threat of New Entrants
- 4.1.4. Threat of Substitutes
- 4.1.5. Competitive Rivalry
- 4.2. PESTEL analysis
- 4.3. BCG Analysis
- 4.3.1. Stars (High Growth, High Market Share)
- 4.3.2. Cash Cows (Low Growth, High Market Share)
- 4.3.3. Question Mark (High Growth, Low Market Share)
- 4.3.4. Dogs (Low Growth, Low Market Share)
- 4.4. Ansoff Matrix Analysis
- 4.5. Supply Chain Analysis
- 4.6. Regulatory Landscape
- 4.7. Current Market Potential and Opportunity Assessment (TAM–SAM–SOM Framework)
- 4.8. MDP Analyst Note
- 4.1. Porters Five Forces
- 5. Market Analysis, Insights and Forecast 2021-2033
- 5.1. Market Analysis, Insights and Forecast - by Application
- 5.1.1. Power Generation
- 5.1.2. Cement Industry
- 5.1.3. Iron & Steel Industry
- 5.1.4. Chemical Industry
- 5.1.5. Others
- 5.2. Market Analysis, Insights and Forecast - by Type
- 5.2.1. Electrostatic Precipitators (ESP)
- 5.2.2. Flue Gas Desulfurization (FGD)
- 5.2.3. Scrubbers
- 5.2.4. Selective Catalytic Reduction (SCR)
- 5.2.5. Fabric Filters
- 5.3. Market Analysis, Insights and Forecast - by Region
- 5.3.1. North America
- 5.3.2. Asia Pacific
- 5.3.3. Europe
- 5.3.4. South America
- 5.3.5. Middle East and Africa
- 5.1. Market Analysis, Insights and Forecast - by Application
- 6. Global Air Pollution Control System Industry Analysis, Insights and Forecast, 2021-2033
- 6.1. Market Analysis, Insights and Forecast - by Application
- 6.1.1. Power Generation
- 6.1.2. Cement Industry
- 6.1.3. Iron & Steel Industry
- 6.1.4. Chemical Industry
- 6.1.5. Others
- 6.2. Market Analysis, Insights and Forecast - by Type
- 6.2.1. Electrostatic Precipitators (ESP)
- 6.2.2. Flue Gas Desulfurization (FGD)
- 6.2.3. Scrubbers
- 6.2.4. Selective Catalytic Reduction (SCR)
- 6.2.5. Fabric Filters
- 6.1. Market Analysis, Insights and Forecast - by Application
- 7. North America Air Pollution Control System Industry Analysis, Insights and Forecast, 2020-2032
- 7.1. Market Analysis, Insights and Forecast - by Application
- 7.1.1. Power Generation
- 7.1.2. Cement Industry
- 7.1.3. Iron & Steel Industry
- 7.1.4. Chemical Industry
- 7.1.5. Others
- 7.2. Market Analysis, Insights and Forecast - by Type
- 7.2.1. Electrostatic Precipitators (ESP)
- 7.2.2. Flue Gas Desulfurization (FGD)
- 7.2.3. Scrubbers
- 7.2.4. Selective Catalytic Reduction (SCR)
- 7.2.5. Fabric Filters
- 7.1. Market Analysis, Insights and Forecast - by Application
- 8. Asia Pacific Air Pollution Control System Industry Analysis, Insights and Forecast, 2020-2032
- 8.1. Market Analysis, Insights and Forecast - by Application
- 8.1.1. Power Generation
- 8.1.2. Cement Industry
- 8.1.3. Iron & Steel Industry
- 8.1.4. Chemical Industry
- 8.1.5. Others
- 8.2. Market Analysis, Insights and Forecast - by Type
- 8.2.1. Electrostatic Precipitators (ESP)
- 8.2.2. Flue Gas Desulfurization (FGD)
- 8.2.3. Scrubbers
- 8.2.4. Selective Catalytic Reduction (SCR)
- 8.2.5. Fabric Filters
- 8.1. Market Analysis, Insights and Forecast - by Application
- 9. Europe Air Pollution Control System Industry Analysis, Insights and Forecast, 2020-2032
- 9.1. Market Analysis, Insights and Forecast - by Application
- 9.1.1. Power Generation
- 9.1.2. Cement Industry
- 9.1.3. Iron & Steel Industry
- 9.1.4. Chemical Industry
- 9.1.5. Others
- 9.2. Market Analysis, Insights and Forecast - by Type
- 9.2.1. Electrostatic Precipitators (ESP)
- 9.2.2. Flue Gas Desulfurization (FGD)
- 9.2.3. Scrubbers
- 9.2.4. Selective Catalytic Reduction (SCR)
- 9.2.5. Fabric Filters
- 9.1. Market Analysis, Insights and Forecast - by Application
- 10. South America Air Pollution Control System Industry Analysis, Insights and Forecast, 2020-2032
- 10.1. Market Analysis, Insights and Forecast - by Application
- 10.1.1. Power Generation
- 10.1.2. Cement Industry
- 10.1.3. Iron & Steel Industry
- 10.1.4. Chemical Industry
- 10.1.5. Others
- 10.2. Market Analysis, Insights and Forecast - by Type
- 10.2.1. Electrostatic Precipitators (ESP)
- 10.2.2. Flue Gas Desulfurization (FGD)
- 10.2.3. Scrubbers
- 10.2.4. Selective Catalytic Reduction (SCR)
- 10.2.5. Fabric Filters
- 10.1. Market Analysis, Insights and Forecast - by Application
- 11. Middle East and Africa Air Pollution Control System Industry Analysis, Insights and Forecast, 2020-2032
- 11.1. Market Analysis, Insights and Forecast - by Application
- 11.1.1. Power Generation
- 11.1.2. Cement Industry
- 11.1.3. Iron & Steel Industry
- 11.1.4. Chemical Industry
- 11.1.5. Others
- 11.2. Market Analysis, Insights and Forecast - by Type
- 11.2.1. Electrostatic Precipitators (ESP)
- 11.2.2. Flue Gas Desulfurization (FGD)
- 11.2.3. Scrubbers
- 11.2.4. Selective Catalytic Reduction (SCR)
- 11.2.5. Fabric Filters
- 11.1. Market Analysis, Insights and Forecast - by Application
- 12. Competitive Analysis
- 12.1. Company Profiles
- 12.1.1 Thermax Ltd
- 12.1.1.1. Company Overview
- 12.1.1.2. Products
- 12.1.1.3. Company Financials
- 12.1.1.4. SWOT Analysis
- 12.1.2 Pure Air Solutions
- 12.1.2.1. Company Overview
- 12.1.2.2. Products
- 12.1.2.3. Company Financials
- 12.1.2.4. SWOT Analysis
- 12.1.3 Gea Bischoff
- 12.1.3.1. Company Overview
- 12.1.3.2. Products
- 12.1.3.3. Company Financials
- 12.1.3.4. SWOT Analysis
- 12.1.4 General Electric
- 12.1.4.1. Company Overview
- 12.1.4.2. Products
- 12.1.4.3. Company Financials
- 12.1.4.4. SWOT Analysis
- 12.1.5 Ducon Technologies Inc
- 12.1.5.1. Company Overview
- 12.1.5.2. Products
- 12.1.5.3. Company Financials
- 12.1.5.4. SWOT Analysis
- 12.1.6 Horiba Ltd
- 12.1.6.1. Company Overview
- 12.1.6.2. Products
- 12.1.6.3. Company Financials
- 12.1.6.4. SWOT Analysis
- 12.1.7 Hamon Corporation
- 12.1.7.1. Company Overview
- 12.1.7.2. Products
- 12.1.7.3. Company Financials
- 12.1.7.4. SWOT Analysis
- 12.1.8 Andritz Ag
- 12.1.8.1. Company Overview
- 12.1.8.2. Products
- 12.1.8.3. Company Financials
- 12.1.8.4. SWOT Analysis
- 12.1.9 Siemens AG
- 12.1.9.1. Company Overview
- 12.1.9.2. Products
- 12.1.9.3. Company Financials
- 12.1.9.4. SWOT Analysis
- 12.1.10 Mitsubishi Hitachi Power Systems Ltd
- 12.1.10.1. Company Overview
- 12.1.10.2. Products
- 12.1.10.3. Company Financials
- 12.1.10.4. SWOT Analysis
- 12.1.11 Calgon Carbon Corporation
- 12.1.11.1. Company Overview
- 12.1.11.2. Products
- 12.1.11.3. Company Financials
- 12.1.11.4. SWOT Analysis
- 12.1.12 Fujian Longking Co Ltd
- 12.1.12.1. Company Overview
- 12.1.12.2. Products
- 12.1.12.3. Company Financials
- 12.1.12.4. SWOT Analysis
- 12.1.13 Babcock & Wilcox Enterprises Inc
- 12.1.13.1. Company Overview
- 12.1.13.2. Products
- 12.1.13.3. Company Financials
- 12.1.13.4. SWOT Analysis
- 12.1.14 Tri-mer
- 12.1.14.1. Company Overview
- 12.1.14.2. Products
- 12.1.14.3. Company Financials
- 12.1.14.4. SWOT Analysis
- 12.1.15 Amec Foster Wheeler
- 12.1.15.1. Company Overview
- 12.1.15.2. Products
- 12.1.15.3. Company Financials
- 12.1.15.4. SWOT Analysis
- 12.1.16 Esco International
- 12.1.16.1. Company Overview
- 12.1.16.2. Products
- 12.1.16.3. Company Financials
- 12.1.16.4. SWOT Analysis
- 12.1.1 Thermax Ltd
- 12.2. Market Entropy
- 12.2.1 Company's Key Areas Served
- 12.2.2 Recent Developments
- 12.3. Company Market Share Analysis 2025
- 12.3.1 Top 5 Companies Market Share Analysis
- 12.3.2 Top 3 Companies Market Share Analysis
- 12.4. List of Potential Customers
- 13. Research Methodology
List of Figures
- Figure 1: Global Air Pollution Control System Industry Revenue Breakdown (billion, %) by Region 2025 & 2033
- Figure 2: North America Air Pollution Control System Industry Revenue (billion), by Application 2025 & 2033
- Figure 3: North America Air Pollution Control System Industry Revenue Share (%), by Application 2025 & 2033
- Figure 4: North America Air Pollution Control System Industry Revenue (billion), by Type 2025 & 2033
- Figure 5: North America Air Pollution Control System Industry Revenue Share (%), by Type 2025 & 2033
- Figure 6: North America Air Pollution Control System Industry Revenue (billion), by Country 2025 & 2033
- Figure 7: North America Air Pollution Control System Industry Revenue Share (%), by Country 2025 & 2033
- Figure 8: Asia Pacific Air Pollution Control System Industry Revenue (billion), by Application 2025 & 2033
- Figure 9: Asia Pacific Air Pollution Control System Industry Revenue Share (%), by Application 2025 & 2033
- Figure 10: Asia Pacific Air Pollution Control System Industry Revenue (billion), by Type 2025 & 2033
- Figure 11: Asia Pacific Air Pollution Control System Industry Revenue Share (%), by Type 2025 & 2033
- Figure 12: Asia Pacific Air Pollution Control System Industry Revenue (billion), by Country 2025 & 2033
- Figure 13: Asia Pacific Air Pollution Control System Industry Revenue Share (%), by Country 2025 & 2033
- Figure 14: Europe Air Pollution Control System Industry Revenue (billion), by Application 2025 & 2033
- Figure 15: Europe Air Pollution Control System Industry Revenue Share (%), by Application 2025 & 2033
- Figure 16: Europe Air Pollution Control System Industry Revenue (billion), by Type 2025 & 2033
- Figure 17: Europe Air Pollution Control System Industry Revenue Share (%), by Type 2025 & 2033
- Figure 18: Europe Air Pollution Control System Industry Revenue (billion), by Country 2025 & 2033
- Figure 19: Europe Air Pollution Control System Industry Revenue Share (%), by Country 2025 & 2033
- Figure 20: South America Air Pollution Control System Industry Revenue (billion), by Application 2025 & 2033
- Figure 21: South America Air Pollution Control System Industry Revenue Share (%), by Application 2025 & 2033
- Figure 22: South America Air Pollution Control System Industry Revenue (billion), by Type 2025 & 2033
- Figure 23: South America Air Pollution Control System Industry Revenue Share (%), by Type 2025 & 2033
- Figure 24: South America Air Pollution Control System Industry Revenue (billion), by Country 2025 & 2033
- Figure 25: South America Air Pollution Control System Industry Revenue Share (%), by Country 2025 & 2033
- Figure 26: Middle East and Africa Air Pollution Control System Industry Revenue (billion), by Application 2025 & 2033
- Figure 27: Middle East and Africa Air Pollution Control System Industry Revenue Share (%), by Application 2025 & 2033
- Figure 28: Middle East and Africa Air Pollution Control System Industry Revenue (billion), by Type 2025 & 2033
- Figure 29: Middle East and Africa Air Pollution Control System Industry Revenue Share (%), by Type 2025 & 2033
- Figure 30: Middle East and Africa Air Pollution Control System Industry Revenue (billion), by Country 2025 & 2033
- Figure 31: Middle East and Africa Air Pollution Control System Industry Revenue Share (%), by Country 2025 & 2033
List of Tables
- Table 1: Global Air Pollution Control System Industry Revenue billion Forecast, by Application 2020 & 2033
- Table 2: Global Air Pollution Control System Industry Revenue billion Forecast, by Type 2020 & 2033
- Table 3: Global Air Pollution Control System Industry Revenue billion Forecast, by Region 2020 & 2033
- Table 4: Global Air Pollution Control System Industry Revenue billion Forecast, by Application 2020 & 2033
- Table 5: Global Air Pollution Control System Industry Revenue billion Forecast, by Type 2020 & 2033
- Table 6: Global Air Pollution Control System Industry Revenue billion Forecast, by Country 2020 & 2033
- Table 7: United States Air Pollution Control System Industry Revenue (billion) Forecast, by Application 2020 & 2033
- Table 8: Canada Air Pollution Control System Industry Revenue (billion) Forecast, by Application 2020 & 2033
- Table 9: Rest of North America Air Pollution Control System Industry Revenue (billion) Forecast, by Application 2020 & 2033
- Table 10: Global Air Pollution Control System Industry Revenue billion Forecast, by Application 2020 & 2033
- Table 11: Global Air Pollution Control System Industry Revenue billion Forecast, by Type 2020 & 2033
- Table 12: Global Air Pollution Control System Industry Revenue billion Forecast, by Country 2020 & 2033
- Table 13: India Air Pollution Control System Industry Revenue (billion) Forecast, by Application 2020 & 2033
- Table 14: China Air Pollution Control System Industry Revenue (billion) Forecast, by Application 2020 & 2033
- Table 15: Japan Air Pollution Control System Industry Revenue (billion) Forecast, by Application 2020 & 2033
- Table 16: Australia Air Pollution Control System Industry Revenue (billion) Forecast, by Application 2020 & 2033
- Table 17: Rest of Asia Pacific Air Pollution Control System Industry Revenue (billion) Forecast, by Application 2020 & 2033
- Table 18: Global Air Pollution Control System Industry Revenue billion Forecast, by Application 2020 & 2033
- Table 19: Global Air Pollution Control System Industry Revenue billion Forecast, by Type 2020 & 2033
- Table 20: Global Air Pollution Control System Industry Revenue billion Forecast, by Country 2020 & 2033
- Table 21: Germany Air Pollution Control System Industry Revenue (billion) Forecast, by Application 2020 & 2033
- Table 22: France Air Pollution Control System Industry Revenue (billion) Forecast, by Application 2020 & 2033
- Table 23: United Kingdom Air Pollution Control System Industry Revenue (billion) Forecast, by Application 2020 & 2033
- Table 24: Italy Air Pollution Control System Industry Revenue (billion) Forecast, by Application 2020 & 2033
- Table 25: Rest of Europe Air Pollution Control System Industry Revenue (billion) Forecast, by Application 2020 & 2033
- Table 26: Global Air Pollution Control System Industry Revenue billion Forecast, by Application 2020 & 2033
- Table 27: Global Air Pollution Control System Industry Revenue billion Forecast, by Type 2020 & 2033
- Table 28: Global Air Pollution Control System Industry Revenue billion Forecast, by Country 2020 & 2033
- Table 29: Brazil Air Pollution Control System Industry Revenue (billion) Forecast, by Application 2020 & 2033
- Table 30: Argentina Air Pollution Control System Industry Revenue (billion) Forecast, by Application 2020 & 2033
- Table 31: Chile Air Pollution Control System Industry Revenue (billion) Forecast, by Application 2020 & 2033
- Table 32: Rest of South America Air Pollution Control System Industry Revenue (billion) Forecast, by Application 2020 & 2033
- Table 33: Global Air Pollution Control System Industry Revenue billion Forecast, by Application 2020 & 2033
- Table 34: Global Air Pollution Control System Industry Revenue billion Forecast, by Type 2020 & 2033
- Table 35: Global Air Pollution Control System Industry Revenue billion Forecast, by Country 2020 & 2033
- Table 36: Saudi Arabia Air Pollution Control System Industry Revenue (billion) Forecast, by Application 2020 & 2033
- Table 37: South Africa Air Pollution Control System Industry Revenue (billion) Forecast, by Application 2020 & 2033
- Table 38: Algeria Air Pollution Control System Industry Revenue (billion) Forecast, by Application 2020 & 2033
- Table 39: Rest of Middle East and Africa Air Pollution Control System Industry Revenue (billion) Forecast, by Application 2020 & 2033
Frequently Asked Questions
1. What is the projected Compound Annual Growth Rate (CAGR) of the Air Pollution Control System Industry?
The projected CAGR is approximately 6.3%.
2. Which companies are prominent players in the Air Pollution Control System Industry?
Key companies in the market include Thermax Ltd, Pure Air Solutions, Gea Bischoff, General Electric, Ducon Technologies Inc, Horiba Ltd, Hamon Corporation, Andritz Ag, Siemens AG, Mitsubishi Hitachi Power Systems Ltd, Calgon Carbon Corporation, Fujian Longking Co Ltd, Babcock & Wilcox Enterprises Inc, Tri-mer, Amec Foster Wheeler, Esco International.
3. What are the main segments of the Air Pollution Control System Industry?
The market segments include Application, Type.
4. Can you provide details about the market size?
The market size is estimated to be USD 103.66 billion as of 2022.
5. What are some drivers contributing to market growth?
4.; Increasing Amount of Waste Generation. Growing Concern for Waste Management to Meet the Needs for Sustainable Urban Living4.; Increasing Focus on Non-fossil Fuel Sources of Energy.
6. What are the notable trends driving market growth?
Increasing Demand from Power Generation Industry.
7. Are there any restraints impacting market growth?
4.; Expensive Nature of Incinerators.
8. Can you provide examples of recent developments in the market?
N/A
9. What pricing options are available for accessing the report?
Pricing options include single-user, multi-user, and enterprise licenses priced at USD 4750, USD 5250, and USD 8750 respectively.
10. Is the market size provided in terms of value or volume?
The market size is provided in terms of value, measured in billion.
11. Are there any specific market keywords associated with the report?
Yes, the market keyword associated with the report is "Air Pollution Control System Industry," which aids in identifying and referencing the specific market segment covered.
12. How do I determine which pricing option suits my needs best?
The pricing options vary based on user requirements and access needs. Individual users may opt for single-user licenses, while businesses requiring broader access may choose multi-user or enterprise licenses for cost-effective access to the report.
13. Are there any additional resources or data provided in the Air Pollution Control System Industry report?
While the report offers comprehensive insights, it's advisable to review the specific contents or supplementary materials provided to ascertain if additional resources or data are available.
14. How can I stay updated on further developments or reports in the Air Pollution Control System Industry?
To stay informed about further developments, trends, and reports in the Air Pollution Control System Industry, consider subscribing to industry newsletters, following relevant companies and organizations, or regularly checking reputable industry news sources and publications.
Methodology
Step 1 - Identification of Relevant Samples Size from Population Database


Step 2 - Approaches for Defining Global Market Size (Value, Volume* & Price*)

Note*: In applicable scenarios
Step 3 - Data Sources
Primary Research
- Web Analytics
- Survey Reports
- Research Institute
- Latest Research Reports
- Opinion Leaders
Secondary Research
- Annual Reports
- White Paper
- Latest Press Release
- Industry Association
- Paid Database
- Investor Presentations

Step 4 - Data Triangulation
Involves using different sources of information in order to increase the validity of a study
These sources are likely to be stakeholders in a program - participants, other researchers, program staff, other community members, and so on.
Then we put all data in single framework & apply various statistical tools to find out the dynamic on the market.
During the analysis stage, feedback from the stakeholder groups would be compared to determine areas of agreement as well as areas of divergence