

Key Insights
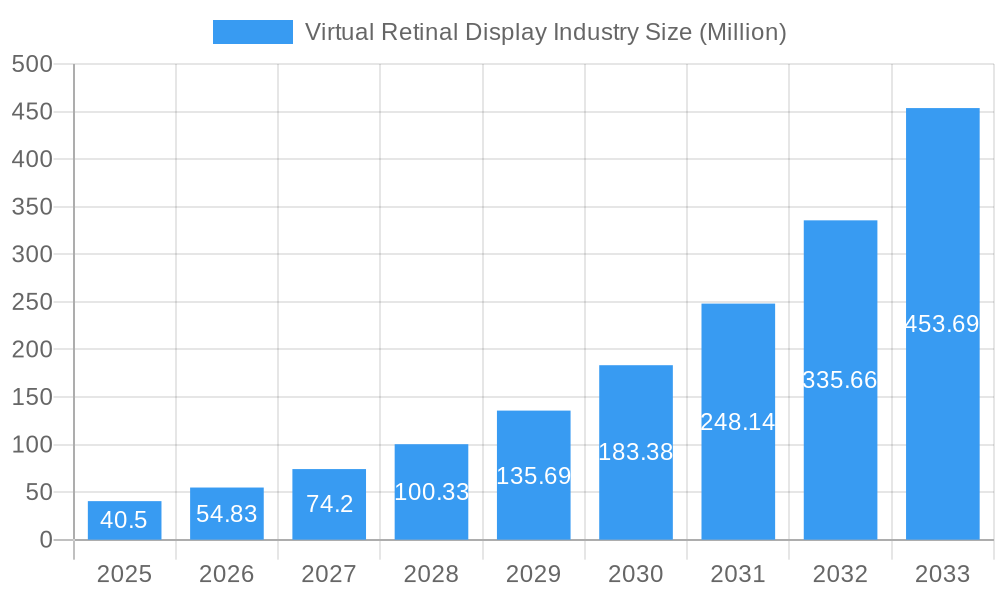
The Virtual Retinal Display (VRD) industry is poised for explosive growth, driven by its revolutionary approach to visual interfaces. With an estimated market size of $40.5 million in 2025, the sector is projected to experience a remarkable 35.5% CAGR from 2019 to 2033. This significant expansion is fueled by the inherent advantages of VRD technology, including its ability to deliver exceptionally sharp, high-resolution images directly onto the retina, offering unparalleled clarity and immersion. Key drivers include the burgeoning demand for advanced augmented reality (AR) and virtual reality (VR) experiences across various sectors, the miniaturization of display components enabling more compact and wearable devices, and continuous innovation in optical engine technology. The medical and life sciences sector is a prominent beneficiary, leveraging VRD for surgical visualization, training simulations, and diagnostic tools. Similarly, the aerospace and defense industries are adopting VRD for sophisticated pilot training and heads-up displays, while media and entertainment are exploring its potential for deeply immersive gaming and cinematic experiences.
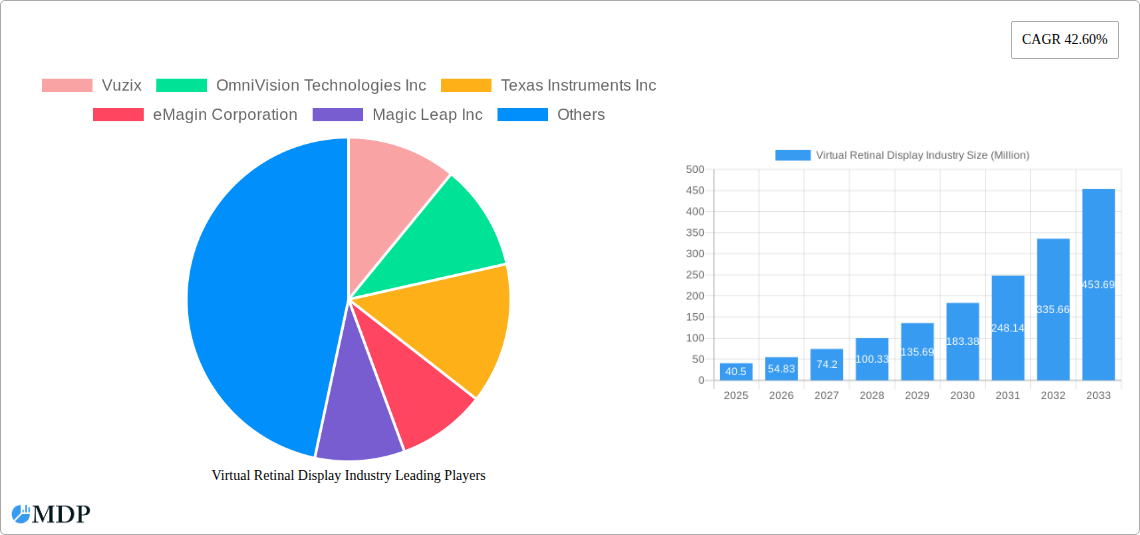
Virtual Retinal Display Industry Market Size (In Million)
The trajectory of the VRD market is characterized by several compelling trends. The development of lighter, more ergonomic headsets is making VRD-powered devices more accessible and comfortable for extended use. Furthermore, advancements in micro-LED and laser projection technologies are enhancing brightness, color accuracy, and power efficiency. The increasing integration of eye-tracking and gesture recognition within VRD systems promises to create more intuitive and interactive user experiences. Despite the bright outlook, certain restraints exist, such as the high cost of manufacturing specialized micro-display components and the need for further standardization to ensure interoperability across different platforms. However, ongoing research and development, coupled with increasing investment from major technology players, are steadily mitigating these challenges, paving the way for widespread adoption of Virtual Retinal Display technology.
Virtual Retinal Display Industry Company Market Share
Unlock the potential of the cutting-edge Virtual Retinal Display (VRD) market with this comprehensive industry report. Covering the historical period of 2019–2024 and projecting forward to 2033, with a base and estimated year of 2025, this analysis offers deep insights into a sector poised for exponential growth. Explore market dynamics, technological advancements, leading players, and emerging opportunities within the Virtual Retinal Display industry. This report is essential for investors, developers, and stakeholders seeking to capitalize on the burgeoning augmented reality (AR), virtual reality (VR), and extended reality (XR) landscape.
Virtual Retinal Display Industry Market Dynamics & Concentration
The Virtual Retinal Display (VRD) industry exhibits a dynamic and evolving market concentration, driven by significant innovation and substantial investment. While early-stage development saw a more fragmented landscape, recent years have witnessed increasing consolidation as key players invest heavily in proprietary technologies and seek strategic acquisitions to gain market share. The innovation drivers are primarily centered on achieving higher pixel density (PPD), wider field of view (FOV), reduced form factors, lower power consumption, and enhanced color accuracy. Regulatory frameworks are still nascent, but evolving standards for eye safety and data privacy will shape market entry and product development. Product substitutes, while present in the form of traditional displays and other near-eye technologies, are increasingly being outpaced by the immersive and high-resolution capabilities of VRD. End-user trends indicate a strong shift towards immersive experiences in media and entertainment, coupled with critical advancements in medical and aerospace/defense applications. Mergers and acquisition (M&A) activities, though still relatively low in terms of deal count, are often high-value transactions as companies seek to secure critical intellectual property and talent. For instance, the acquisition of display technology companies by major tech giants highlights this trend. The market share is expected to consolidate further as technological maturity and economies of scale are achieved.
Virtual Retinal Display Industry Industry Trends & Analysis
The Virtual Retinal Display (VRD) industry is experiencing a remarkable growth trajectory, fueled by relentless technological disruptions and a burgeoning demand for immersive digital experiences. The compound annual growth rate (CAGR) is projected to be substantial, driven by advancements in microdisplay technology, laser projection systems, and sophisticated optics. Market penetration is steadily increasing across various sectors, from consumer electronics to specialized industrial applications. Key growth drivers include the escalating demand for realistic virtual and augmented reality experiences in gaming, entertainment, and professional training. The continuous pursuit of higher resolution, akin to "Retina" display standards, is a significant catalyst, with companies like Meta aiming for around 60 PPD. This push for photorealistic clarity pushes the boundaries of current display capabilities, stimulating further research and development. Technological disruptions, such as the development of ultra-high-resolution OLED microdisplays by companies like eMagin Corporation, are transforming the landscape. These displays, offering wide color gamut, high contrast, and small form factors, are perfectly suited for demanding applications. Consumer preferences are shifting towards more natural and less eye-straining visual interfaces, a core benefit of VRD technology. The competitive dynamics are intensifying, with established tech giants and innovative startups vying for dominance through strategic partnerships, intellectual property acquisition, and aggressive product roadmaps. The evolution from early prototypes demonstrating lower PPD and FOV to more advanced concepts showcasing increased visual fidelity underscores the rapid pace of innovation. The increasing adoption of VRD in simulation and training environments, particularly in sectors like aerospace and defense and medical, is another critical trend.
Leading Markets & Segments in Virtual Retinal Display Industry
The Medical & Lifesciences segment is emerging as a dominant force within the Virtual Retinal Display (VRD) industry, showcasing significant growth and adoption driven by its transformative potential in healthcare. This sector's dominance is underpinned by several key drivers, including the increasing need for precision in surgical procedures, advanced diagnostic tools, and immersive patient education. The pursuit of ultra-high resolution and accurate color reproduction, inherent to VRD technology, is critical for applications such as retinal surgery, diagnostic imaging, and medical training.
- Medical & Lifesciences:
- Key Drivers:
- Precision Surgery: VRD enables surgeons to visualize complex anatomy with unparalleled clarity, enhancing accuracy and reducing risks.
- Advanced Diagnostics: High-resolution displays facilitate more detailed interpretation of medical scans and images, leading to earlier and more accurate diagnoses.
- Medical Training & Simulation: Immersive VRD environments provide realistic training scenarios for medical professionals, improving skill acquisition and patient safety.
- Ophthalmology Applications: VRD is particularly suited for ophthalmological applications, including diagnosis, treatment planning, and even direct retinal visualization during procedures, as highlighted by eMagin Corporation's focus.
- Telemedicine Enhancement: Enhanced visual feedback through VRD can improve remote consultations and collaborative diagnostics.
- Dominance Analysis: The critical nature of visual accuracy and the potential for life-saving applications position Medical & Lifesciences as a leading adopter. The substantial investment in healthcare R&D and the ongoing quest for improved patient outcomes further solidify VRD's importance in this sector. The ability of VRD to project images directly onto the retina offers a unique advantage in specific medical contexts, overcoming limitations of traditional display technologies.
- Key Drivers:
The Aerospace and Defense sector also presents a robust market for VRD technology, driven by the demand for advanced situational awareness and training solutions. High-fidelity visual displays are crucial for pilots, navigators, and ground personnel, providing an immersive and detailed view of their operational environment. The ability of VRD to overlay critical information directly into a user's field of view without obstructing their vision makes it invaluable for complex missions. Economic policies that prioritize national security and technological superiority further bolster investment in this segment.
The Media and Entertainment segment continues to be a significant growth area, with VRD promising to redefine immersive gaming, cinematic experiences, and interactive content consumption. As display resolution and field of view improve, the line between virtual and real worlds blurs, offering unprecedented levels of engagement for consumers.
Other End-user Verticals, including industrial design, engineering, education, and remote collaboration, are also increasingly exploring and adopting VRD for its potential to enhance productivity and provide novel ways of interacting with digital information.
Virtual Retinal Display Industry Product Developments
Recent product developments in the Virtual Retinal Display (VRD) industry are characterized by a relentless pursuit of higher fidelity and greater immersion. Innovations are focused on increasing pixel density, achieving wider fields of view, and reducing the size and power consumption of VRD systems. Key technological trends include the advancement of OLED microdisplays offering superior contrast and color accuracy, as well as improvements in laser projection technology for direct retinal imaging. These advancements are leading to more compact, lightweight, and visually compelling VRD devices that are better suited for extended wear and a wider range of applications, from medical diagnostics to next-generation gaming and AR overlays. The competitive advantage lies in delivering an unparalleled visual experience that closely mimics natural vision.
Key Drivers of Virtual Retinal Display Industry Growth
The Virtual Retinal Display (VRD) industry's growth is propelled by several interconnected factors. Technological Advancements are paramount, particularly in microdisplay resolution (PPD) and field of view, driven by the pursuit of photorealistic virtual experiences. The increasing demand for immersive VR and AR applications across gaming, entertainment, and professional training fuels market adoption. Furthermore, the growing adoption of VRD in specialized sectors like medical and aerospace/defense, where precision and detailed visualization are critical, acts as a significant growth accelerator. Government initiatives and funding for advanced display technologies also play a role.
Challenges in the Virtual Retinal Display Industry Market
Despite its immense potential, the Virtual Retinal Display (VRD) industry faces several significant challenges. High development and manufacturing costs for advanced microdisplays and optical components currently limit widespread consumer adoption. Technological limitations, such as achieving a wide field of view without compromising resolution or causing visual discomfort, remain a hurdle. Regulatory hurdles related to eye safety and long-term usage are still being defined. Supply chain complexities for specialized components can also impact production volumes and pricing. Furthermore, competition from established display technologies and the need for compelling content to justify investment pose ongoing challenges.
Emerging Opportunities in Virtual Retinal Display Industry
The Virtual Retinal Display (VRD) industry is ripe with emerging opportunities that promise to unlock new markets and drive long-term growth. Technological breakthroughs in areas like meta-lenses and holographic displays are expected to further miniaturize VRD devices and enhance their optical performance. Strategic partnerships between display manufacturers, chip designers, and content creators are crucial for developing integrated solutions and expanding the VRD ecosystem. Market expansion into new verticals, such as remote collaboration tools, industrial inspection, and accessibility solutions for visually impaired individuals, presents significant untapped potential. The ongoing evolution of AR/VR hardware and software will create a continuous demand for higher-fidelity visual displays.
Leading Players in the Virtual Retinal Display Industry Sector
- Vuzix
- OmniVision Technologies Inc
- Texas Instruments Inc
- eMagin Corporation
- Magic Leap Inc
- Optivent
- Human Interface Technology Laboratory
- Avegant Corporation
- Movidius Inc (Intel Corporation)
- QD Laser Co Ltd
- Analogix Semiconductor Inc
- Himax Technologies Inc
Key Milestones in Virtual Retinal Display Industry Industry
- December 2022: Meta confirms plans to develop a Retina-resolution VR headset, aiming for 60 PPD, a significant increase from Quest 2's 20 PPD and Quest Pro's 22 PPD. This highlights the industry's push towards photorealistic visual fidelity.
- December 2022: eMagin Corporation announces participation at the 10th International Congress on OCT and OCT Angiography, showcasing its high-resolution OLED microdisplays ideal for medical applications, including ophthalmology for retinal surgery and diagnosis. This underscores VRD's critical role in advanced healthcare.
- Summer (2022 implied): Display researchers present the Butterscotch prototype, achieving 55 PPD but with half the field of view of Meta Quest 2. This demonstrates ongoing progress in increasing pixel density, albeit with trade-offs in other performance metrics.
Strategic Outlook for Virtual Retinal Display Industry Market
The strategic outlook for the Virtual Retinal Display (VRD) industry is overwhelmingly positive, driven by continuous innovation and expanding application frontiers. Future market potential lies in achieving seamless integration of digital information with the physical world, leading to enhanced productivity and immersive entertainment. Growth accelerators include the development of more affordable and accessible VRD devices, the creation of compelling content ecosystems, and the standardization of interoperability between different platforms. Strategic opportunities lie in forging cross-industry collaborations to unlock novel use cases and in leveraging advancements in artificial intelligence to enhance VRD experiences. The market is poised for significant expansion as the technology matures and its tangible benefits become increasingly evident across diverse sectors.
Virtual Retinal Display Industry Segmentation
-
1. End-user Industry
- 1.1. Medical & Lifesciences
- 1.2. Aerospace and Defense
- 1.3. Media and Entertainment
- 1.4. Other End-user Verticals
Virtual Retinal Display Industry Segmentation By Geography
- 1. North America
- 2. Europe
- 3. Asia Pacific
- 4. Latin America
- 5. Middle East
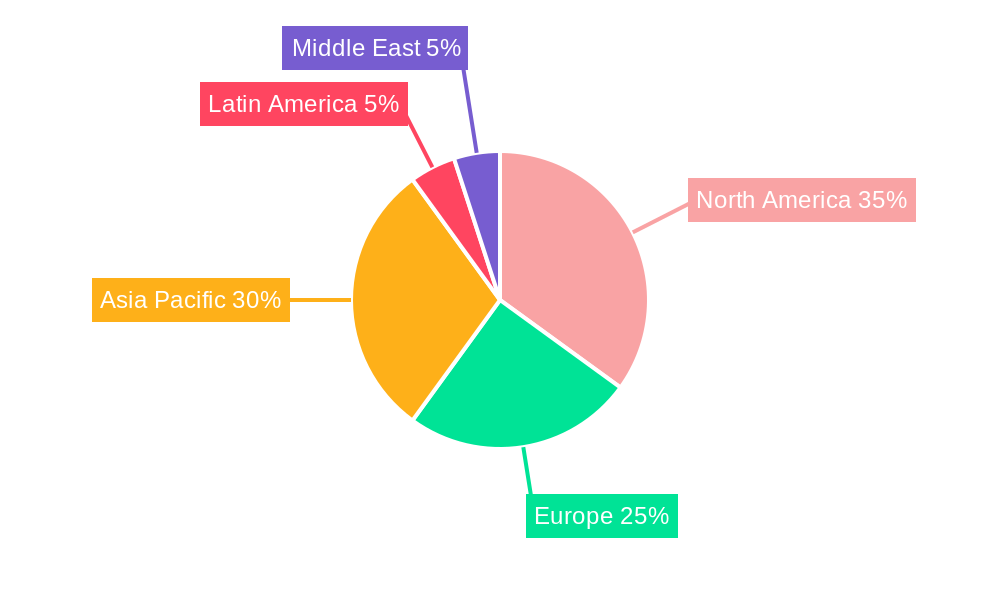
Virtual Retinal Display Industry Regional Market Share
Geographic Coverage of Virtual Retinal Display Industry
Virtual Retinal Display Industry REPORT HIGHLIGHTS
| Aspects | Details |
|---|---|
| Study Period | 2020-2034 |
| Base Year | 2025 |
| Estimated Year | 2026 |
| Forecast Period | 2026-2034 |
| Historical Period | 2020-2025 |
| Growth Rate | CAGR of 39.3% from 2020-2034 |
| Segmentation |
|
Table of Contents
- 1. Introduction
- 1.1. Research Scope
- 1.2. Market Segmentation
- 1.3. Research Objective
- 1.4. Definitions and Assumptions
- 2. Executive Summary
- 2.1. Market Snapshot
- 3. Market Dynamics
- 3.1. Market Drivers
- 3.2. Market Restrains
- 3.3. Market Trends
- 3.4. Market Opportunities
- 4. Market Factor Analysis
- 4.1. Porters Five Forces
- 4.1.1. Bargaining Power of Suppliers
- 4.1.2. Bargaining Power of Buyers
- 4.1.3. Threat of New Entrants
- 4.1.4. Threat of Substitutes
- 4.1.5. Competitive Rivalry
- 4.2. PESTEL analysis
- 4.3. BCG Analysis
- 4.3.1. Stars (High Growth, High Market Share)
- 4.3.2. Cash Cows (Low Growth, High Market Share)
- 4.3.3. Question Mark (High Growth, Low Market Share)
- 4.3.4. Dogs (Low Growth, Low Market Share)
- 4.4. Ansoff Matrix Analysis
- 4.5. Supply Chain Analysis
- 4.6. Regulatory Landscape
- 4.7. Current Market Potential and Opportunity Assessment (TAM–SAM–SOM Framework)
- 4.8. MDP Analyst Note
- 4.1. Porters Five Forces
- 5. Market Analysis, Insights and Forecast 2021-2033
- 5.1. Market Analysis, Insights and Forecast - by End-user Industry
- 5.1.1. Medical & Lifesciences
- 5.1.2. Aerospace and Defense
- 5.1.3. Media and Entertainment
- 5.1.4. Other End-user Verticals
- 5.2. Market Analysis, Insights and Forecast - by Region
- 5.2.1. North America
- 5.2.2. Europe
- 5.2.3. Asia Pacific
- 5.2.4. Latin America
- 5.2.5. Middle East
- 5.1. Market Analysis, Insights and Forecast - by End-user Industry
- 6. Global Virtual Retinal Display Industry Analysis, Insights and Forecast, 2021-2033
- 6.1. Market Analysis, Insights and Forecast - by End-user Industry
- 6.1.1. Medical & Lifesciences
- 6.1.2. Aerospace and Defense
- 6.1.3. Media and Entertainment
- 6.1.4. Other End-user Verticals
- 6.1. Market Analysis, Insights and Forecast - by End-user Industry
- 7. North America Virtual Retinal Display Industry Analysis, Insights and Forecast, 2020-2032
- 7.1. Market Analysis, Insights and Forecast - by End-user Industry
- 7.1.1. Medical & Lifesciences
- 7.1.2. Aerospace and Defense
- 7.1.3. Media and Entertainment
- 7.1.4. Other End-user Verticals
- 7.1. Market Analysis, Insights and Forecast - by End-user Industry
- 8. Europe Virtual Retinal Display Industry Analysis, Insights and Forecast, 2020-2032
- 8.1. Market Analysis, Insights and Forecast - by End-user Industry
- 8.1.1. Medical & Lifesciences
- 8.1.2. Aerospace and Defense
- 8.1.3. Media and Entertainment
- 8.1.4. Other End-user Verticals
- 8.1. Market Analysis, Insights and Forecast - by End-user Industry
- 9. Asia Pacific Virtual Retinal Display Industry Analysis, Insights and Forecast, 2020-2032
- 9.1. Market Analysis, Insights and Forecast - by End-user Industry
- 9.1.1. Medical & Lifesciences
- 9.1.2. Aerospace and Defense
- 9.1.3. Media and Entertainment
- 9.1.4. Other End-user Verticals
- 9.1. Market Analysis, Insights and Forecast - by End-user Industry
- 10. Latin America Virtual Retinal Display Industry Analysis, Insights and Forecast, 2020-2032
- 10.1. Market Analysis, Insights and Forecast - by End-user Industry
- 10.1.1. Medical & Lifesciences
- 10.1.2. Aerospace and Defense
- 10.1.3. Media and Entertainment
- 10.1.4. Other End-user Verticals
- 10.1. Market Analysis, Insights and Forecast - by End-user Industry
- 11. Middle East Virtual Retinal Display Industry Analysis, Insights and Forecast, 2020-2032
- 11.1. Market Analysis, Insights and Forecast - by End-user Industry
- 11.1.1. Medical & Lifesciences
- 11.1.2. Aerospace and Defense
- 11.1.3. Media and Entertainment
- 11.1.4. Other End-user Verticals
- 11.1. Market Analysis, Insights and Forecast - by End-user Industry
- 12. Competitive Analysis
- 12.1. Company Profiles
- 12.1.1 Vuzix
- 12.1.1.1. Company Overview
- 12.1.1.2. Products
- 12.1.1.3. Company Financials
- 12.1.1.4. SWOT Analysis
- 12.1.2 OmniVision Technologies Inc
- 12.1.2.1. Company Overview
- 12.1.2.2. Products
- 12.1.2.3. Company Financials
- 12.1.2.4. SWOT Analysis
- 12.1.3 Texas Instruments Inc
- 12.1.3.1. Company Overview
- 12.1.3.2. Products
- 12.1.3.3. Company Financials
- 12.1.3.4. SWOT Analysis
- 12.1.4 eMagin Corporation
- 12.1.4.1. Company Overview
- 12.1.4.2. Products
- 12.1.4.3. Company Financials
- 12.1.4.4. SWOT Analysis
- 12.1.5 Magic Leap Inc
- 12.1.5.1. Company Overview
- 12.1.5.2. Products
- 12.1.5.3. Company Financials
- 12.1.5.4. SWOT Analysis
- 12.1.6 Optivent
- 12.1.6.1. Company Overview
- 12.1.6.2. Products
- 12.1.6.3. Company Financials
- 12.1.6.4. SWOT Analysis
- 12.1.7 Human Interface Technology Laboratory
- 12.1.7.1. Company Overview
- 12.1.7.2. Products
- 12.1.7.3. Company Financials
- 12.1.7.4. SWOT Analysis
- 12.1.8 Avegant Corporation
- 12.1.8.1. Company Overview
- 12.1.8.2. Products
- 12.1.8.3. Company Financials
- 12.1.8.4. SWOT Analysis
- 12.1.9 Movidius Inc (Intel Corporation)
- 12.1.9.1. Company Overview
- 12.1.9.2. Products
- 12.1.9.3. Company Financials
- 12.1.9.4. SWOT Analysis
- 12.1.10 QD Laser Co Ltd
- 12.1.10.1. Company Overview
- 12.1.10.2. Products
- 12.1.10.3. Company Financials
- 12.1.10.4. SWOT Analysis
- 12.1.11 Analogix Semiconductor Inc
- 12.1.11.1. Company Overview
- 12.1.11.2. Products
- 12.1.11.3. Company Financials
- 12.1.11.4. SWOT Analysis
- 12.1.12 Himax Technologies Inc
- 12.1.12.1. Company Overview
- 12.1.12.2. Products
- 12.1.12.3. Company Financials
- 12.1.12.4. SWOT Analysis
- 12.1.1 Vuzix
- 12.2. Market Entropy
- 12.2.1 Company's Key Areas Served
- 12.2.2 Recent Developments
- 12.3. Company Market Share Analysis 2025
- 12.3.1 Top 5 Companies Market Share Analysis
- 12.3.2 Top 3 Companies Market Share Analysis
- 12.4. List of Potential Customers
- 13. Research Methodology
List of Figures
- Figure 1: Global Virtual Retinal Display Industry Revenue Breakdown (billion, %) by Region 2025 & 2033
- Figure 2: Global Virtual Retinal Display Industry Volume Breakdown (K Unit, %) by Region 2025 & 2033
- Figure 3: North America Virtual Retinal Display Industry Revenue (billion), by End-user Industry 2025 & 2033
- Figure 4: North America Virtual Retinal Display Industry Volume (K Unit), by End-user Industry 2025 & 2033
- Figure 5: North America Virtual Retinal Display Industry Revenue Share (%), by End-user Industry 2025 & 2033
- Figure 6: North America Virtual Retinal Display Industry Volume Share (%), by End-user Industry 2025 & 2033
- Figure 7: North America Virtual Retinal Display Industry Revenue (billion), by Country 2025 & 2033
- Figure 8: North America Virtual Retinal Display Industry Volume (K Unit), by Country 2025 & 2033
- Figure 9: North America Virtual Retinal Display Industry Revenue Share (%), by Country 2025 & 2033
- Figure 10: North America Virtual Retinal Display Industry Volume Share (%), by Country 2025 & 2033
- Figure 11: Europe Virtual Retinal Display Industry Revenue (billion), by End-user Industry 2025 & 2033
- Figure 12: Europe Virtual Retinal Display Industry Volume (K Unit), by End-user Industry 2025 & 2033
- Figure 13: Europe Virtual Retinal Display Industry Revenue Share (%), by End-user Industry 2025 & 2033
- Figure 14: Europe Virtual Retinal Display Industry Volume Share (%), by End-user Industry 2025 & 2033
- Figure 15: Europe Virtual Retinal Display Industry Revenue (billion), by Country 2025 & 2033
- Figure 16: Europe Virtual Retinal Display Industry Volume (K Unit), by Country 2025 & 2033
- Figure 17: Europe Virtual Retinal Display Industry Revenue Share (%), by Country 2025 & 2033
- Figure 18: Europe Virtual Retinal Display Industry Volume Share (%), by Country 2025 & 2033
- Figure 19: Asia Pacific Virtual Retinal Display Industry Revenue (billion), by End-user Industry 2025 & 2033
- Figure 20: Asia Pacific Virtual Retinal Display Industry Volume (K Unit), by End-user Industry 2025 & 2033
- Figure 21: Asia Pacific Virtual Retinal Display Industry Revenue Share (%), by End-user Industry 2025 & 2033
- Figure 22: Asia Pacific Virtual Retinal Display Industry Volume Share (%), by End-user Industry 2025 & 2033
- Figure 23: Asia Pacific Virtual Retinal Display Industry Revenue (billion), by Country 2025 & 2033
- Figure 24: Asia Pacific Virtual Retinal Display Industry Volume (K Unit), by Country 2025 & 2033
- Figure 25: Asia Pacific Virtual Retinal Display Industry Revenue Share (%), by Country 2025 & 2033
- Figure 26: Asia Pacific Virtual Retinal Display Industry Volume Share (%), by Country 2025 & 2033
- Figure 27: Latin America Virtual Retinal Display Industry Revenue (billion), by End-user Industry 2025 & 2033
- Figure 28: Latin America Virtual Retinal Display Industry Volume (K Unit), by End-user Industry 2025 & 2033
- Figure 29: Latin America Virtual Retinal Display Industry Revenue Share (%), by End-user Industry 2025 & 2033
- Figure 30: Latin America Virtual Retinal Display Industry Volume Share (%), by End-user Industry 2025 & 2033
- Figure 31: Latin America Virtual Retinal Display Industry Revenue (billion), by Country 2025 & 2033
- Figure 32: Latin America Virtual Retinal Display Industry Volume (K Unit), by Country 2025 & 2033
- Figure 33: Latin America Virtual Retinal Display Industry Revenue Share (%), by Country 2025 & 2033
- Figure 34: Latin America Virtual Retinal Display Industry Volume Share (%), by Country 2025 & 2033
- Figure 35: Middle East Virtual Retinal Display Industry Revenue (billion), by End-user Industry 2025 & 2033
- Figure 36: Middle East Virtual Retinal Display Industry Volume (K Unit), by End-user Industry 2025 & 2033
- Figure 37: Middle East Virtual Retinal Display Industry Revenue Share (%), by End-user Industry 2025 & 2033
- Figure 38: Middle East Virtual Retinal Display Industry Volume Share (%), by End-user Industry 2025 & 2033
- Figure 39: Middle East Virtual Retinal Display Industry Revenue (billion), by Country 2025 & 2033
- Figure 40: Middle East Virtual Retinal Display Industry Volume (K Unit), by Country 2025 & 2033
- Figure 41: Middle East Virtual Retinal Display Industry Revenue Share (%), by Country 2025 & 2033
- Figure 42: Middle East Virtual Retinal Display Industry Volume Share (%), by Country 2025 & 2033
List of Tables
- Table 1: Global Virtual Retinal Display Industry Revenue billion Forecast, by End-user Industry 2020 & 2033
- Table 2: Global Virtual Retinal Display Industry Volume K Unit Forecast, by End-user Industry 2020 & 2033
- Table 3: Global Virtual Retinal Display Industry Revenue billion Forecast, by Region 2020 & 2033
- Table 4: Global Virtual Retinal Display Industry Volume K Unit Forecast, by Region 2020 & 2033
- Table 5: Global Virtual Retinal Display Industry Revenue billion Forecast, by End-user Industry 2020 & 2033
- Table 6: Global Virtual Retinal Display Industry Volume K Unit Forecast, by End-user Industry 2020 & 2033
- Table 7: Global Virtual Retinal Display Industry Revenue billion Forecast, by Country 2020 & 2033
- Table 8: Global Virtual Retinal Display Industry Volume K Unit Forecast, by Country 2020 & 2033
- Table 9: Global Virtual Retinal Display Industry Revenue billion Forecast, by End-user Industry 2020 & 2033
- Table 10: Global Virtual Retinal Display Industry Volume K Unit Forecast, by End-user Industry 2020 & 2033
- Table 11: Global Virtual Retinal Display Industry Revenue billion Forecast, by Country 2020 & 2033
- Table 12: Global Virtual Retinal Display Industry Volume K Unit Forecast, by Country 2020 & 2033
- Table 13: Global Virtual Retinal Display Industry Revenue billion Forecast, by End-user Industry 2020 & 2033
- Table 14: Global Virtual Retinal Display Industry Volume K Unit Forecast, by End-user Industry 2020 & 2033
- Table 15: Global Virtual Retinal Display Industry Revenue billion Forecast, by Country 2020 & 2033
- Table 16: Global Virtual Retinal Display Industry Volume K Unit Forecast, by Country 2020 & 2033
- Table 17: Global Virtual Retinal Display Industry Revenue billion Forecast, by End-user Industry 2020 & 2033
- Table 18: Global Virtual Retinal Display Industry Volume K Unit Forecast, by End-user Industry 2020 & 2033
- Table 19: Global Virtual Retinal Display Industry Revenue billion Forecast, by Country 2020 & 2033
- Table 20: Global Virtual Retinal Display Industry Volume K Unit Forecast, by Country 2020 & 2033
- Table 21: Global Virtual Retinal Display Industry Revenue billion Forecast, by End-user Industry 2020 & 2033
- Table 22: Global Virtual Retinal Display Industry Volume K Unit Forecast, by End-user Industry 2020 & 2033
- Table 23: Global Virtual Retinal Display Industry Revenue billion Forecast, by Country 2020 & 2033
- Table 24: Global Virtual Retinal Display Industry Volume K Unit Forecast, by Country 2020 & 2033
Frequently Asked Questions
1. What is the projected Compound Annual Growth Rate (CAGR) of the Virtual Retinal Display Industry?
The projected CAGR is approximately 39.3%.
2. Which companies are prominent players in the Virtual Retinal Display Industry?
Key companies in the market include Vuzix, OmniVision Technologies Inc, Texas Instruments Inc, eMagin Corporation, Magic Leap Inc, Optivent, Human Interface Technology Laboratory, Avegant Corporation, Movidius Inc (Intel Corporation), QD Laser Co Ltd, Analogix Semiconductor Inc, Himax Technologies Inc.
3. What are the main segments of the Virtual Retinal Display Industry?
The market segments include End-user Industry.
4. Can you provide details about the market size?
The market size is estimated to be USD 3.41 billion as of 2022.
5. What are some drivers contributing to market growth?
Technical Advantages Over Screen-Based Devices.
6. What are the notable trends driving market growth?
Virtual Reality and Augmented Reality are Gaining Surging Demand from the Entertainment Industry.
7. Are there any restraints impacting market growth?
Security Concerns Regarding Cloud-based Solutions.
8. Can you provide examples of recent developments in the market?
December 2022: Meta confirms that it plans to bring a Retina-resolution VR headset to product maturity. Quest Pro has ten percent more PPD than Meta Quest 2, according to Meta (22 vs. 20 PPD). The PPD value takes the screen and the optics into account and measures the number of pixels within 1° of the field of view. For comparison, the Retina's 'resolution' is around 60 PPD, which is also the value Meta is aiming In the summer, display researchers presented the Butterscotch prototype, which achieves 55 PPD, but only has half the field of view of Meta Quest 2.
9. What pricing options are available for accessing the report?
Pricing options include single-user, multi-user, and enterprise licenses priced at USD 4750, USD 5250, and USD 8750 respectively.
10. Is the market size provided in terms of value or volume?
The market size is provided in terms of value, measured in billion and volume, measured in K Unit.
11. Are there any specific market keywords associated with the report?
Yes, the market keyword associated with the report is "Virtual Retinal Display Industry," which aids in identifying and referencing the specific market segment covered.
12. How do I determine which pricing option suits my needs best?
The pricing options vary based on user requirements and access needs. Individual users may opt for single-user licenses, while businesses requiring broader access may choose multi-user or enterprise licenses for cost-effective access to the report.
13. Are there any additional resources or data provided in the Virtual Retinal Display Industry report?
While the report offers comprehensive insights, it's advisable to review the specific contents or supplementary materials provided to ascertain if additional resources or data are available.
14. How can I stay updated on further developments or reports in the Virtual Retinal Display Industry?
To stay informed about further developments, trends, and reports in the Virtual Retinal Display Industry, consider subscribing to industry newsletters, following relevant companies and organizations, or regularly checking reputable industry news sources and publications.
Methodology
Step 1 - Identification of Relevant Samples Size from Population Database


Step 2 - Approaches for Defining Global Market Size (Value, Volume* & Price*)

Note*: In applicable scenarios
Step 3 - Data Sources
Primary Research
- Web Analytics
- Survey Reports
- Research Institute
- Latest Research Reports
- Opinion Leaders
Secondary Research
- Annual Reports
- White Paper
- Latest Press Release
- Industry Association
- Paid Database
- Investor Presentations

Step 4 - Data Triangulation
Involves using different sources of information in order to increase the validity of a study
These sources are likely to be stakeholders in a program - participants, other researchers, program staff, other community members, and so on.
Then we put all data in single framework & apply various statistical tools to find out the dynamic on the market.
During the analysis stage, feedback from the stakeholder groups would be compared to determine areas of agreement as well as areas of divergence