

Key Insights
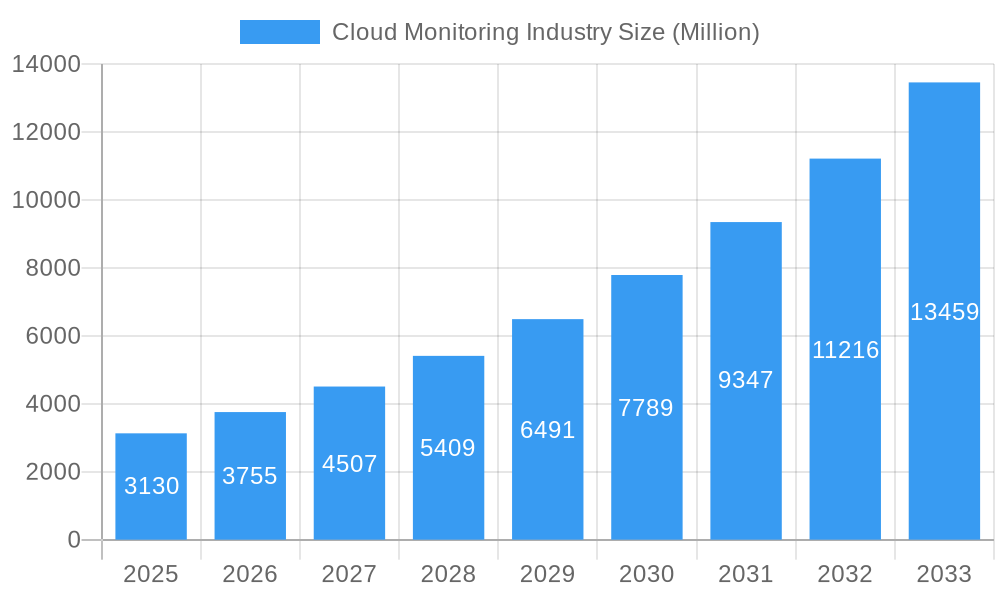
The global Cloud Monitoring market is poised for significant expansion, with a market size of approximately $3.13 billion in 2025. This robust growth is underpinned by an impressive Compound Annual Growth Rate (CAGR) of 19.91% projected over the forecast period of 2025-2033. This surge is primarily driven by the escalating adoption of cloud infrastructure across diverse industries, including BFSI, Retail, IT and Telecommunications, Healthcare, Government, and Manufacturing. The increasing complexity of cloud environments and the critical need for real-time performance insights, enhanced security, and optimized resource utilization are compelling organizations to invest heavily in sophisticated cloud monitoring solutions. The proliferation of hybrid and multi-cloud strategies further amplifies the demand for comprehensive tools that can provide unified visibility and control across disparate cloud platforms. This market dynamism presents substantial opportunities for vendors offering advanced analytics, AI-powered insights, and seamless integration capabilities.
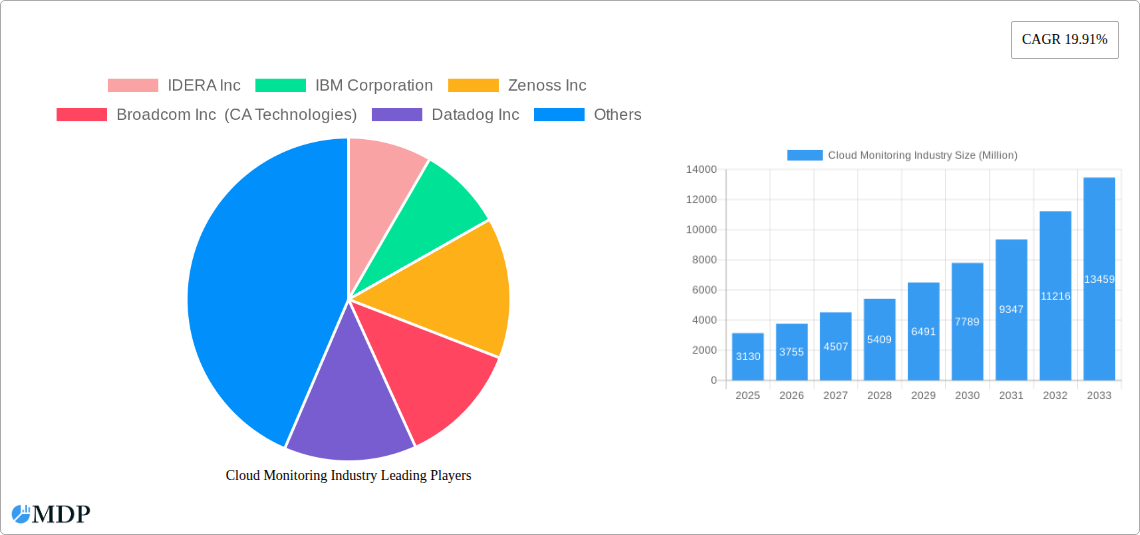
Cloud Monitoring Industry Market Size (In Billion)
Key trends shaping the cloud monitoring landscape include the evolution towards AIOps (Artificial Intelligence for IT Operations), which leverages machine learning to automate and enhance IT operations by predicting and resolving issues proactively. Furthermore, the growing emphasis on security and compliance necessitates robust monitoring solutions that can detect and respond to threats in real-time. While the market experiences strong tailwinds, potential restraints such as the high cost of advanced monitoring solutions and the need for skilled professionals to manage them could pose challenges. However, the overwhelming benefits of improved operational efficiency, reduced downtime, and enhanced customer experience are expected to outweigh these concerns, solidifying the upward trajectory of the cloud monitoring market. Emerging regions like Asia and Latin America are also anticipated to witness substantial growth as cloud adoption accelerates in these areas, contributing to the global market's overall expansion.
Cloud Monitoring Industry Company Market Share
Unveiling the Future of Cloud Operations: A Comprehensive Report on the Cloud Monitoring Industry (2019-2033)
This in-depth report provides an indispensable analysis of the global Cloud Monitoring Industry, offering critical insights into its market dynamics, growth trajectories, and the competitive landscape. With a study period spanning from 2019 to 2033 and a base year of 2025, this report leverages comprehensive data from the historical period (2019-2024) and projects future trends through to 2033. We delve into the intricate workings of cloud observability, application performance monitoring (APM), infrastructure monitoring, and SaaS monitoring, essential for optimizing cloud-native applications and ensuring robust cloud operations.
The Cloud Monitoring Market is experiencing unprecedented growth, driven by the increasing adoption of cloud computing across all sectors. This report is tailored for industry stakeholders, including IT professionals, cloud architects, solution providers, investors, and business leaders seeking to understand the critical factors shaping this dynamic market. Discover how IDERA Inc, IBM Corporation, Zenoss Inc, Broadcom Inc (CA Technologies), Datadog Inc, Microsoft Corporation, Oracle Corporation, AWS, LogicMonitor Inc and other key players are navigating the evolving demands for cloud infrastructure monitoring, performance management, and security monitoring.
Keywords: Cloud Monitoring Industry, Cloud Observability, Application Performance Monitoring (APM), Infrastructure Monitoring, SaaS Monitoring, Cloud Operations, IT Monitoring, Performance Management, Security Monitoring, Cloud Computing, IaaS, SaaS, PaaS, BFSI, Retail, IT and Telecommunications, Healthcare, Government, Manufacturing, AWS, Datadog, IBM, Oracle, Microsoft, LogicMonitor, Sumo Logic, Cisco AppDynamics, Market Analysis, Market Trends, Growth Drivers, Market Segmentation, Forecast.
Cloud Monitoring Industry Market Dynamics & Concentration
The Cloud Monitoring Industry is characterized by a moderate to high level of market concentration, with a few major players like Datadog Inc, Microsoft Corporation, and AWS holding significant market shares. However, the burgeoning demand for specialized cloud observability solutions fuels a dynamic competitive environment, fostering innovation. Key innovation drivers include the escalating complexity of cloud architectures, the rise of microservices and containerization, and the imperative for enhanced application performance and user experience. Regulatory frameworks, particularly around data privacy and compliance (e.g., GDPR, CCPA), are increasingly influencing monitoring strategies, necessitating robust security monitoring capabilities. Product substitutes, while existing in traditional monitoring tools, are rapidly becoming obsolete as cloud-native solutions offer superior scalability and integration. End-user trends overwhelmingly favor proactive monitoring and AIOps (Artificial Intelligence for IT Operations) to automate issue detection and resolution. Mergers and acquisitions (M&A) activity is a notable trend, as larger entities seek to expand their cloud monitoring portfolios or acquire innovative technologies. For instance, the acquisition of smaller specialized APM and infrastructure monitoring firms by established cloud providers is a recurring theme. With an estimated XX Million M&A deals recorded historically, this trend is expected to continue, further consolidating market share.
Cloud Monitoring Industry Industry Trends & Analysis
The Cloud Monitoring Industry is poised for exponential growth, projected to achieve a Compound Annual Growth Rate (CAGR) of approximately XX% over the forecast period of 2025–2033. This robust expansion is propelled by a confluence of technological advancements and evolving business needs. The increasing adoption of multi-cloud and hybrid cloud environments necessitates sophisticated, unified cloud monitoring solutions that can provide end-to-end visibility across disparate infrastructures. The proliferation of containers and microservices architectures, while offering agility, introduces new complexities in application performance monitoring and service discovery, thereby driving demand for specialized tools capable of handling dynamic environments. Furthermore, the growing emphasis on customer experience and digital transformation initiatives means that businesses are prioritizing real-time insights into application behavior and user journeys, making SaaS monitoring and APM indispensable. The integration of Artificial Intelligence (AI) and Machine Learning (ML) into monitoring platforms is a significant technological disruption, enabling predictive analytics, anomaly detection, and automated remediation, thereby moving the industry towards AIOps. Consumer preferences are shifting towards integrated platforms that offer comprehensive observability (logs, metrics, traces) rather than siloed monitoring tools. This includes a strong demand for user-friendly interfaces and actionable insights that empower IT teams to quickly identify and resolve issues before they impact end-users. Market penetration for advanced cloud monitoring solutions is still relatively low in certain emerging economies, presenting significant opportunities for growth. The competitive dynamics are intensifying, with established players continuously enhancing their offerings and new entrants focusing on niche areas like serverless monitoring or specialized industry compliance monitoring. The overall market penetration is estimated to reach XX% by 2033. The increasing adoption of cloud services across industries, from BFSI to Healthcare, underscores the universal need for effective cloud monitoring.
Leading Markets & Segments in Cloud Monitoring Industry
The IT and Telecommunications sector is the dominant end-user industry within the Cloud Monitoring Industry, driven by the inherently cloud-centric nature of its operations and the critical need for high availability and performance. Within this segment, the adoption of SaaS models for monitoring solutions is particularly strong, accounting for an estimated XX% of the market share. The IaaS and PaaS models also represent significant market segments, with organizations increasingly relying on these foundational cloud services and requiring robust monitoring for their underlying infrastructure.
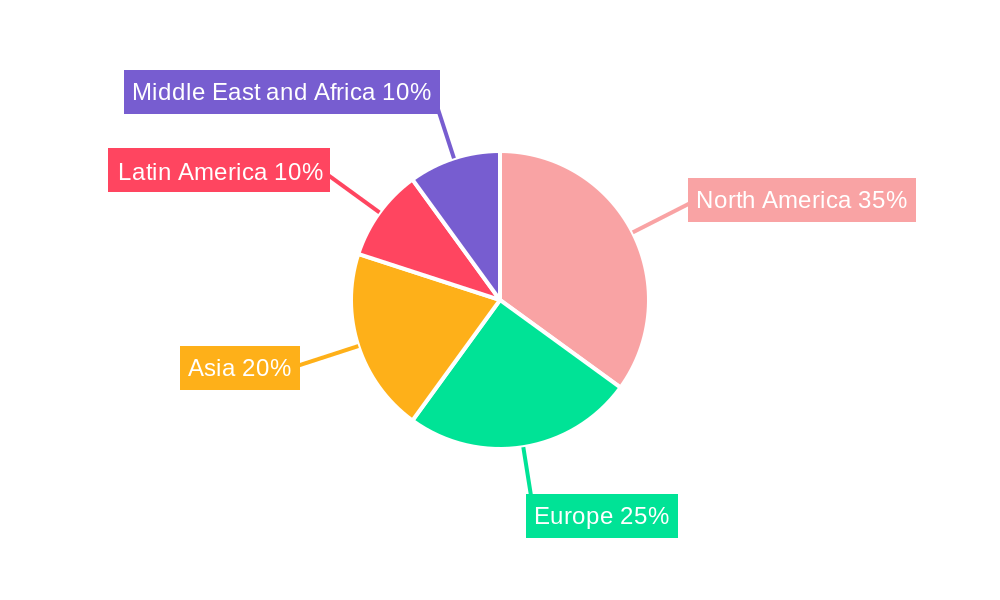
Dominant Region: North America currently leads the global Cloud Monitoring Industry, largely due to its advanced technological infrastructure, high cloud adoption rates among enterprises, and the presence of major cloud service providers and technology giants like AWS, Microsoft Corporation, and Datadog Inc.
Key Drivers for Dominance:
- Economic Policies: Favorable government initiatives and investments in digital infrastructure in North America have spurred cloud adoption and, consequently, the demand for advanced cloud monitoring solutions.
- Technological Infrastructure: The presence of a robust technological ecosystem, including widespread broadband penetration and data center capacity, facilitates the deployment and utilization of cloud-based monitoring tools.
- Enterprise Adoption: Large enterprises across sectors like BFSI, Retail, and Healthcare in North America have been early adopters of cloud technologies, necessitating sophisticated cloud observability and performance management tools.
The BFSI sector is also a significant contributor, driven by stringent regulatory requirements and the critical need for uninterrupted service availability and robust security monitoring to protect sensitive financial data. The Healthcare industry's increasing reliance on cloud for electronic health records (EHR) and patient data management also fuels demand for reliable cloud infrastructure monitoring.
Cloud Monitoring Industry Product Developments
Product development in the Cloud Monitoring Industry is focused on delivering comprehensive observability and intelligent automation. Key innovations include the integration of AI/ML for predictive analytics, anomaly detection, and root cause analysis, moving beyond traditional reactive monitoring. Solutions are increasingly offering unified platforms for logs, metrics, and traces, simplifying the management of complex, distributed cloud-native applications. Companies are also developing specialized monitoring tools for emerging technologies like Kubernetes, serverless functions, and edge computing. Competitive advantages are being gained through enhanced integration capabilities with CI/CD pipelines, automated remediation workflows, and intuitive user interfaces that provide actionable insights for IT operations teams. The market fit is strong for solutions that can scale seamlessly with cloud environments and provide real-time performance data to ensure optimal user experiences and business continuity.
Key Drivers of Cloud Monitoring Industry Growth
The Cloud Monitoring Industry is experiencing significant growth driven by several key factors. Technologically, the widespread adoption of hybrid and multi-cloud environments necessitates unified cloud observability solutions that can manage disparate infrastructures. The proliferation of microservices, containers, and serverless architectures introduces complexity, amplifying the need for advanced application performance monitoring (APM) and infrastructure monitoring. Economically, digital transformation initiatives across all sectors are compelling businesses to invest in cloud technologies, thereby increasing their reliance on effective cloud monitoring for performance and reliability. Regulatory frameworks, particularly those related to data privacy and security, are also driving demand for robust security monitoring and compliance management capabilities within cloud environments.
Challenges in the Cloud Monitoring Industry Market
Despite its robust growth, the Cloud Monitoring Industry faces several challenges. The sheer complexity and dynamic nature of modern cloud architectures, especially with the rise of microservices and Kubernetes, make comprehensive cloud observability a significant technical hurdle. Ensuring seamless integration across diverse cloud platforms (AWS, Azure, Google Cloud) and on-premises infrastructure is also a persistent challenge. Furthermore, the increasing volume of data generated by cloud environments requires sophisticated data processing and analysis capabilities, leading to potential scalability issues and increased costs for log management and metric collection. Competitive pressures from a crowded market, with numerous vendors offering overlapping functionalities, can also make it difficult for businesses to select the most suitable solutions.
Emerging Opportunities in Cloud Monitoring Industry
Emerging opportunities in the Cloud Monitoring Industry are centered around the advancement and integration of cutting-edge technologies. The widespread adoption of AIOps (Artificial Intelligence for IT Operations) is a major catalyst, enabling predictive analytics, automated anomaly detection, and intelligent root-cause analysis, promising to revolutionize incident response. The growing demand for DevOps and SRE (Site Reliability Engineering) practices is fueling the need for integrated observability platforms that bridge the gap between development and operations teams. Strategic partnerships between cloud providers, software vendors, and managed service providers are creating opportunities for bundled solutions and enhanced customer support. Furthermore, market expansion into emerging economies, where cloud adoption is rapidly accelerating, presents significant untapped potential for cloud monitoring solutions.
Leading Players in the Cloud Monitoring Industry Sector
- IDERA Inc
- IBM Corporation
- Zenoss Inc
- Broadcom Inc (CA Technologies)
- Datadog Inc
- Microsoft Corporation
- Oracle Corporation
- AWS
- LogicMonitor Inc
Key Milestones in Cloud Monitoring Industry Industry
- April 2023: Sumo Logic, a software-as-a-service (SaaS) analytics platform enabling dependable and secure cloud-native applications, announced that it had earned the Amazon Web Services (AWS) cloud operations competency in monitoring and observability. Sumo Logic has proven competence in assisting customers in establishing a robust and scalable foundation for end-to-end cloud operations as an AWS cloud operations competency partner.
- June 2022: Cisco expanded its offering of cloud-based management solutions by adding Nexus data center and Catalyst campus switches and introducing a cloud-native version of the AppDynamics application performance monitor.
Strategic Outlook for Cloud Monitoring Industry Market
The strategic outlook for the Cloud Monitoring Industry is exceptionally promising, driven by continuous innovation and the indispensable nature of cloud observability in the modern digital landscape. The increasing adoption of advanced technologies like AI/ML for AIOps will further automate and optimize cloud operations, reducing human intervention and improving incident resolution times. The ongoing trend towards hybrid and multi-cloud strategies will sustain the demand for unified, cross-platform monitoring solutions. Strategic opportunities lie in developing specialized solutions for niche markets and emerging technologies, such as edge computing and IoT, as well as enhancing capabilities in real-time analytics and predictive maintenance. The industry's future hinges on providing comprehensive, actionable insights that empower businesses to achieve peak performance, security, and reliability in their cloud deployments, ensuring continued growth and market expansion.
Cloud Monitoring Industry Segmentation
-
1. Model
- 1.1. IaaS
- 1.2. SaaS
- 1.3. PaaS
-
2. End-User Industry
- 2.1. BFSI
- 2.2. Retail
- 2.3. IT and Telecommunications
- 2.4. Healthcare
- 2.5. Government
- 2.6. Manufacturing
- 2.7. Other End-User Industries
Cloud Monitoring Industry Segmentation By Geography
-
1. North America
- 1.1. United States
- 1.2. Canada
-
2. Europe
- 2.1. United Kingdom
- 2.2. Germany
- 2.3. France
- 2.4. Spain
-
3. Asia
- 3.1. China
- 3.2. Japan
- 3.3. Singapore
- 3.4. Australia and New Zealand
-
4. Latin America
- 4.1. Mexico
- 4.2. Brazil
-
5. Middle East and Africa
- 5.1. United Arab Emirates
- 5.2. Saudi Arabia
Cloud Monitoring Industry Regional Market Share
Geographic Coverage of Cloud Monitoring Industry
Cloud Monitoring Industry REPORT HIGHLIGHTS
| Aspects | Details |
|---|---|
| Study Period | 2020-2034 |
| Base Year | 2025 |
| Estimated Year | 2026 |
| Forecast Period | 2026-2034 |
| Historical Period | 2020-2025 |
| Growth Rate | CAGR of 19.91% from 2020-2034 |
| Segmentation |
|
Table of Contents
- 1. Introduction
- 1.1. Research Scope
- 1.2. Market Segmentation
- 1.3. Research Objective
- 1.4. Definitions and Assumptions
- 2. Executive Summary
- 2.1. Market Snapshot
- 3. Market Dynamics
- 3.1. Market Drivers
- 3.2. Market Restrains
- 3.3. Market Trends
- 3.4. Market Opportunities
- 4. Market Factor Analysis
- 4.1. Porters Five Forces
- 4.1.1. Bargaining Power of Suppliers
- 4.1.2. Bargaining Power of Buyers
- 4.1.3. Threat of New Entrants
- 4.1.4. Threat of Substitutes
- 4.1.5. Competitive Rivalry
- 4.2. PESTEL analysis
- 4.3. BCG Analysis
- 4.3.1. Stars (High Growth, High Market Share)
- 4.3.2. Cash Cows (Low Growth, High Market Share)
- 4.3.3. Question Mark (High Growth, Low Market Share)
- 4.3.4. Dogs (Low Growth, Low Market Share)
- 4.4. Ansoff Matrix Analysis
- 4.5. Supply Chain Analysis
- 4.6. Regulatory Landscape
- 4.7. Current Market Potential and Opportunity Assessment (TAM–SAM–SOM Framework)
- 4.8. MDP Analyst Note
- 4.1. Porters Five Forces
- 5. Market Analysis, Insights and Forecast 2021-2033
- 5.1. Market Analysis, Insights and Forecast - by Model
- 5.1.1. IaaS
- 5.1.2. SaaS
- 5.1.3. PaaS
- 5.2. Market Analysis, Insights and Forecast - by End-User Industry
- 5.2.1. BFSI
- 5.2.2. Retail
- 5.2.3. IT and Telecommunications
- 5.2.4. Healthcare
- 5.2.5. Government
- 5.2.6. Manufacturing
- 5.2.7. Other End-User Industries
- 5.3. Market Analysis, Insights and Forecast - by Region
- 5.3.1. North America
- 5.3.2. Europe
- 5.3.3. Asia
- 5.3.4. Latin America
- 5.3.5. Middle East and Africa
- 5.1. Market Analysis, Insights and Forecast - by Model
- 6. Global Cloud Monitoring Industry Analysis, Insights and Forecast, 2021-2033
- 6.1. Market Analysis, Insights and Forecast - by Model
- 6.1.1. IaaS
- 6.1.2. SaaS
- 6.1.3. PaaS
- 6.2. Market Analysis, Insights and Forecast - by End-User Industry
- 6.2.1. BFSI
- 6.2.2. Retail
- 6.2.3. IT and Telecommunications
- 6.2.4. Healthcare
- 6.2.5. Government
- 6.2.6. Manufacturing
- 6.2.7. Other End-User Industries
- 6.1. Market Analysis, Insights and Forecast - by Model
- 7. North America Cloud Monitoring Industry Analysis, Insights and Forecast, 2020-2032
- 7.1. Market Analysis, Insights and Forecast - by Model
- 7.1.1. IaaS
- 7.1.2. SaaS
- 7.1.3. PaaS
- 7.2. Market Analysis, Insights and Forecast - by End-User Industry
- 7.2.1. BFSI
- 7.2.2. Retail
- 7.2.3. IT and Telecommunications
- 7.2.4. Healthcare
- 7.2.5. Government
- 7.2.6. Manufacturing
- 7.2.7. Other End-User Industries
- 7.1. Market Analysis, Insights and Forecast - by Model
- 8. Europe Cloud Monitoring Industry Analysis, Insights and Forecast, 2020-2032
- 8.1. Market Analysis, Insights and Forecast - by Model
- 8.1.1. IaaS
- 8.1.2. SaaS
- 8.1.3. PaaS
- 8.2. Market Analysis, Insights and Forecast - by End-User Industry
- 8.2.1. BFSI
- 8.2.2. Retail
- 8.2.3. IT and Telecommunications
- 8.2.4. Healthcare
- 8.2.5. Government
- 8.2.6. Manufacturing
- 8.2.7. Other End-User Industries
- 8.1. Market Analysis, Insights and Forecast - by Model
- 9. Asia Cloud Monitoring Industry Analysis, Insights and Forecast, 2020-2032
- 9.1. Market Analysis, Insights and Forecast - by Model
- 9.1.1. IaaS
- 9.1.2. SaaS
- 9.1.3. PaaS
- 9.2. Market Analysis, Insights and Forecast - by End-User Industry
- 9.2.1. BFSI
- 9.2.2. Retail
- 9.2.3. IT and Telecommunications
- 9.2.4. Healthcare
- 9.2.5. Government
- 9.2.6. Manufacturing
- 9.2.7. Other End-User Industries
- 9.1. Market Analysis, Insights and Forecast - by Model
- 10. Latin America Cloud Monitoring Industry Analysis, Insights and Forecast, 2020-2032
- 10.1. Market Analysis, Insights and Forecast - by Model
- 10.1.1. IaaS
- 10.1.2. SaaS
- 10.1.3. PaaS
- 10.2. Market Analysis, Insights and Forecast - by End-User Industry
- 10.2.1. BFSI
- 10.2.2. Retail
- 10.2.3. IT and Telecommunications
- 10.2.4. Healthcare
- 10.2.5. Government
- 10.2.6. Manufacturing
- 10.2.7. Other End-User Industries
- 10.1. Market Analysis, Insights and Forecast - by Model
- 11. Middle East and Africa Cloud Monitoring Industry Analysis, Insights and Forecast, 2020-2032
- 11.1. Market Analysis, Insights and Forecast - by Model
- 11.1.1. IaaS
- 11.1.2. SaaS
- 11.1.3. PaaS
- 11.2. Market Analysis, Insights and Forecast - by End-User Industry
- 11.2.1. BFSI
- 11.2.2. Retail
- 11.2.3. IT and Telecommunications
- 11.2.4. Healthcare
- 11.2.5. Government
- 11.2.6. Manufacturing
- 11.2.7. Other End-User Industries
- 11.1. Market Analysis, Insights and Forecast - by Model
- 12. Competitive Analysis
- 12.1. Company Profiles
- 12.1.1 IDERA Inc
- 12.1.1.1. Company Overview
- 12.1.1.2. Products
- 12.1.1.3. Company Financials
- 12.1.1.4. SWOT Analysis
- 12.1.2 IBM Corporation
- 12.1.2.1. Company Overview
- 12.1.2.2. Products
- 12.1.2.3. Company Financials
- 12.1.2.4. SWOT Analysis
- 12.1.3 Zenoss Inc
- 12.1.3.1. Company Overview
- 12.1.3.2. Products
- 12.1.3.3. Company Financials
- 12.1.3.4. SWOT Analysis
- 12.1.4 Broadcom Inc (CA Technologies)
- 12.1.4.1. Company Overview
- 12.1.4.2. Products
- 12.1.4.3. Company Financials
- 12.1.4.4. SWOT Analysis
- 12.1.5 Datadog Inc
- 12.1.5.1. Company Overview
- 12.1.5.2. Products
- 12.1.5.3. Company Financials
- 12.1.5.4. SWOT Analysis
- 12.1.6 Microsoft Corporation
- 12.1.6.1. Company Overview
- 12.1.6.2. Products
- 12.1.6.3. Company Financials
- 12.1.6.4. SWOT Analysis
- 12.1.7 Oracle Corporation
- 12.1.7.1. Company Overview
- 12.1.7.2. Products
- 12.1.7.3. Company Financials
- 12.1.7.4. SWOT Analysis
- 12.1.8 AWS
- 12.1.8.1. Company Overview
- 12.1.8.2. Products
- 12.1.8.3. Company Financials
- 12.1.8.4. SWOT Analysis
- 12.1.9 LogicMonitor Inc
- 12.1.9.1. Company Overview
- 12.1.9.2. Products
- 12.1.9.3. Company Financials
- 12.1.9.4. SWOT Analysis
- 12.1.1 IDERA Inc
- 12.2. Market Entropy
- 12.2.1 Company's Key Areas Served
- 12.2.2 Recent Developments
- 12.3. Company Market Share Analysis 2025
- 12.3.1 Top 5 Companies Market Share Analysis
- 12.3.2 Top 3 Companies Market Share Analysis
- 12.4. List of Potential Customers
- 13. Research Methodology
List of Figures
- Figure 1: Global Cloud Monitoring Industry Revenue Breakdown (Million, %) by Region 2025 & 2033
- Figure 2: Global Cloud Monitoring Industry Volume Breakdown (K Unit, %) by Region 2025 & 2033
- Figure 3: North America Cloud Monitoring Industry Revenue (Million), by Model 2025 & 2033
- Figure 4: North America Cloud Monitoring Industry Volume (K Unit), by Model 2025 & 2033
- Figure 5: North America Cloud Monitoring Industry Revenue Share (%), by Model 2025 & 2033
- Figure 6: North America Cloud Monitoring Industry Volume Share (%), by Model 2025 & 2033
- Figure 7: North America Cloud Monitoring Industry Revenue (Million), by End-User Industry 2025 & 2033
- Figure 8: North America Cloud Monitoring Industry Volume (K Unit), by End-User Industry 2025 & 2033
- Figure 9: North America Cloud Monitoring Industry Revenue Share (%), by End-User Industry 2025 & 2033
- Figure 10: North America Cloud Monitoring Industry Volume Share (%), by End-User Industry 2025 & 2033
- Figure 11: North America Cloud Monitoring Industry Revenue (Million), by Country 2025 & 2033
- Figure 12: North America Cloud Monitoring Industry Volume (K Unit), by Country 2025 & 2033
- Figure 13: North America Cloud Monitoring Industry Revenue Share (%), by Country 2025 & 2033
- Figure 14: North America Cloud Monitoring Industry Volume Share (%), by Country 2025 & 2033
- Figure 15: Europe Cloud Monitoring Industry Revenue (Million), by Model 2025 & 2033
- Figure 16: Europe Cloud Monitoring Industry Volume (K Unit), by Model 2025 & 2033
- Figure 17: Europe Cloud Monitoring Industry Revenue Share (%), by Model 2025 & 2033
- Figure 18: Europe Cloud Monitoring Industry Volume Share (%), by Model 2025 & 2033
- Figure 19: Europe Cloud Monitoring Industry Revenue (Million), by End-User Industry 2025 & 2033
- Figure 20: Europe Cloud Monitoring Industry Volume (K Unit), by End-User Industry 2025 & 2033
- Figure 21: Europe Cloud Monitoring Industry Revenue Share (%), by End-User Industry 2025 & 2033
- Figure 22: Europe Cloud Monitoring Industry Volume Share (%), by End-User Industry 2025 & 2033
- Figure 23: Europe Cloud Monitoring Industry Revenue (Million), by Country 2025 & 2033
- Figure 24: Europe Cloud Monitoring Industry Volume (K Unit), by Country 2025 & 2033
- Figure 25: Europe Cloud Monitoring Industry Revenue Share (%), by Country 2025 & 2033
- Figure 26: Europe Cloud Monitoring Industry Volume Share (%), by Country 2025 & 2033
- Figure 27: Asia Cloud Monitoring Industry Revenue (Million), by Model 2025 & 2033
- Figure 28: Asia Cloud Monitoring Industry Volume (K Unit), by Model 2025 & 2033
- Figure 29: Asia Cloud Monitoring Industry Revenue Share (%), by Model 2025 & 2033
- Figure 30: Asia Cloud Monitoring Industry Volume Share (%), by Model 2025 & 2033
- Figure 31: Asia Cloud Monitoring Industry Revenue (Million), by End-User Industry 2025 & 2033
- Figure 32: Asia Cloud Monitoring Industry Volume (K Unit), by End-User Industry 2025 & 2033
- Figure 33: Asia Cloud Monitoring Industry Revenue Share (%), by End-User Industry 2025 & 2033
- Figure 34: Asia Cloud Monitoring Industry Volume Share (%), by End-User Industry 2025 & 2033
- Figure 35: Asia Cloud Monitoring Industry Revenue (Million), by Country 2025 & 2033
- Figure 36: Asia Cloud Monitoring Industry Volume (K Unit), by Country 2025 & 2033
- Figure 37: Asia Cloud Monitoring Industry Revenue Share (%), by Country 2025 & 2033
- Figure 38: Asia Cloud Monitoring Industry Volume Share (%), by Country 2025 & 2033
- Figure 39: Latin America Cloud Monitoring Industry Revenue (Million), by Model 2025 & 2033
- Figure 40: Latin America Cloud Monitoring Industry Volume (K Unit), by Model 2025 & 2033
- Figure 41: Latin America Cloud Monitoring Industry Revenue Share (%), by Model 2025 & 2033
- Figure 42: Latin America Cloud Monitoring Industry Volume Share (%), by Model 2025 & 2033
- Figure 43: Latin America Cloud Monitoring Industry Revenue (Million), by End-User Industry 2025 & 2033
- Figure 44: Latin America Cloud Monitoring Industry Volume (K Unit), by End-User Industry 2025 & 2033
- Figure 45: Latin America Cloud Monitoring Industry Revenue Share (%), by End-User Industry 2025 & 2033
- Figure 46: Latin America Cloud Monitoring Industry Volume Share (%), by End-User Industry 2025 & 2033
- Figure 47: Latin America Cloud Monitoring Industry Revenue (Million), by Country 2025 & 2033
- Figure 48: Latin America Cloud Monitoring Industry Volume (K Unit), by Country 2025 & 2033
- Figure 49: Latin America Cloud Monitoring Industry Revenue Share (%), by Country 2025 & 2033
- Figure 50: Latin America Cloud Monitoring Industry Volume Share (%), by Country 2025 & 2033
- Figure 51: Middle East and Africa Cloud Monitoring Industry Revenue (Million), by Model 2025 & 2033
- Figure 52: Middle East and Africa Cloud Monitoring Industry Volume (K Unit), by Model 2025 & 2033
- Figure 53: Middle East and Africa Cloud Monitoring Industry Revenue Share (%), by Model 2025 & 2033
- Figure 54: Middle East and Africa Cloud Monitoring Industry Volume Share (%), by Model 2025 & 2033
- Figure 55: Middle East and Africa Cloud Monitoring Industry Revenue (Million), by End-User Industry 2025 & 2033
- Figure 56: Middle East and Africa Cloud Monitoring Industry Volume (K Unit), by End-User Industry 2025 & 2033
- Figure 57: Middle East and Africa Cloud Monitoring Industry Revenue Share (%), by End-User Industry 2025 & 2033
- Figure 58: Middle East and Africa Cloud Monitoring Industry Volume Share (%), by End-User Industry 2025 & 2033
- Figure 59: Middle East and Africa Cloud Monitoring Industry Revenue (Million), by Country 2025 & 2033
- Figure 60: Middle East and Africa Cloud Monitoring Industry Volume (K Unit), by Country 2025 & 2033
- Figure 61: Middle East and Africa Cloud Monitoring Industry Revenue Share (%), by Country 2025 & 2033
- Figure 62: Middle East and Africa Cloud Monitoring Industry Volume Share (%), by Country 2025 & 2033
List of Tables
- Table 1: Global Cloud Monitoring Industry Revenue Million Forecast, by Model 2020 & 2033
- Table 2: Global Cloud Monitoring Industry Volume K Unit Forecast, by Model 2020 & 2033
- Table 3: Global Cloud Monitoring Industry Revenue Million Forecast, by End-User Industry 2020 & 2033
- Table 4: Global Cloud Monitoring Industry Volume K Unit Forecast, by End-User Industry 2020 & 2033
- Table 5: Global Cloud Monitoring Industry Revenue Million Forecast, by Region 2020 & 2033
- Table 6: Global Cloud Monitoring Industry Volume K Unit Forecast, by Region 2020 & 2033
- Table 7: Global Cloud Monitoring Industry Revenue Million Forecast, by Model 2020 & 2033
- Table 8: Global Cloud Monitoring Industry Volume K Unit Forecast, by Model 2020 & 2033
- Table 9: Global Cloud Monitoring Industry Revenue Million Forecast, by End-User Industry 2020 & 2033
- Table 10: Global Cloud Monitoring Industry Volume K Unit Forecast, by End-User Industry 2020 & 2033
- Table 11: Global Cloud Monitoring Industry Revenue Million Forecast, by Country 2020 & 2033
- Table 12: Global Cloud Monitoring Industry Volume K Unit Forecast, by Country 2020 & 2033
- Table 13: United States Cloud Monitoring Industry Revenue (Million) Forecast, by Application 2020 & 2033
- Table 14: United States Cloud Monitoring Industry Volume (K Unit) Forecast, by Application 2020 & 2033
- Table 15: Canada Cloud Monitoring Industry Revenue (Million) Forecast, by Application 2020 & 2033
- Table 16: Canada Cloud Monitoring Industry Volume (K Unit) Forecast, by Application 2020 & 2033
- Table 17: Global Cloud Monitoring Industry Revenue Million Forecast, by Model 2020 & 2033
- Table 18: Global Cloud Monitoring Industry Volume K Unit Forecast, by Model 2020 & 2033
- Table 19: Global Cloud Monitoring Industry Revenue Million Forecast, by End-User Industry 2020 & 2033
- Table 20: Global Cloud Monitoring Industry Volume K Unit Forecast, by End-User Industry 2020 & 2033
- Table 21: Global Cloud Monitoring Industry Revenue Million Forecast, by Country 2020 & 2033
- Table 22: Global Cloud Monitoring Industry Volume K Unit Forecast, by Country 2020 & 2033
- Table 23: United Kingdom Cloud Monitoring Industry Revenue (Million) Forecast, by Application 2020 & 2033
- Table 24: United Kingdom Cloud Monitoring Industry Volume (K Unit) Forecast, by Application 2020 & 2033
- Table 25: Germany Cloud Monitoring Industry Revenue (Million) Forecast, by Application 2020 & 2033
- Table 26: Germany Cloud Monitoring Industry Volume (K Unit) Forecast, by Application 2020 & 2033
- Table 27: France Cloud Monitoring Industry Revenue (Million) Forecast, by Application 2020 & 2033
- Table 28: France Cloud Monitoring Industry Volume (K Unit) Forecast, by Application 2020 & 2033
- Table 29: Spain Cloud Monitoring Industry Revenue (Million) Forecast, by Application 2020 & 2033
- Table 30: Spain Cloud Monitoring Industry Volume (K Unit) Forecast, by Application 2020 & 2033
- Table 31: Global Cloud Monitoring Industry Revenue Million Forecast, by Model 2020 & 2033
- Table 32: Global Cloud Monitoring Industry Volume K Unit Forecast, by Model 2020 & 2033
- Table 33: Global Cloud Monitoring Industry Revenue Million Forecast, by End-User Industry 2020 & 2033
- Table 34: Global Cloud Monitoring Industry Volume K Unit Forecast, by End-User Industry 2020 & 2033
- Table 35: Global Cloud Monitoring Industry Revenue Million Forecast, by Country 2020 & 2033
- Table 36: Global Cloud Monitoring Industry Volume K Unit Forecast, by Country 2020 & 2033
- Table 37: China Cloud Monitoring Industry Revenue (Million) Forecast, by Application 2020 & 2033
- Table 38: China Cloud Monitoring Industry Volume (K Unit) Forecast, by Application 2020 & 2033
- Table 39: Japan Cloud Monitoring Industry Revenue (Million) Forecast, by Application 2020 & 2033
- Table 40: Japan Cloud Monitoring Industry Volume (K Unit) Forecast, by Application 2020 & 2033
- Table 41: Singapore Cloud Monitoring Industry Revenue (Million) Forecast, by Application 2020 & 2033
- Table 42: Singapore Cloud Monitoring Industry Volume (K Unit) Forecast, by Application 2020 & 2033
- Table 43: Australia and New Zealand Cloud Monitoring Industry Revenue (Million) Forecast, by Application 2020 & 2033
- Table 44: Australia and New Zealand Cloud Monitoring Industry Volume (K Unit) Forecast, by Application 2020 & 2033
- Table 45: Global Cloud Monitoring Industry Revenue Million Forecast, by Model 2020 & 2033
- Table 46: Global Cloud Monitoring Industry Volume K Unit Forecast, by Model 2020 & 2033
- Table 47: Global Cloud Monitoring Industry Revenue Million Forecast, by End-User Industry 2020 & 2033
- Table 48: Global Cloud Monitoring Industry Volume K Unit Forecast, by End-User Industry 2020 & 2033
- Table 49: Global Cloud Monitoring Industry Revenue Million Forecast, by Country 2020 & 2033
- Table 50: Global Cloud Monitoring Industry Volume K Unit Forecast, by Country 2020 & 2033
- Table 51: Mexico Cloud Monitoring Industry Revenue (Million) Forecast, by Application 2020 & 2033
- Table 52: Mexico Cloud Monitoring Industry Volume (K Unit) Forecast, by Application 2020 & 2033
- Table 53: Brazil Cloud Monitoring Industry Revenue (Million) Forecast, by Application 2020 & 2033
- Table 54: Brazil Cloud Monitoring Industry Volume (K Unit) Forecast, by Application 2020 & 2033
- Table 55: Global Cloud Monitoring Industry Revenue Million Forecast, by Model 2020 & 2033
- Table 56: Global Cloud Monitoring Industry Volume K Unit Forecast, by Model 2020 & 2033
- Table 57: Global Cloud Monitoring Industry Revenue Million Forecast, by End-User Industry 2020 & 2033
- Table 58: Global Cloud Monitoring Industry Volume K Unit Forecast, by End-User Industry 2020 & 2033
- Table 59: Global Cloud Monitoring Industry Revenue Million Forecast, by Country 2020 & 2033
- Table 60: Global Cloud Monitoring Industry Volume K Unit Forecast, by Country 2020 & 2033
- Table 61: United Arab Emirates Cloud Monitoring Industry Revenue (Million) Forecast, by Application 2020 & 2033
- Table 62: United Arab Emirates Cloud Monitoring Industry Volume (K Unit) Forecast, by Application 2020 & 2033
- Table 63: Saudi Arabia Cloud Monitoring Industry Revenue (Million) Forecast, by Application 2020 & 2033
- Table 64: Saudi Arabia Cloud Monitoring Industry Volume (K Unit) Forecast, by Application 2020 & 2033
Frequently Asked Questions
1. What is the projected Compound Annual Growth Rate (CAGR) of the Cloud Monitoring Industry?
The projected CAGR is approximately 19.91%.
2. Which companies are prominent players in the Cloud Monitoring Industry?
Key companies in the market include IDERA Inc, IBM Corporation, Zenoss Inc , Broadcom Inc (CA Technologies), Datadog Inc, Microsoft Corporation, Oracle Corporation, AWS, LogicMonitor Inc.
3. What are the main segments of the Cloud Monitoring Industry?
The market segments include Model, End-User Industry.
4. Can you provide details about the market size?
The market size is estimated to be USD 3.13 Million as of 2022.
5. What are some drivers contributing to market growth?
Growth in Cloud Adoption Across End Users; Rising Need for Efficiently Managing the Performance and Security of Cloud Platforms.
6. What are the notable trends driving market growth?
Growth in Cloud Adoption Across End Users is Expected to Drive the Market Growth.
7. Are there any restraints impacting market growth?
Diminishing Profit Margins and Ongoing Changes in Macro-environment.
8. Can you provide examples of recent developments in the market?
April 2023: Sumo Logic, a software-as-a-service (SaaS) analytics platform enabling dependable and secure cloud-native applications, announced that it had earned the Amazon Web Services (AWS) cloud operations competency in monitoring and observability. Sumo Logic has proven competence in assisting customers in establishing a robust and scalable foundation for end-to-end cloud operations as an AWS cloud operations competency partner.
9. What pricing options are available for accessing the report?
Pricing options include single-user, multi-user, and enterprise licenses priced at USD 4750, USD 5250, and USD 8750 respectively.
10. Is the market size provided in terms of value or volume?
The market size is provided in terms of value, measured in Million and volume, measured in K Unit.
11. Are there any specific market keywords associated with the report?
Yes, the market keyword associated with the report is "Cloud Monitoring Industry," which aids in identifying and referencing the specific market segment covered.
12. How do I determine which pricing option suits my needs best?
The pricing options vary based on user requirements and access needs. Individual users may opt for single-user licenses, while businesses requiring broader access may choose multi-user or enterprise licenses for cost-effective access to the report.
13. Are there any additional resources or data provided in the Cloud Monitoring Industry report?
While the report offers comprehensive insights, it's advisable to review the specific contents or supplementary materials provided to ascertain if additional resources or data are available.
14. How can I stay updated on further developments or reports in the Cloud Monitoring Industry?
To stay informed about further developments, trends, and reports in the Cloud Monitoring Industry, consider subscribing to industry newsletters, following relevant companies and organizations, or regularly checking reputable industry news sources and publications.
Methodology
Step 1 - Identification of Relevant Samples Size from Population Database


Step 2 - Approaches for Defining Global Market Size (Value, Volume* & Price*)

Note*: In applicable scenarios
Step 3 - Data Sources
Primary Research
- Web Analytics
- Survey Reports
- Research Institute
- Latest Research Reports
- Opinion Leaders
Secondary Research
- Annual Reports
- White Paper
- Latest Press Release
- Industry Association
- Paid Database
- Investor Presentations

Step 4 - Data Triangulation
Involves using different sources of information in order to increase the validity of a study
These sources are likely to be stakeholders in a program - participants, other researchers, program staff, other community members, and so on.
Then we put all data in single framework & apply various statistical tools to find out the dynamic on the market.
During the analysis stage, feedback from the stakeholder groups would be compared to determine areas of agreement as well as areas of divergence