

Key Insights
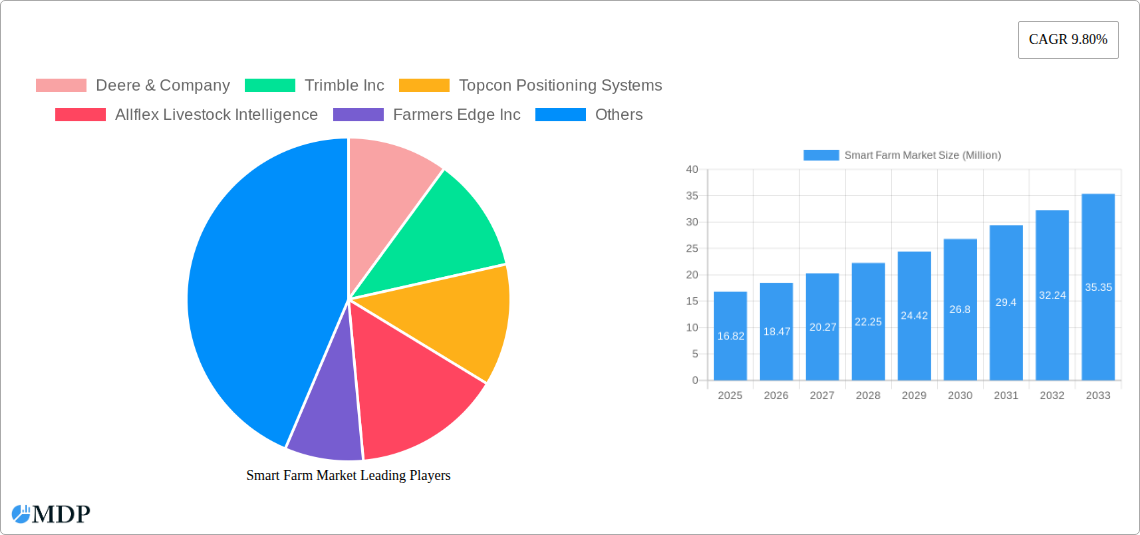
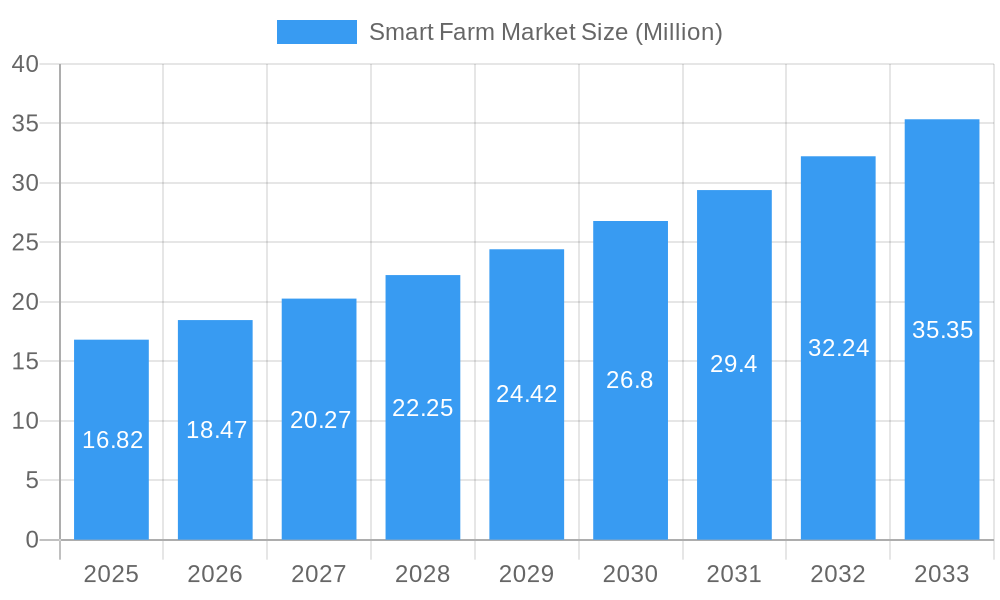
The global Smart Farm Market is experiencing robust growth, projected to reach $16.82 million in value by 2025 and expand at a Compound Annual Growth Rate (CAGR) of 9.80% during the forecast period of 2025-2033. This significant expansion is driven by the increasing adoption of advanced technologies in agriculture to enhance efficiency, sustainability, and yield. Key drivers include the growing global population's demand for food security, the imperative to optimize resource utilization (water, fertilizers, energy), and the need to mitigate the environmental impact of traditional farming practices. Furthermore, government initiatives promoting agricultural modernization and precision farming techniques are playing a crucial role in market acceleration. The market is segmented across various offerings, with Hardware and Software expected to dominate due to the foundational role they play in enabling smart farming solutions. Services are also gaining traction as farmers seek expert guidance in implementing and managing these complex systems.
Smart Farm Market Market Size (In Million)
Emerging trends such as the integration of Artificial Intelligence (AI) and Machine Learning (ML) for predictive analytics, the proliferation of the Internet of Things (IoT) for real-time data collection and remote monitoring, and the development of autonomous farming machinery are shaping the future of the smart farm landscape. Precision Farming and Livestock Monitoring are anticipated to be the leading applications, capitalizing on the direct benefits of technology in optimizing crop yields and animal welfare. While the market shows immense promise, certain restraints, such as the high initial investment costs for smart farming technologies and the need for specialized technical expertise among farmers, may pose challenges. However, the continuous innovation in cost-effective solutions and the availability of training programs are expected to gradually overcome these hurdles, paving the way for widespread adoption across diverse agricultural sectors and regions. North America and Europe are currently leading in adoption, driven by advanced infrastructure and supportive policies, with Asia poised for substantial growth due to its large agricultural base and increasing technological adoption.
Smart Farm Market Company Market Share
This comprehensive report, "Smart Farm Market," delves into the dynamic landscape of agricultural technology, exploring market growth, key trends, leading players, and future opportunities. Analyzing the period from 2019 to 2033, with a base and estimated year of 2025, this report provides actionable insights for industry stakeholders seeking to capitalize on the burgeoning smart farming revolution. The forecast period of 2025–2033 predicts significant expansion, driven by technological advancements and increasing global demand for efficient and sustainable food production.
Smart Farm Market Market Dynamics & Concentration
The smart farm market is characterized by moderate to high concentration, with key players like Deere & Company, Trimble Inc., and Topcon Positioning Systems holding significant market share in hardware and precision farming solutions. Innovation drivers are primarily technological advancements in IoT, AI, and Big Data analytics, enabling enhanced crop monitoring, yield prediction, and resource optimization. Regulatory frameworks, while evolving, are increasingly supportive of precision agriculture and sustainable farming practices, particularly in North America and Europe. Product substitutes are limited in their ability to replicate the integrated solutions offered by smart farm technologies, though traditional farming methods still represent a baseline. End-user trends indicate a strong preference for solutions that demonstrably increase farm productivity, reduce operational costs, and improve environmental sustainability. Merger and acquisition (M&A) activities are prevalent, with an estimated 50+ significant deals within the historical period (2019–2024), indicating consolidation and strategic expansion. For instance, AgriData Incorporated's recent funding round underscores investor confidence in AI-powered solutions.
Smart Farm Market Industry Trends & Analysis
The smart farm market is experiencing robust growth, projected to reach a market size exceeding One Million Million by 2033. The Compound Annual Growth Rate (CAGR) is estimated at 12.5% for the forecast period (2025–2033). This expansion is propelled by several interconnected trends. The escalating global population, projected to reach 10 Million Million by 2030, necessitates increased food production, making efficient and high-yield farming crucial. Technological disruptions are at the forefront, with the widespread adoption of the Internet of Things (IoT) enabling real-time data collection from sensors, drones, and connected machinery. Artificial Intelligence (AI) and machine learning algorithms are being leveraged for predictive analytics, optimizing irrigation, fertilization, and pest control, thereby minimizing resource wastage and environmental impact. Precision farming applications, including GPS-guided tractors, variable rate application of inputs, and automated irrigation systems, are gaining significant traction, leading to an estimated market penetration of 30% in developed agricultural economies by 2028.
Consumer preferences are shifting towards sustainably produced food, incentivizing farmers to adopt technologies that reduce chemical usage and improve water management. This trend is particularly evident in markets demanding organic and ethically sourced produce. Competitive dynamics are intensifying, with established agricultural giants like AGCO Corporation and John Deere, alongside specialized technology providers such as Farmers Edge Inc. and Innovasea Systems Inc., vying for market dominance. The integration of software and services alongside hardware is becoming a key differentiator, offering end-to-end solutions for farm management. Furthermore, advancements in robotics and automation are addressing the persistent challenge of farm labor shortages, further fueling market adoption. Gamaya's hyperspectral imaging technology, for example, offers advanced crop analytics, demonstrating the continuous innovation within the sector. The growing awareness of climate change impacts on agriculture is also a significant driver, pushing for more resilient and adaptive farming practices supported by smart technologies. The market penetration of smart greenhouse solutions is also expected to rise due to controlled environment agriculture's efficiency.
Leading Markets & Segments in Smart Farm Market
The Precision Farming application segment is currently the dominant force within the smart farm market, with an estimated market share of 35% in 2025. This dominance is attributed to its direct impact on yield enhancement, cost reduction through optimized input application, and improved crop quality. North America, particularly the United States, leads in market adoption due to its large-scale agricultural operations, advanced technological infrastructure, and supportive government policies promoting precision agriculture. Key drivers for this regional dominance include substantial government incentives for technology adoption, a highly educated farming community receptive to innovation, and the presence of major agricultural technology companies.
- Hardware: This segment, encompassing sensors, drones, GPS devices, and automated machinery, is crucial for enabling smart farming functionalities. Its market share is estimated at 30% in 2025, serving as the foundation for data collection and automation.
- Software: This includes farm management software (FMS), data analytics platforms, and AI-powered decision support systems. With a projected market share of 25% in 2025, software is vital for interpreting data and providing actionable insights. The increasing sophistication of AI and cloud computing is a major driver for software growth.
- Services: This segment, comprising consulting, installation, maintenance, and data analysis services, accounts for approximately 15% of the market share in 2025. These services are critical for ensuring effective implementation and ongoing optimization of smart farm technologies.
- Precision Farming: As mentioned, this application leads with an estimated 35% market share, driving efficiency in crop production.
- Livestock Monitoring: This segment, focusing on animal health, welfare, and productivity tracking using sensors and AI, is projected to grow significantly, reaching an estimated 20% market share by 2030.
- Smart Greenhouse: This application is gaining momentum due to its potential for year-round production and reduced resource usage, with an estimated 10% market share. AgriData's recent advancements highlight the growth potential here.
- Field Mapping: Essential for precision farming, this application is integral to data-driven agricultural practices, estimated at 8% market share.
- Farm Labour Management: Addressing labor shortages through automation and optimized workforce planning, this segment is expected to grow substantially, estimated at 7% market share.
- Others: This residual category includes various emerging applications and technologies, estimated at 10% market share.
Europe also exhibits strong growth, driven by the EU's Common Agricultural Policy (CAP) that encourages sustainable and technologically advanced farming. The increasing demand for traceability and food safety further bolsters the adoption of smart farm solutions.
Smart Farm Market Product Developments
Recent product developments in the smart farm market are significantly enhancing agricultural efficiency and sustainability. IBM Corporation is developing advanced AI-powered solutions for predictive analytics, helping farmers anticipate pest outbreaks and optimize resource allocation. Gamaya's hyperspectral imaging technology offers detailed crop health analysis, enabling targeted interventions and reducing the need for broad-spectrum chemical applications. Allflex Livestock Intelligence continues to innovate in animal monitoring, providing real-time data on animal health, behavior, and productivity, which is crucial for optimizing herd management and preventing disease outbreaks. These innovations are crucial for competitive advantage, enabling farmers to achieve higher yields with reduced environmental impact.
Key Drivers of Smart Farm Market Growth
The smart farm market is propelled by a confluence of powerful drivers. Technological advancements, particularly in IoT, AI, and Big Data analytics, provide the foundational capabilities for smart farming solutions. The increasing global demand for food, driven by a growing population, necessitates higher agricultural output, which smart technologies are uniquely positioned to deliver. Government initiatives and subsidies worldwide are encouraging the adoption of precision agriculture and sustainable farming practices, further accelerating market growth. Economic factors, including rising input costs and labor shortages, create a strong incentive for farmers to invest in technologies that improve efficiency and reduce operational expenses.
Challenges in the Smart Farm Market Market
Despite its robust growth, the smart farm market faces several challenges. High upfront investment costs for advanced technologies can be a significant barrier for smaller farms and those in developing economies. The lack of standardized data protocols and interoperability issues between different systems can hinder seamless integration. Connectivity issues in rural areas, particularly in emerging markets, limit the effectiveness of real-time data-driven solutions. Furthermore, the need for specialized skills to operate and maintain these technologies presents a workforce training challenge, and regulatory complexities surrounding data privacy and ownership can also create uncertainties.
Emerging Opportunities in Smart Farm Market
Emerging opportunities in the smart farm market are abundant, driven by continuous innovation and evolving global needs. The integration of blockchain technology for enhanced supply chain transparency and traceability presents a significant avenue for growth. The development of autonomous farming systems and advanced robotics promises to further revolutionize farm operations, addressing labor shortages and increasing efficiency. Furthermore, the expansion of smart farming solutions into developing economies, where agricultural productivity is often lower, offers immense potential for market penetration and impact. Strategic partnerships between technology providers, agricultural organizations, and governments will be crucial in unlocking these opportunities and driving sustainable agricultural practices globally.
Leading Players in the Smart Farm Market Sector
- Deere & Company
- Trimble Inc.
- Topcon Positioning Systems
- Allflex Livestock Intelligence
- Farmers Edge Inc.
- Innovasea Systems Inc.
- AgriData Incorporated
- AGCO Corporation
- Gamaya
- IBM Corporation
Key Milestones in Smart Farm Market Industry
- February 2024: AgriData revealed that its innovative solutions improve agricultural practices for growers by utilizing AI-powered crop monitoring technology specifically tailored for greenhouses. The company obtained further investment from its existing investors. This influx of capital enables the company to accelerate its market’s growth and enhance the development of its camera systems and computer vision software.
- January 2024: Deere & Company revealed that it partnered with SpaceX to deliver advanced satellite communications (SATCOM) services to agricultural producers. By harnessing the capabilities of the premier Starlink network, this initiative aimed to assist farmers who encounter connectivity issues in rural areas, thereby enhancing their ability to utilize precision agriculture technologies. This collaboration marks a first in the industry, empowering John Deere customers to increase their productivity, profitability, and sustainability as they strive to supply fuel, food, and fiber to their communities and an expanding global population.
Strategic Outlook for Smart Farm Market Market
The strategic outlook for the smart farm market is exceptionally positive, driven by the imperative for global food security and sustainable agricultural practices. Continued investment in research and development for AI, IoT, and automation will be critical for maintaining a competitive edge. Companies that can offer integrated, end-to-end solutions, combining hardware, software, and services, will be best positioned for success. Strategic partnerships and collaborations, such as the one between Deere & Company and SpaceX, will be crucial for addressing connectivity challenges and expanding market reach. Furthermore, focusing on user-friendly interfaces and comprehensive training programs will accelerate adoption rates among a diverse range of agricultural operations, ensuring a future where technology empowers sustainable and efficient food production on a global scale.
Smart Farm Market Segmentation
-
1. Offering
- 1.1. Hardware
- 1.2. Software
- 1.3. Services
-
2. Application
- 2.1. Precision Farming
- 2.2. Livestock Monitoring
- 2.3. Smart Greenhouse
- 2.4. Field Mapping
- 2.5. Farm Labour Management
- 2.6. Others
Smart Farm Market Segmentation By Geography
- 1. North America
- 2. Europe
- 3. Asia
- 4. Australia and New Zealand
- 5. Latin America
- 6. Middle East and Africa
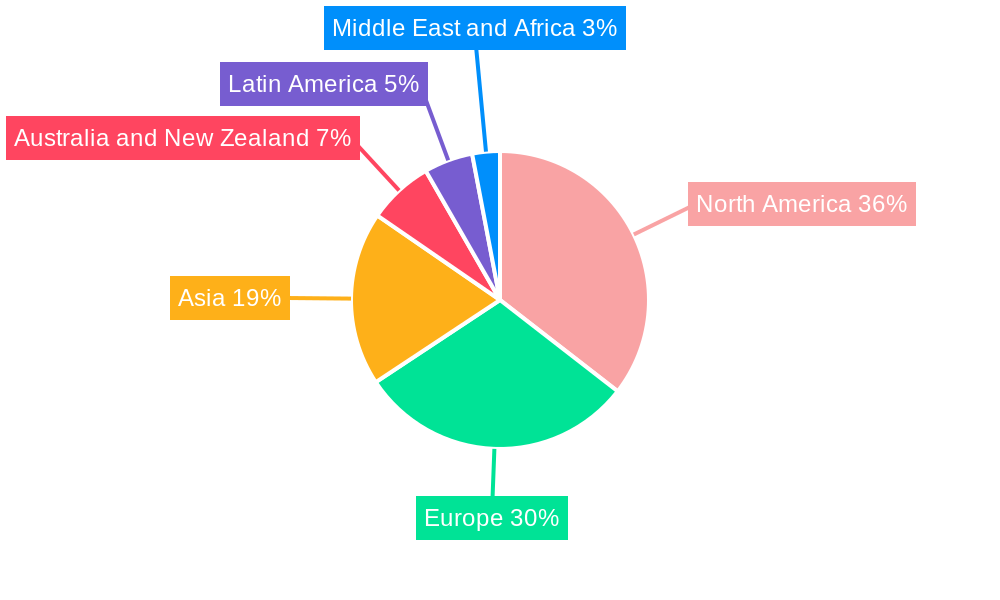
Smart Farm Market Regional Market Share
Geographic Coverage of Smart Farm Market
Smart Farm Market REPORT HIGHLIGHTS
| Aspects | Details |
|---|---|
| Study Period | 2020-2034 |
| Base Year | 2025 |
| Estimated Year | 2026 |
| Forecast Period | 2026-2034 |
| Historical Period | 2020-2025 |
| Growth Rate | CAGR of 9.80% from 2020-2034 |
| Segmentation |
|
Table of Contents
- 1. Introduction
- 1.1. Research Scope
- 1.2. Market Segmentation
- 1.3. Research Objective
- 1.4. Definitions and Assumptions
- 2. Executive Summary
- 2.1. Market Snapshot
- 3. Market Dynamics
- 3.1. Market Drivers
- 3.2. Market Restrains
- 3.3. Market Trends
- 3.4. Market Opportunities
- 4. Market Factor Analysis
- 4.1. Porters Five Forces
- 4.1.1. Bargaining Power of Suppliers
- 4.1.2. Bargaining Power of Buyers
- 4.1.3. Threat of New Entrants
- 4.1.4. Threat of Substitutes
- 4.1.5. Competitive Rivalry
- 4.2. PESTEL analysis
- 4.3. BCG Analysis
- 4.3.1. Stars (High Growth, High Market Share)
- 4.3.2. Cash Cows (Low Growth, High Market Share)
- 4.3.3. Question Mark (High Growth, Low Market Share)
- 4.3.4. Dogs (Low Growth, Low Market Share)
- 4.4. Ansoff Matrix Analysis
- 4.5. Supply Chain Analysis
- 4.6. Regulatory Landscape
- 4.7. Current Market Potential and Opportunity Assessment (TAM–SAM–SOM Framework)
- 4.8. MDP Analyst Note
- 4.1. Porters Five Forces
- 5. Market Analysis, Insights and Forecast 2021-2033
- 5.1. Market Analysis, Insights and Forecast - by Offering
- 5.1.1. Hardware
- 5.1.2. Software
- 5.1.3. Services
- 5.2. Market Analysis, Insights and Forecast - by Application
- 5.2.1. Precision Farming
- 5.2.2. Livestock Monitoring
- 5.2.3. Smart Greenhouse
- 5.2.4. Field Mapping
- 5.2.5. Farm Labour Management
- 5.2.6. Others
- 5.3. Market Analysis, Insights and Forecast - by Region
- 5.3.1. North America
- 5.3.2. Europe
- 5.3.3. Asia
- 5.3.4. Australia and New Zealand
- 5.3.5. Latin America
- 5.3.6. Middle East and Africa
- 5.1. Market Analysis, Insights and Forecast - by Offering
- 6. Global Smart Farm Market Analysis, Insights and Forecast, 2021-2033
- 6.1. Market Analysis, Insights and Forecast - by Offering
- 6.1.1. Hardware
- 6.1.2. Software
- 6.1.3. Services
- 6.2. Market Analysis, Insights and Forecast - by Application
- 6.2.1. Precision Farming
- 6.2.2. Livestock Monitoring
- 6.2.3. Smart Greenhouse
- 6.2.4. Field Mapping
- 6.2.5. Farm Labour Management
- 6.2.6. Others
- 6.1. Market Analysis, Insights and Forecast - by Offering
- 7. North America Smart Farm Market Analysis, Insights and Forecast, 2020-2032
- 7.1. Market Analysis, Insights and Forecast - by Offering
- 7.1.1. Hardware
- 7.1.2. Software
- 7.1.3. Services
- 7.2. Market Analysis, Insights and Forecast - by Application
- 7.2.1. Precision Farming
- 7.2.2. Livestock Monitoring
- 7.2.3. Smart Greenhouse
- 7.2.4. Field Mapping
- 7.2.5. Farm Labour Management
- 7.2.6. Others
- 7.1. Market Analysis, Insights and Forecast - by Offering
- 8. Europe Smart Farm Market Analysis, Insights and Forecast, 2020-2032
- 8.1. Market Analysis, Insights and Forecast - by Offering
- 8.1.1. Hardware
- 8.1.2. Software
- 8.1.3. Services
- 8.2. Market Analysis, Insights and Forecast - by Application
- 8.2.1. Precision Farming
- 8.2.2. Livestock Monitoring
- 8.2.3. Smart Greenhouse
- 8.2.4. Field Mapping
- 8.2.5. Farm Labour Management
- 8.2.6. Others
- 8.1. Market Analysis, Insights and Forecast - by Offering
- 9. Asia Smart Farm Market Analysis, Insights and Forecast, 2020-2032
- 9.1. Market Analysis, Insights and Forecast - by Offering
- 9.1.1. Hardware
- 9.1.2. Software
- 9.1.3. Services
- 9.2. Market Analysis, Insights and Forecast - by Application
- 9.2.1. Precision Farming
- 9.2.2. Livestock Monitoring
- 9.2.3. Smart Greenhouse
- 9.2.4. Field Mapping
- 9.2.5. Farm Labour Management
- 9.2.6. Others
- 9.1. Market Analysis, Insights and Forecast - by Offering
- 10. Australia and New Zealand Smart Farm Market Analysis, Insights and Forecast, 2020-2032
- 10.1. Market Analysis, Insights and Forecast - by Offering
- 10.1.1. Hardware
- 10.1.2. Software
- 10.1.3. Services
- 10.2. Market Analysis, Insights and Forecast - by Application
- 10.2.1. Precision Farming
- 10.2.2. Livestock Monitoring
- 10.2.3. Smart Greenhouse
- 10.2.4. Field Mapping
- 10.2.5. Farm Labour Management
- 10.2.6. Others
- 10.1. Market Analysis, Insights and Forecast - by Offering
- 11. Latin America Smart Farm Market Analysis, Insights and Forecast, 2020-2032
- 11.1. Market Analysis, Insights and Forecast - by Offering
- 11.1.1. Hardware
- 11.1.2. Software
- 11.1.3. Services
- 11.2. Market Analysis, Insights and Forecast - by Application
- 11.2.1. Precision Farming
- 11.2.2. Livestock Monitoring
- 11.2.3. Smart Greenhouse
- 11.2.4. Field Mapping
- 11.2.5. Farm Labour Management
- 11.2.6. Others
- 11.1. Market Analysis, Insights and Forecast - by Offering
- 12. Middle East and Africa Smart Farm Market Analysis, Insights and Forecast, 2020-2032
- 12.1. Market Analysis, Insights and Forecast - by Offering
- 12.1.1. Hardware
- 12.1.2. Software
- 12.1.3. Services
- 12.2. Market Analysis, Insights and Forecast - by Application
- 12.2.1. Precision Farming
- 12.2.2. Livestock Monitoring
- 12.2.3. Smart Greenhouse
- 12.2.4. Field Mapping
- 12.2.5. Farm Labour Management
- 12.2.6. Others
- 12.1. Market Analysis, Insights and Forecast - by Offering
- 13. Competitive Analysis
- 13.1. Company Profiles
- 13.1.1 Deere & Company
- 13.1.1.1. Company Overview
- 13.1.1.2. Products
- 13.1.1.3. Company Financials
- 13.1.1.4. SWOT Analysis
- 13.1.2 Trimble Inc
- 13.1.2.1. Company Overview
- 13.1.2.2. Products
- 13.1.2.3. Company Financials
- 13.1.2.4. SWOT Analysis
- 13.1.3 Topcon Positioning Systems
- 13.1.3.1. Company Overview
- 13.1.3.2. Products
- 13.1.3.3. Company Financials
- 13.1.3.4. SWOT Analysis
- 13.1.4 Allflex Livestock Intelligence
- 13.1.4.1. Company Overview
- 13.1.4.2. Products
- 13.1.4.3. Company Financials
- 13.1.4.4. SWOT Analysis
- 13.1.5 Farmers Edge Inc
- 13.1.5.1. Company Overview
- 13.1.5.2. Products
- 13.1.5.3. Company Financials
- 13.1.5.4. SWOT Analysis
- 13.1.6 Innovasea Systems Inc
- 13.1.6.1. Company Overview
- 13.1.6.2. Products
- 13.1.6.3. Company Financials
- 13.1.6.4. SWOT Analysis
- 13.1.7 AgriData Incorporated
- 13.1.7.1. Company Overview
- 13.1.7.2. Products
- 13.1.7.3. Company Financials
- 13.1.7.4. SWOT Analysis
- 13.1.8 AGCO Corporation
- 13.1.8.1. Company Overview
- 13.1.8.2. Products
- 13.1.8.3. Company Financials
- 13.1.8.4. SWOT Analysis
- 13.1.9 Gamaya
- 13.1.9.1. Company Overview
- 13.1.9.2. Products
- 13.1.9.3. Company Financials
- 13.1.9.4. SWOT Analysis
- 13.1.10 IBM Corporatio
- 13.1.10.1. Company Overview
- 13.1.10.2. Products
- 13.1.10.3. Company Financials
- 13.1.10.4. SWOT Analysis
- 13.1.1 Deere & Company
- 13.2. Market Entropy
- 13.2.1 Company's Key Areas Served
- 13.2.2 Recent Developments
- 13.3. Company Market Share Analysis 2025
- 13.3.1 Top 5 Companies Market Share Analysis
- 13.3.2 Top 3 Companies Market Share Analysis
- 13.4. List of Potential Customers
- 14. Research Methodology
List of Figures
- Figure 1: Global Smart Farm Market Revenue Breakdown (Million, %) by Region 2025 & 2033
- Figure 2: Global Smart Farm Market Volume Breakdown (Billion, %) by Region 2025 & 2033
- Figure 3: North America Smart Farm Market Revenue (Million), by Offering 2025 & 2033
- Figure 4: North America Smart Farm Market Volume (Billion), by Offering 2025 & 2033
- Figure 5: North America Smart Farm Market Revenue Share (%), by Offering 2025 & 2033
- Figure 6: North America Smart Farm Market Volume Share (%), by Offering 2025 & 2033
- Figure 7: North America Smart Farm Market Revenue (Million), by Application 2025 & 2033
- Figure 8: North America Smart Farm Market Volume (Billion), by Application 2025 & 2033
- Figure 9: North America Smart Farm Market Revenue Share (%), by Application 2025 & 2033
- Figure 10: North America Smart Farm Market Volume Share (%), by Application 2025 & 2033
- Figure 11: North America Smart Farm Market Revenue (Million), by Country 2025 & 2033
- Figure 12: North America Smart Farm Market Volume (Billion), by Country 2025 & 2033
- Figure 13: North America Smart Farm Market Revenue Share (%), by Country 2025 & 2033
- Figure 14: North America Smart Farm Market Volume Share (%), by Country 2025 & 2033
- Figure 15: Europe Smart Farm Market Revenue (Million), by Offering 2025 & 2033
- Figure 16: Europe Smart Farm Market Volume (Billion), by Offering 2025 & 2033
- Figure 17: Europe Smart Farm Market Revenue Share (%), by Offering 2025 & 2033
- Figure 18: Europe Smart Farm Market Volume Share (%), by Offering 2025 & 2033
- Figure 19: Europe Smart Farm Market Revenue (Million), by Application 2025 & 2033
- Figure 20: Europe Smart Farm Market Volume (Billion), by Application 2025 & 2033
- Figure 21: Europe Smart Farm Market Revenue Share (%), by Application 2025 & 2033
- Figure 22: Europe Smart Farm Market Volume Share (%), by Application 2025 & 2033
- Figure 23: Europe Smart Farm Market Revenue (Million), by Country 2025 & 2033
- Figure 24: Europe Smart Farm Market Volume (Billion), by Country 2025 & 2033
- Figure 25: Europe Smart Farm Market Revenue Share (%), by Country 2025 & 2033
- Figure 26: Europe Smart Farm Market Volume Share (%), by Country 2025 & 2033
- Figure 27: Asia Smart Farm Market Revenue (Million), by Offering 2025 & 2033
- Figure 28: Asia Smart Farm Market Volume (Billion), by Offering 2025 & 2033
- Figure 29: Asia Smart Farm Market Revenue Share (%), by Offering 2025 & 2033
- Figure 30: Asia Smart Farm Market Volume Share (%), by Offering 2025 & 2033
- Figure 31: Asia Smart Farm Market Revenue (Million), by Application 2025 & 2033
- Figure 32: Asia Smart Farm Market Volume (Billion), by Application 2025 & 2033
- Figure 33: Asia Smart Farm Market Revenue Share (%), by Application 2025 & 2033
- Figure 34: Asia Smart Farm Market Volume Share (%), by Application 2025 & 2033
- Figure 35: Asia Smart Farm Market Revenue (Million), by Country 2025 & 2033
- Figure 36: Asia Smart Farm Market Volume (Billion), by Country 2025 & 2033
- Figure 37: Asia Smart Farm Market Revenue Share (%), by Country 2025 & 2033
- Figure 38: Asia Smart Farm Market Volume Share (%), by Country 2025 & 2033
- Figure 39: Australia and New Zealand Smart Farm Market Revenue (Million), by Offering 2025 & 2033
- Figure 40: Australia and New Zealand Smart Farm Market Volume (Billion), by Offering 2025 & 2033
- Figure 41: Australia and New Zealand Smart Farm Market Revenue Share (%), by Offering 2025 & 2033
- Figure 42: Australia and New Zealand Smart Farm Market Volume Share (%), by Offering 2025 & 2033
- Figure 43: Australia and New Zealand Smart Farm Market Revenue (Million), by Application 2025 & 2033
- Figure 44: Australia and New Zealand Smart Farm Market Volume (Billion), by Application 2025 & 2033
- Figure 45: Australia and New Zealand Smart Farm Market Revenue Share (%), by Application 2025 & 2033
- Figure 46: Australia and New Zealand Smart Farm Market Volume Share (%), by Application 2025 & 2033
- Figure 47: Australia and New Zealand Smart Farm Market Revenue (Million), by Country 2025 & 2033
- Figure 48: Australia and New Zealand Smart Farm Market Volume (Billion), by Country 2025 & 2033
- Figure 49: Australia and New Zealand Smart Farm Market Revenue Share (%), by Country 2025 & 2033
- Figure 50: Australia and New Zealand Smart Farm Market Volume Share (%), by Country 2025 & 2033
- Figure 51: Latin America Smart Farm Market Revenue (Million), by Offering 2025 & 2033
- Figure 52: Latin America Smart Farm Market Volume (Billion), by Offering 2025 & 2033
- Figure 53: Latin America Smart Farm Market Revenue Share (%), by Offering 2025 & 2033
- Figure 54: Latin America Smart Farm Market Volume Share (%), by Offering 2025 & 2033
- Figure 55: Latin America Smart Farm Market Revenue (Million), by Application 2025 & 2033
- Figure 56: Latin America Smart Farm Market Volume (Billion), by Application 2025 & 2033
- Figure 57: Latin America Smart Farm Market Revenue Share (%), by Application 2025 & 2033
- Figure 58: Latin America Smart Farm Market Volume Share (%), by Application 2025 & 2033
- Figure 59: Latin America Smart Farm Market Revenue (Million), by Country 2025 & 2033
- Figure 60: Latin America Smart Farm Market Volume (Billion), by Country 2025 & 2033
- Figure 61: Latin America Smart Farm Market Revenue Share (%), by Country 2025 & 2033
- Figure 62: Latin America Smart Farm Market Volume Share (%), by Country 2025 & 2033
- Figure 63: Middle East and Africa Smart Farm Market Revenue (Million), by Offering 2025 & 2033
- Figure 64: Middle East and Africa Smart Farm Market Volume (Billion), by Offering 2025 & 2033
- Figure 65: Middle East and Africa Smart Farm Market Revenue Share (%), by Offering 2025 & 2033
- Figure 66: Middle East and Africa Smart Farm Market Volume Share (%), by Offering 2025 & 2033
- Figure 67: Middle East and Africa Smart Farm Market Revenue (Million), by Application 2025 & 2033
- Figure 68: Middle East and Africa Smart Farm Market Volume (Billion), by Application 2025 & 2033
- Figure 69: Middle East and Africa Smart Farm Market Revenue Share (%), by Application 2025 & 2033
- Figure 70: Middle East and Africa Smart Farm Market Volume Share (%), by Application 2025 & 2033
- Figure 71: Middle East and Africa Smart Farm Market Revenue (Million), by Country 2025 & 2033
- Figure 72: Middle East and Africa Smart Farm Market Volume (Billion), by Country 2025 & 2033
- Figure 73: Middle East and Africa Smart Farm Market Revenue Share (%), by Country 2025 & 2033
- Figure 74: Middle East and Africa Smart Farm Market Volume Share (%), by Country 2025 & 2033
List of Tables
- Table 1: Global Smart Farm Market Revenue Million Forecast, by Offering 2020 & 2033
- Table 2: Global Smart Farm Market Volume Billion Forecast, by Offering 2020 & 2033
- Table 3: Global Smart Farm Market Revenue Million Forecast, by Application 2020 & 2033
- Table 4: Global Smart Farm Market Volume Billion Forecast, by Application 2020 & 2033
- Table 5: Global Smart Farm Market Revenue Million Forecast, by Region 2020 & 2033
- Table 6: Global Smart Farm Market Volume Billion Forecast, by Region 2020 & 2033
- Table 7: Global Smart Farm Market Revenue Million Forecast, by Offering 2020 & 2033
- Table 8: Global Smart Farm Market Volume Billion Forecast, by Offering 2020 & 2033
- Table 9: Global Smart Farm Market Revenue Million Forecast, by Application 2020 & 2033
- Table 10: Global Smart Farm Market Volume Billion Forecast, by Application 2020 & 2033
- Table 11: Global Smart Farm Market Revenue Million Forecast, by Country 2020 & 2033
- Table 12: Global Smart Farm Market Volume Billion Forecast, by Country 2020 & 2033
- Table 13: Global Smart Farm Market Revenue Million Forecast, by Offering 2020 & 2033
- Table 14: Global Smart Farm Market Volume Billion Forecast, by Offering 2020 & 2033
- Table 15: Global Smart Farm Market Revenue Million Forecast, by Application 2020 & 2033
- Table 16: Global Smart Farm Market Volume Billion Forecast, by Application 2020 & 2033
- Table 17: Global Smart Farm Market Revenue Million Forecast, by Country 2020 & 2033
- Table 18: Global Smart Farm Market Volume Billion Forecast, by Country 2020 & 2033
- Table 19: Global Smart Farm Market Revenue Million Forecast, by Offering 2020 & 2033
- Table 20: Global Smart Farm Market Volume Billion Forecast, by Offering 2020 & 2033
- Table 21: Global Smart Farm Market Revenue Million Forecast, by Application 2020 & 2033
- Table 22: Global Smart Farm Market Volume Billion Forecast, by Application 2020 & 2033
- Table 23: Global Smart Farm Market Revenue Million Forecast, by Country 2020 & 2033
- Table 24: Global Smart Farm Market Volume Billion Forecast, by Country 2020 & 2033
- Table 25: Global Smart Farm Market Revenue Million Forecast, by Offering 2020 & 2033
- Table 26: Global Smart Farm Market Volume Billion Forecast, by Offering 2020 & 2033
- Table 27: Global Smart Farm Market Revenue Million Forecast, by Application 2020 & 2033
- Table 28: Global Smart Farm Market Volume Billion Forecast, by Application 2020 & 2033
- Table 29: Global Smart Farm Market Revenue Million Forecast, by Country 2020 & 2033
- Table 30: Global Smart Farm Market Volume Billion Forecast, by Country 2020 & 2033
- Table 31: Global Smart Farm Market Revenue Million Forecast, by Offering 2020 & 2033
- Table 32: Global Smart Farm Market Volume Billion Forecast, by Offering 2020 & 2033
- Table 33: Global Smart Farm Market Revenue Million Forecast, by Application 2020 & 2033
- Table 34: Global Smart Farm Market Volume Billion Forecast, by Application 2020 & 2033
- Table 35: Global Smart Farm Market Revenue Million Forecast, by Country 2020 & 2033
- Table 36: Global Smart Farm Market Volume Billion Forecast, by Country 2020 & 2033
- Table 37: Global Smart Farm Market Revenue Million Forecast, by Offering 2020 & 2033
- Table 38: Global Smart Farm Market Volume Billion Forecast, by Offering 2020 & 2033
- Table 39: Global Smart Farm Market Revenue Million Forecast, by Application 2020 & 2033
- Table 40: Global Smart Farm Market Volume Billion Forecast, by Application 2020 & 2033
- Table 41: Global Smart Farm Market Revenue Million Forecast, by Country 2020 & 2033
- Table 42: Global Smart Farm Market Volume Billion Forecast, by Country 2020 & 2033
Frequently Asked Questions
1. What is the projected Compound Annual Growth Rate (CAGR) of the Smart Farm Market?
The projected CAGR is approximately 9.80%.
2. Which companies are prominent players in the Smart Farm Market?
Key companies in the market include Deere & Company, Trimble Inc, Topcon Positioning Systems, Allflex Livestock Intelligence, Farmers Edge Inc, Innovasea Systems Inc, AgriData Incorporated, AGCO Corporation, Gamaya, IBM Corporatio.
3. What are the main segments of the Smart Farm Market?
The market segments include Offering, Application.
4. Can you provide details about the market size?
The market size is estimated to be USD 16.82 Million as of 2022.
5. What are some drivers contributing to market growth?
Increasing Adoption of Advanced Farming Technologies; Rising Government Initiative to Boost the Agriculture Industry in Emerging Economies.
6. What are the notable trends driving market growth?
Precision Farming is Expected to Hold Major Market Share.
7. Are there any restraints impacting market growth?
Increasing Adoption of Advanced Farming Technologies; Rising Government Initiative to Boost the Agriculture Industry in Emerging Economies.
8. Can you provide examples of recent developments in the market?
February 2024 - AgriData revealed that its innovative solutions improve agricultural practices for growers by utilizing AI-powered crop monitoring technology specifically tailored for greenhouses. The company obtained further investment from its existing investors. This influx of capital enables the company to accelerate its market’s growth and enhance the development of its camera systems and computer vision software.
9. What pricing options are available for accessing the report?
Pricing options include single-user, multi-user, and enterprise licenses priced at USD 4750, USD 5250, and USD 8750 respectively.
10. Is the market size provided in terms of value or volume?
The market size is provided in terms of value, measured in Million and volume, measured in Billion.
11. Are there any specific market keywords associated with the report?
Yes, the market keyword associated with the report is "Smart Farm Market," which aids in identifying and referencing the specific market segment covered.
12. How do I determine which pricing option suits my needs best?
The pricing options vary based on user requirements and access needs. Individual users may opt for single-user licenses, while businesses requiring broader access may choose multi-user or enterprise licenses for cost-effective access to the report.
13. Are there any additional resources or data provided in the Smart Farm Market report?
While the report offers comprehensive insights, it's advisable to review the specific contents or supplementary materials provided to ascertain if additional resources or data are available.
14. How can I stay updated on further developments or reports in the Smart Farm Market?
To stay informed about further developments, trends, and reports in the Smart Farm Market, consider subscribing to industry newsletters, following relevant companies and organizations, or regularly checking reputable industry news sources and publications.
Methodology
Step 1 - Identification of Relevant Samples Size from Population Database


Step 2 - Approaches for Defining Global Market Size (Value, Volume* & Price*)

Note*: In applicable scenarios
Step 3 - Data Sources
Primary Research
- Web Analytics
- Survey Reports
- Research Institute
- Latest Research Reports
- Opinion Leaders
Secondary Research
- Annual Reports
- White Paper
- Latest Press Release
- Industry Association
- Paid Database
- Investor Presentations

Step 4 - Data Triangulation
Involves using different sources of information in order to increase the validity of a study
These sources are likely to be stakeholders in a program - participants, other researchers, program staff, other community members, and so on.
Then we put all data in single framework & apply various statistical tools to find out the dynamic on the market.
During the analysis stage, feedback from the stakeholder groups would be compared to determine areas of agreement as well as areas of divergence