

Key Insights
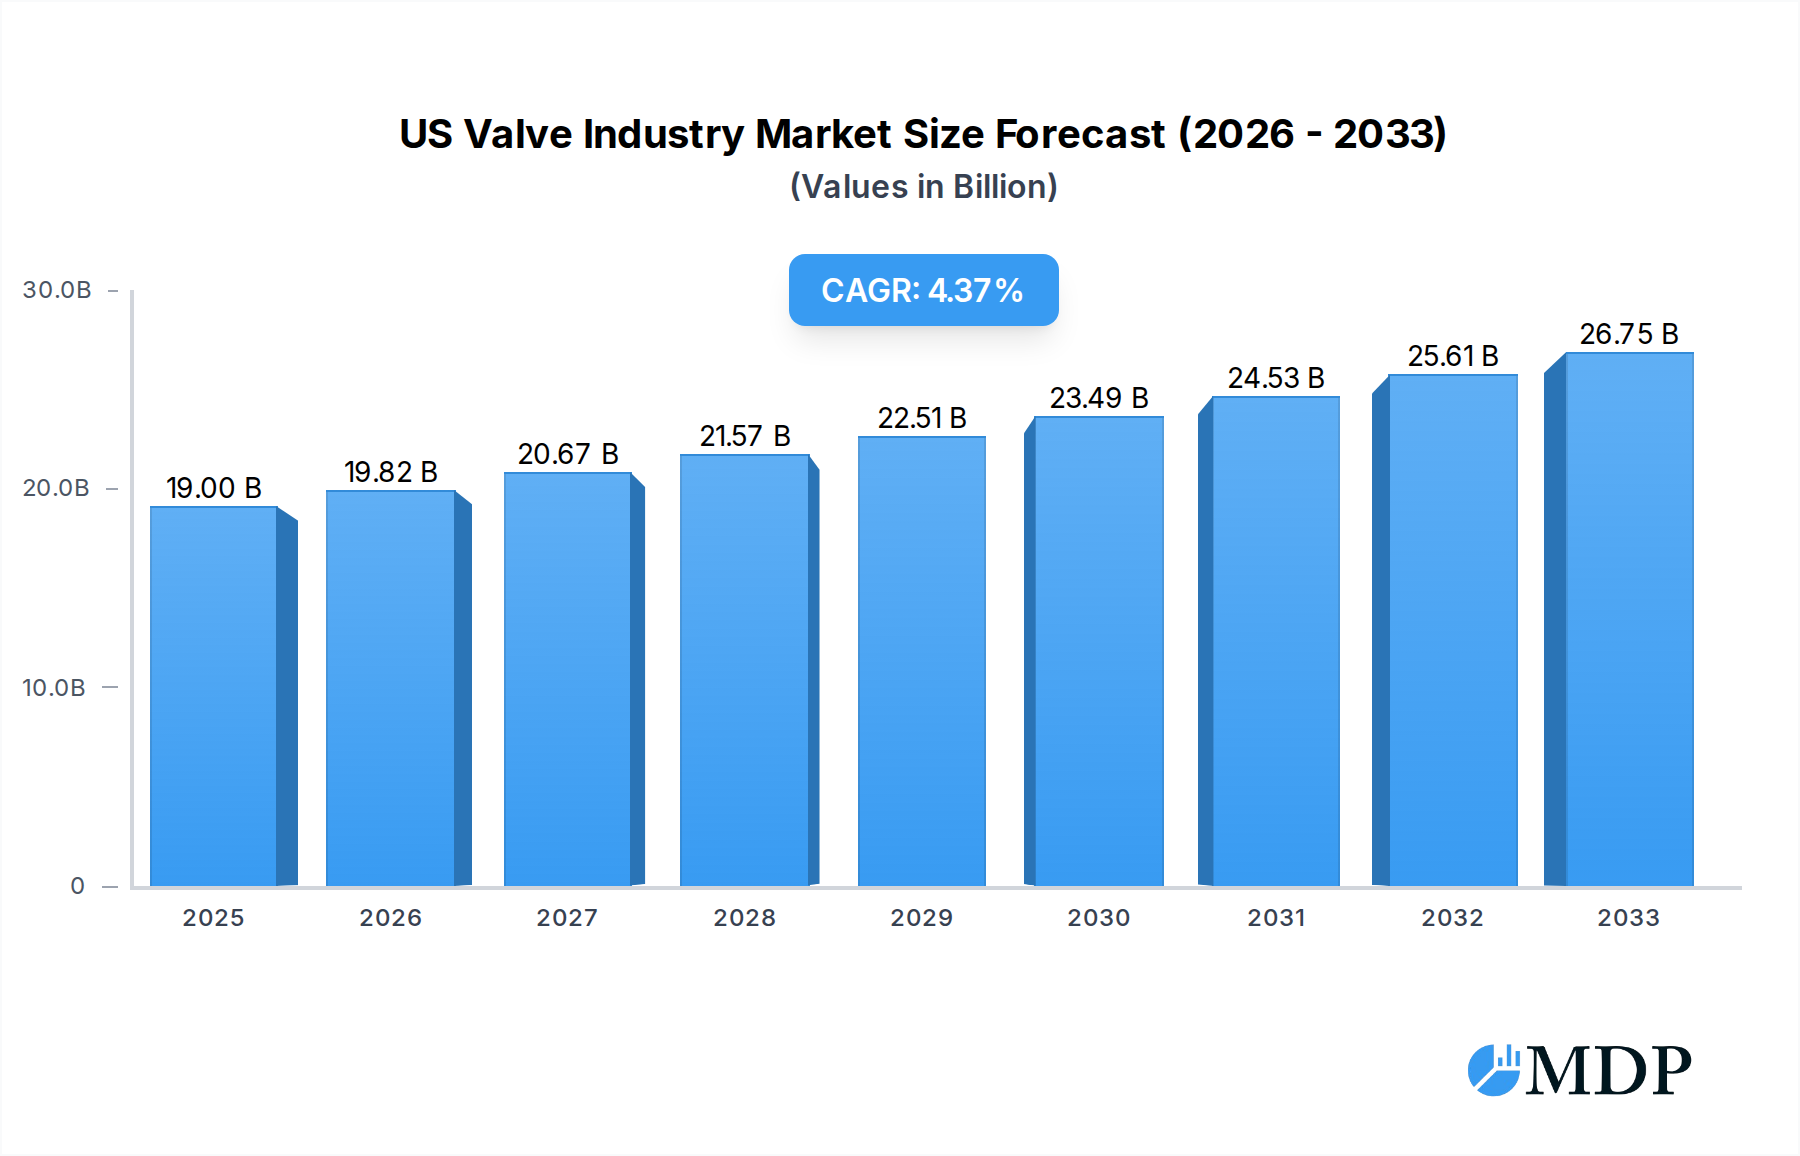
The US Valve Industry is poised for significant growth, with the market size estimated at $19 billion in 2025. Driven by robust demand from key sectors such as oil & gas, water & wastewater, power generation, and chemical processing, the industry is expected to expand at a Compound Annual Growth Rate (CAGR) of 4.3% through 2033. The increasing need for modernized infrastructure, coupled with stringent regulations for safety and environmental compliance, acts as a primary catalyst for this upward trajectory. Furthermore, advancements in smart valve technology, incorporating IoT capabilities for remote monitoring, predictive maintenance, and enhanced operational efficiency, are creating new avenues for market expansion. Investments in renewable energy projects and the continued development of industrial facilities will further fuel the demand for a diverse range of valve types.

US Valve Industry Market Size (In Billion)
Despite the promising outlook, certain factors could temper this growth. Supply chain disruptions, volatile raw material prices, and the high initial cost of advanced valve systems present potential restraints. However, the industry is actively addressing these challenges through diversified sourcing strategies and the development of more cost-effective smart solutions. The US market exhibits a strong focus on high-performance and specialized valves, with significant activity observed in production, consumption, imports, and exports. Key players like Rotork Plc, Flowserve Corporation, and Emerson Electric Co. are actively innovating and competing to capture market share, indicating a dynamic and competitive landscape. The ongoing digital transformation within industries is a significant trend, pushing for the adoption of automated and intelligent valve solutions.
US Valve Industry Company Market Share
Unlocking the Power of Precision: A Comprehensive Report on the US Valve Industry (2019–2033)
This in-depth report provides a definitive analysis of the US Valve Industry, a critical sector underpinning numerous industrial processes and infrastructure projects. Covering the historical period of 2019–2024, the base and estimated year of 2025, and projecting through the forecast period of 2025–2033, this comprehensive study delves into market dynamics, key trends, leading players, and future opportunities. With an estimated market value poised to reach billions and a projected Compound Annual Growth Rate (CAGR) of xx%, this report is an essential resource for manufacturers, suppliers, investors, and stakeholders seeking to navigate this vital and evolving market. We meticulously examine production, consumption, import/export volumes and values, price trends, and groundbreaking product developments, offering actionable insights for strategic decision-making in the face of technological advancements and shifting economic landscapes.
US Valve Industry Market Dynamics & Concentration
The US valve industry is characterized by a moderate to high concentration, with a few major players holding significant market share while a vibrant ecosystem of smaller, specialized manufacturers caters to niche demands. Innovation is a primary driver, fueled by the relentless pursuit of enhanced efficiency, safety, and sustainability across end-use sectors. Regulatory frameworks, particularly those pertaining to environmental protection and operational safety, significantly shape product development and market entry. The threat of product substitutes remains low for core valve functionalities, though advancements in smart technologies and integrated control systems are redefining product offerings. End-user trends are heavily influenced by the need for reduced energy consumption, leak prevention, and digital integration, driving demand for advanced control valves and smart valve solutions. Mergers and acquisitions (M&A) activities are a recurring theme, indicating consolidation and strategic expansion by leading companies. For instance, the period has seen an estimated xx M&A deals, with transaction values reaching into the billions, as companies aim to broaden their product portfolios and geographic reach. Market share analysis reveals that companies like Flowserve Corporation and Emerson Electric Co. command substantial portions of the overall market, though specialized segments offer opportunities for agile players.
US Valve Industry Industry Trends & Analysis
The US valve industry is experiencing robust growth, driven by a confluence of factors including increasing industrial automation, aging infrastructure requiring modernization, and the expanding energy sector. The compound annual growth rate (CAGR) for the industry is estimated to be xx% over the forecast period, with market penetration deepening across various industrial applications. Technological disruptions are at the forefront, with the integration of IoT capabilities, predictive maintenance sensors, and advanced materials transforming traditional valve designs. This shift towards "smart valves" is enhancing real-time monitoring, remote diagnostics, and proactive issue resolution, leading to significant operational cost savings for end-users. Consumer preferences are increasingly leaning towards valves that offer superior leak detection, energy efficiency, and compliance with stringent environmental regulations. The competitive landscape is dynamic, with established giants competing against innovative startups, each vying for market share through product differentiation, strategic partnerships, and a keen understanding of evolving end-user needs. For example, the adoption of advanced process control in chemical processing and the growing demand for energy-efficient solutions in the building automation sector are significant market growth drivers. The rise of specialized valves for critical applications, such as those found in the oil and gas downstream sector and the pharmaceutical industry, further contributes to the industry's expansion. The market penetration of digitally enabled valves is projected to reach xx% by 2033, highlighting a significant trend towards smart solutions.
Leading Markets & Segments in US Valve Industry
The Production Analysis: for the US valve industry is heavily concentrated in regions with robust manufacturing bases and a strong presence of key end-use industries such as oil & gas, chemical processing, and power generation. States like Texas, known for its extensive energy infrastructure, and the industrial heartland of the Midwest are leading production hubs. The Consumption Analysis: mirrors this concentration, with these same industrial sectors being the largest consumers of valves, driven by their continuous operational needs and expansion projects. The Import Market Analysis (Value & Volume): indicates a significant volume of imports, particularly for specialized valves and components where domestic production may be less cost-competitive or technologically advanced. The value of these imports is estimated to be in the billions annually. Key drivers for imports include competitive pricing from international manufacturers and access to unique product offerings. The Export Market Analysis (Value & Volume): showcases the strength of US valve manufacturers in global markets, with exports also valued in the billions. The US exports high-performance, technologically advanced valves, particularly to countries undergoing significant industrial development or requiring specialized solutions for critical applications. Economic policies that promote fair trade and international industrial growth act as key drivers for export markets. The Price Trend Analysis: reveals a steady upward trend, influenced by raw material costs, technological advancements, and increasing demand for higher-specification valves. Inflationary pressures have also contributed to price increases, with the average price of industrial valves projected to rise by xx% over the forecast period.
- Production Dominance: States with strong petrochemical, refining, and manufacturing sectors lead in production.
- Consumption Drivers: Oil & Gas, chemical processing, water & wastewater, and power generation are the primary consumption segments.
- Import Influences: Cost-effectiveness for standard components and access to niche technologies drive import volumes.
- Export Strengths: High-performance, engineered valves for critical infrastructure and industrial applications define US export competitiveness.
- Price Influences: Raw material volatility, R&D investment, and demand for specialized features dictate price trends.
US Valve Industry Product Developments
Recent product innovations in the US valve industry are focused on enhancing efficiency, safety, and smart capabilities. A prime example is Belimo Americas' June 2021 launch of a 6-way pressure-independent control valve, featuring hydronically decoupled heating and cooling circuits and an innovative ball design for 100% leakage protection. This significantly reduces energy losses and operating costs. Similarly, Warren Controls introduced its ILEA 5800E Series in January 2021, offering high-quality, modulating, linear, electrically actuated industrial globe control valves. These developments highlight a market trend towards sophisticated, integrated valve solutions that deliver superior performance and environmental benefits, giving manufacturers a competitive edge in meeting the stringent demands of modern industrial applications.
Key Drivers of US Valve Industry Growth
Several key drivers are propelling growth in the US valve industry. Technological advancements are paramount, with the integration of smart technologies, IoT connectivity, and advanced materials enhancing valve functionality and enabling predictive maintenance. The robust demand from the oil and gas sector, particularly for exploration and production, as well as downstream refining and petrochemical operations, continues to be a significant growth catalyst. Infrastructure development projects, including upgrades to water and wastewater treatment facilities and the expansion of power generation capabilities, also contribute substantially. Furthermore, increasingly stringent environmental regulations and a global push for energy efficiency are driving the adoption of high-performance, leak-proof, and energy-saving valve solutions across all industrial segments.
Challenges in the US Valve Industry Market
Despite robust growth prospects, the US valve industry faces several challenges. Fluctuations in raw material prices, particularly for metals like stainless steel and alloys, can impact manufacturing costs and profit margins. Supply chain disruptions, as witnessed in recent years, pose a significant risk to timely production and delivery. Navigating complex and evolving regulatory landscapes, especially concerning environmental compliance and safety standards, requires continuous adaptation and investment. Intense competition, both domestically and internationally, puts pressure on pricing and necessitates constant innovation to maintain market share. The skilled labor shortage in specialized manufacturing roles also presents a hurdle for companies aiming to scale production and embrace advanced manufacturing techniques.
Emerging Opportunities in US Valve Industry
Emerging opportunities in the US valve industry are abundant and poised to shape its future trajectory. The growing adoption of Industry 4.0 principles is creating demand for smart valves equipped with advanced sensors and connectivity for real-time data analysis and remote operation, opening avenues for billions in new revenue streams. The increasing focus on sustainability and decarbonization across industries is driving demand for specialized valves in renewable energy sectors, such as solar and wind power, and in carbon capture technologies. Strategic partnerships between valve manufacturers and technology providers are accelerating the development and deployment of innovative solutions. Furthermore, the global push for infrastructure modernization, particularly in emerging economies, presents significant export opportunities for US-manufactured high-performance valves.
Leading Players in the US Valve Industry Sector
- Rotork Plc
- Flowserve Corporation
- American Production Valve
- Flow Line Valve and Controls
- Crane Holdings Co
- Emerson Electric Co
- Valve Solutions
- Valtorc International
- Schlumberger Limited
Key Milestones in US Valve Industry Industry
- June 2021: Belimo Americas launched a new 6-way pressure-independent control valve with features hydronically decoupled heating and cooling circuits with the integration of an innovative ball design. The valve provides 100% leakage protection in the closed position, preventing energy losses, improving efficiency, and reducing operating costs.
- January 2021: Warren Controls, the US manufacturer of control valves and specialty fluid handling products has introduced its new ILEA 5800E Series of high-quality, modulating, linear, electrically actuated industrial globe control valves.
Strategic Outlook for US Valve Industry Market
The strategic outlook for the US valve industry is exceptionally positive, driven by ongoing technological innovation and persistent demand from critical industrial sectors. Future growth will likely be fueled by the increasing integration of digital technologies, leading to the development of more sophisticated, self-diagnostic, and energy-efficient valve systems. Companies that invest in advanced materials and manufacturing processes, while also focusing on sustainability and compliance with evolving environmental regulations, will be best positioned for success. Strategic acquisitions and partnerships will continue to play a crucial role in market consolidation and the expansion of product portfolios. The growing emphasis on operational efficiency and safety across industries will ensure a sustained demand for high-performance valve solutions, creating lucrative opportunities for market leaders and agile innovators alike.
US Valve Industry Segmentation
- 1. Production Analysis
- 2. Consumption Analysis
- 3. Import Market Analysis (Value & Volume)
- 4. Export Market Analysis (Value & Volume)
- 5. Price Trend Analysis
US Valve Industry Segmentation By Geography
- 1. United States
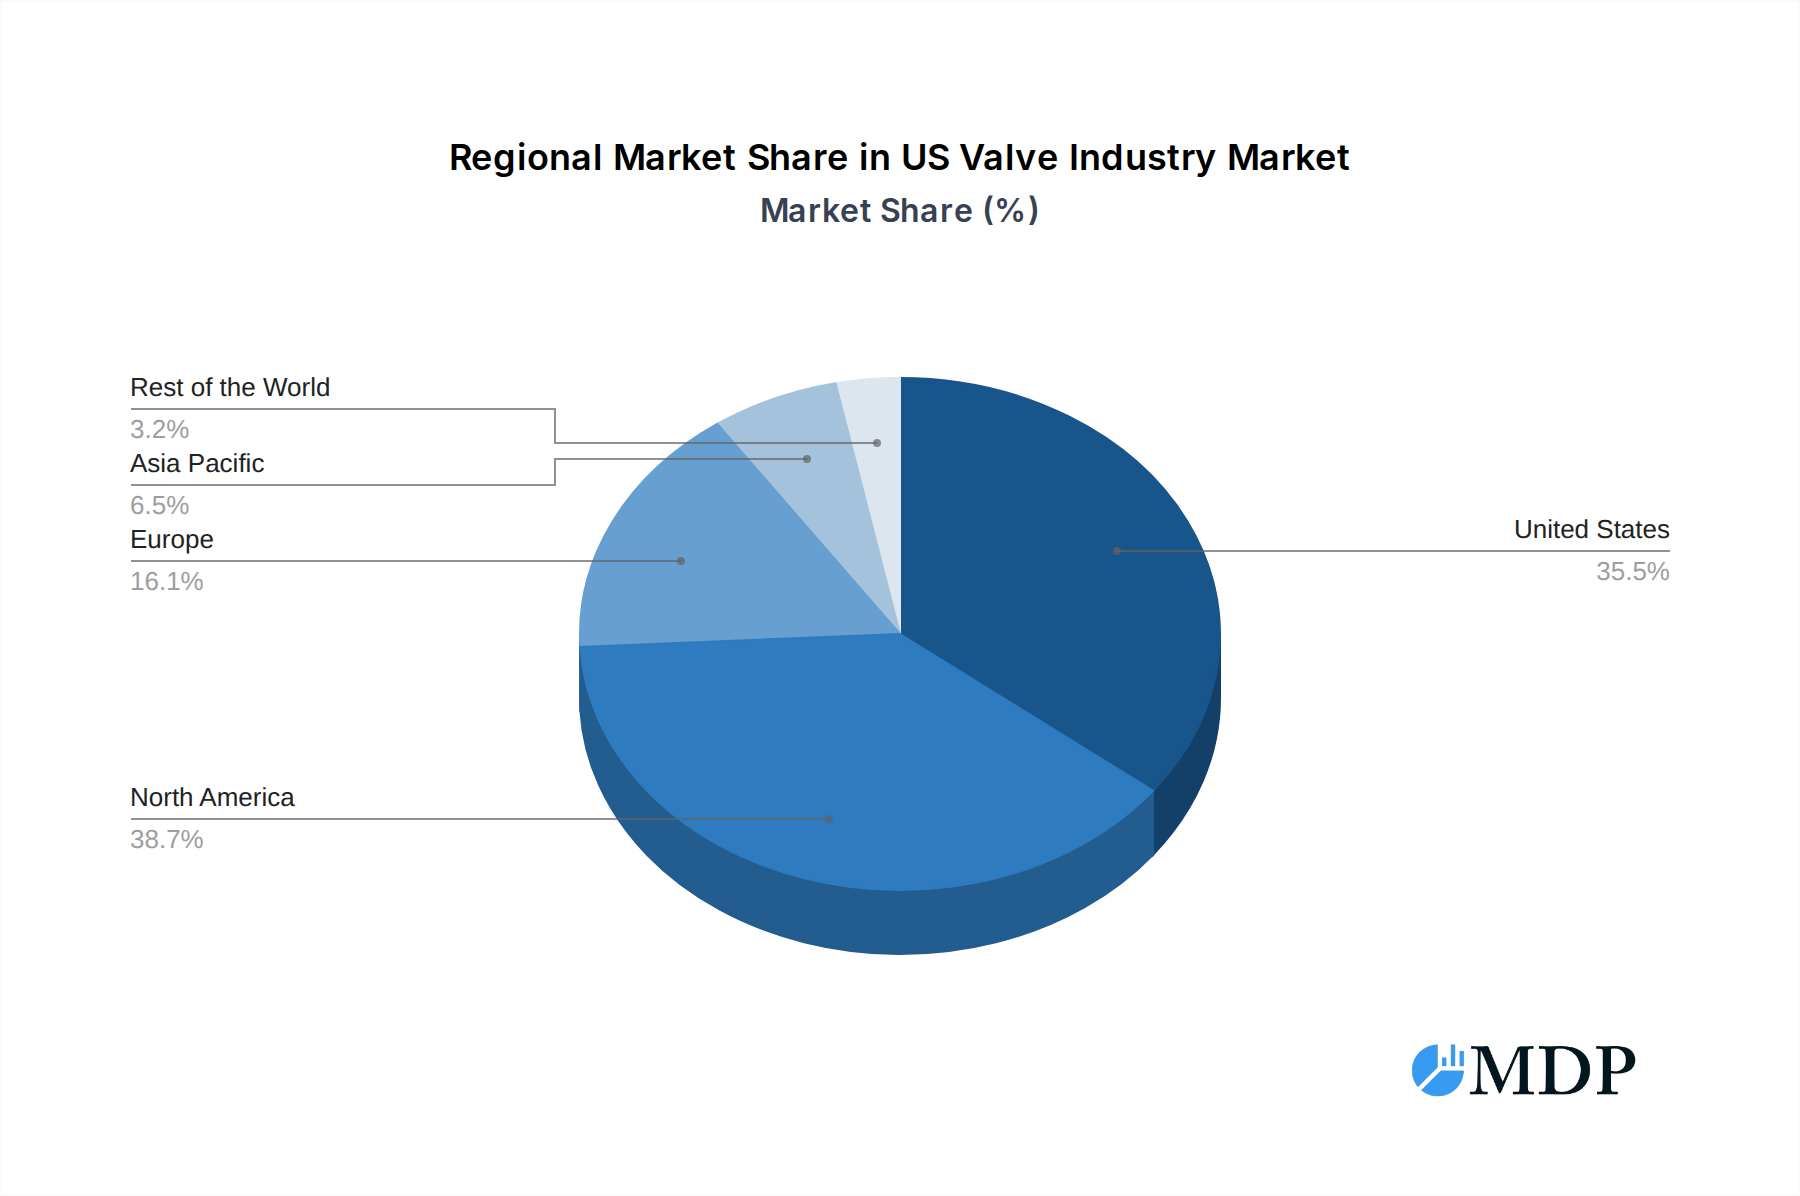
US Valve Industry Regional Market Share
Geographic Coverage of US Valve Industry
US Valve Industry REPORT HIGHLIGHTS
| Aspects | Details |
|---|---|
| Study Period | 2020-2034 |
| Base Year | 2025 |
| Estimated Year | 2026 |
| Forecast Period | 2026-2034 |
| Historical Period | 2020-2025 |
| Growth Rate | CAGR of 4.3% from 2020-2034 |
| Segmentation |
|
Table of Contents
- 1. Introduction
- 1.1. Research Scope
- 1.2. Market Segmentation
- 1.3. Research Objective
- 1.4. Definitions and Assumptions
- 2. Executive Summary
- 2.1. Market Snapshot
- 3. Market Dynamics
- 3.1. Market Drivers
- 3.2. Market Restrains
- 3.3. Market Trends
- 3.4. Market Opportunities
- 4. Market Factor Analysis
- 4.1. Porters Five Forces
- 4.1.1. Bargaining Power of Suppliers
- 4.1.2. Bargaining Power of Buyers
- 4.1.3. Threat of New Entrants
- 4.1.4. Threat of Substitutes
- 4.1.5. Competitive Rivalry
- 4.2. PESTEL analysis
- 4.3. BCG Analysis
- 4.3.1. Stars (High Growth, High Market Share)
- 4.3.2. Cash Cows (Low Growth, High Market Share)
- 4.3.3. Question Mark (High Growth, Low Market Share)
- 4.3.4. Dogs (Low Growth, Low Market Share)
- 4.4. Ansoff Matrix Analysis
- 4.5. Supply Chain Analysis
- 4.6. Regulatory Landscape
- 4.7. Current Market Potential and Opportunity Assessment (TAM–SAM–SOM Framework)
- 4.8. MDP Analyst Note
- 4.1. Porters Five Forces
- 5. Market Analysis, Insights and Forecast 2021-2033
- 5.1. Market Analysis, Insights and Forecast - by Production Analysis
- 5.2. Market Analysis, Insights and Forecast - by Consumption Analysis
- 5.3. Market Analysis, Insights and Forecast - by Import Market Analysis (Value & Volume)
- 5.4. Market Analysis, Insights and Forecast - by Export Market Analysis (Value & Volume)
- 5.5. Market Analysis, Insights and Forecast - by Price Trend Analysis
- 5.6. Market Analysis, Insights and Forecast - by Region
- 5.6.1. United States
- 6. US Valve Industry Analysis, Insights and Forecast, 2021-2033
- 6.1. Market Analysis, Insights and Forecast - by Production Analysis
- 6.2. Market Analysis, Insights and Forecast - by Consumption Analysis
- 6.3. Market Analysis, Insights and Forecast - by Import Market Analysis (Value & Volume)
- 6.4. Market Analysis, Insights and Forecast - by Export Market Analysis (Value & Volume)
- 6.5. Market Analysis, Insights and Forecast - by Price Trend Analysis
- 7. Competitive Analysis
- 7.1. Company Profiles
- 7.1.1 Rotork Plc
- 7.1.1.1. Company Overview
- 7.1.1.2. Products
- 7.1.1.3. Company Financials
- 7.1.1.4. SWOT Analysis
- 7.1.2 Flowserve Corporation
- 7.1.2.1. Company Overview
- 7.1.2.2. Products
- 7.1.2.3. Company Financials
- 7.1.2.4. SWOT Analysis
- 7.1.3 American Production Valve
- 7.1.3.1. Company Overview
- 7.1.3.2. Products
- 7.1.3.3. Company Financials
- 7.1.3.4. SWOT Analysis
- 7.1.4 Flow Line Valve and Controls
- 7.1.4.1. Company Overview
- 7.1.4.2. Products
- 7.1.4.3. Company Financials
- 7.1.4.4. SWOT Analysis
- 7.1.5 Crane Holdings Co
- 7.1.5.1. Company Overview
- 7.1.5.2. Products
- 7.1.5.3. Company Financials
- 7.1.5.4. SWOT Analysis
- 7.1.6 Emerson Electric Co
- 7.1.6.1. Company Overview
- 7.1.6.2. Products
- 7.1.6.3. Company Financials
- 7.1.6.4. SWOT Analysis
- 7.1.7 Valve Solutions
- 7.1.7.1. Company Overview
- 7.1.7.2. Products
- 7.1.7.3. Company Financials
- 7.1.7.4. SWOT Analysis
- 7.1.8 Valtorc International
- 7.1.8.1. Company Overview
- 7.1.8.2. Products
- 7.1.8.3. Company Financials
- 7.1.8.4. SWOT Analysis
- 7.1.9 Schlumberger Limited
- 7.1.9.1. Company Overview
- 7.1.9.2. Products
- 7.1.9.3. Company Financials
- 7.1.9.4. SWOT Analysis
- 7.1.1 Rotork Plc
- 7.2. Market Entropy
- 7.2.1 Company's Key Areas Served
- 7.2.2 Recent Developments
- 7.3. Company Market Share Analysis 2025
- 7.3.1 Top 5 Companies Market Share Analysis
- 7.3.2 Top 3 Companies Market Share Analysis
- 7.4. List of Potential Customers
- 8. Research Methodology
List of Figures
- Figure 1: US Valve Industry Revenue Breakdown (billion, %) by Product 2025 & 2033
- Figure 2: US Valve Industry Share (%) by Company 2025
List of Tables
- Table 1: US Valve Industry Revenue billion Forecast, by Production Analysis 2020 & 2033
- Table 2: US Valve Industry Volume K Unit Forecast, by Production Analysis 2020 & 2033
- Table 3: US Valve Industry Revenue billion Forecast, by Consumption Analysis 2020 & 2033
- Table 4: US Valve Industry Volume K Unit Forecast, by Consumption Analysis 2020 & 2033
- Table 5: US Valve Industry Revenue billion Forecast, by Import Market Analysis (Value & Volume) 2020 & 2033
- Table 6: US Valve Industry Volume K Unit Forecast, by Import Market Analysis (Value & Volume) 2020 & 2033
- Table 7: US Valve Industry Revenue billion Forecast, by Export Market Analysis (Value & Volume) 2020 & 2033
- Table 8: US Valve Industry Volume K Unit Forecast, by Export Market Analysis (Value & Volume) 2020 & 2033
- Table 9: US Valve Industry Revenue billion Forecast, by Price Trend Analysis 2020 & 2033
- Table 10: US Valve Industry Volume K Unit Forecast, by Price Trend Analysis 2020 & 2033
- Table 11: US Valve Industry Revenue billion Forecast, by Region 2020 & 2033
- Table 12: US Valve Industry Volume K Unit Forecast, by Region 2020 & 2033
- Table 13: US Valve Industry Revenue billion Forecast, by Production Analysis 2020 & 2033
- Table 14: US Valve Industry Volume K Unit Forecast, by Production Analysis 2020 & 2033
- Table 15: US Valve Industry Revenue billion Forecast, by Consumption Analysis 2020 & 2033
- Table 16: US Valve Industry Volume K Unit Forecast, by Consumption Analysis 2020 & 2033
- Table 17: US Valve Industry Revenue billion Forecast, by Import Market Analysis (Value & Volume) 2020 & 2033
- Table 18: US Valve Industry Volume K Unit Forecast, by Import Market Analysis (Value & Volume) 2020 & 2033
- Table 19: US Valve Industry Revenue billion Forecast, by Export Market Analysis (Value & Volume) 2020 & 2033
- Table 20: US Valve Industry Volume K Unit Forecast, by Export Market Analysis (Value & Volume) 2020 & 2033
- Table 21: US Valve Industry Revenue billion Forecast, by Price Trend Analysis 2020 & 2033
- Table 22: US Valve Industry Volume K Unit Forecast, by Price Trend Analysis 2020 & 2033
- Table 23: US Valve Industry Revenue billion Forecast, by Country 2020 & 2033
- Table 24: US Valve Industry Volume K Unit Forecast, by Country 2020 & 2033
Frequently Asked Questions
1. What is the projected Compound Annual Growth Rate (CAGR) of the US Valve Industry?
The projected CAGR is approximately 4.3%.
2. Which companies are prominent players in the US Valve Industry?
Key companies in the market include Rotork Plc, Flowserve Corporation, American Production Valve, Flow Line Valve and Controls, Crane Holdings Co, Emerson Electric Co, Valve Solutions, Valtorc International, Schlumberger Limited.
3. What are the main segments of the US Valve Industry?
The market segments include Production Analysis, Consumption Analysis, Import Market Analysis (Value & Volume), Export Market Analysis (Value & Volume), Price Trend Analysis.
4. Can you provide details about the market size?
The market size is estimated to be USD 19 billion as of 2022.
5. What are some drivers contributing to market growth?
Increasing Demand of Valves in Oil & Gas Industry; Rising Adoption of Automation Technologies in Process Industries.
6. What are the notable trends driving market growth?
Growing Adoption of Automation in Processing.
7. Are there any restraints impacting market growth?
Lack of standardized certifications and government policies.
8. Can you provide examples of recent developments in the market?
June 2021 - Belimo Americas launched a new 6-way pressure-independent control valve with features hydronically decoupled heating and cooling circuits with the integration of an innovative ball design. The valve provides 100% leakage protection in the closed position, preventing energy losses, improving efficiency, and reducing operating costs.
9. What pricing options are available for accessing the report?
Pricing options include single-user, multi-user, and enterprise licenses priced at USD 3800, USD 4500, and USD 5800 respectively.
10. Is the market size provided in terms of value or volume?
The market size is provided in terms of value, measured in billion and volume, measured in K Unit.
11. Are there any specific market keywords associated with the report?
Yes, the market keyword associated with the report is "US Valve Industry," which aids in identifying and referencing the specific market segment covered.
12. How do I determine which pricing option suits my needs best?
The pricing options vary based on user requirements and access needs. Individual users may opt for single-user licenses, while businesses requiring broader access may choose multi-user or enterprise licenses for cost-effective access to the report.
13. Are there any additional resources or data provided in the US Valve Industry report?
While the report offers comprehensive insights, it's advisable to review the specific contents or supplementary materials provided to ascertain if additional resources or data are available.
14. How can I stay updated on further developments or reports in the US Valve Industry?
To stay informed about further developments, trends, and reports in the US Valve Industry, consider subscribing to industry newsletters, following relevant companies and organizations, or regularly checking reputable industry news sources and publications.
Methodology
Step 1 - Identification of Relevant Samples Size from Population Database


Step 2 - Approaches for Defining Global Market Size (Value, Volume* & Price*)

Note*: In applicable scenarios
Step 3 - Data Sources
Primary Research
- Web Analytics
- Survey Reports
- Research Institute
- Latest Research Reports
- Opinion Leaders
Secondary Research
- Annual Reports
- White Paper
- Latest Press Release
- Industry Association
- Paid Database
- Investor Presentations

Step 4 - Data Triangulation
Involves using different sources of information in order to increase the validity of a study
These sources are likely to be stakeholders in a program - participants, other researchers, program staff, other community members, and so on.
Then we put all data in single framework & apply various statistical tools to find out the dynamic on the market.
During the analysis stage, feedback from the stakeholder groups would be compared to determine areas of agreement as well as areas of divergence