

Key Insights
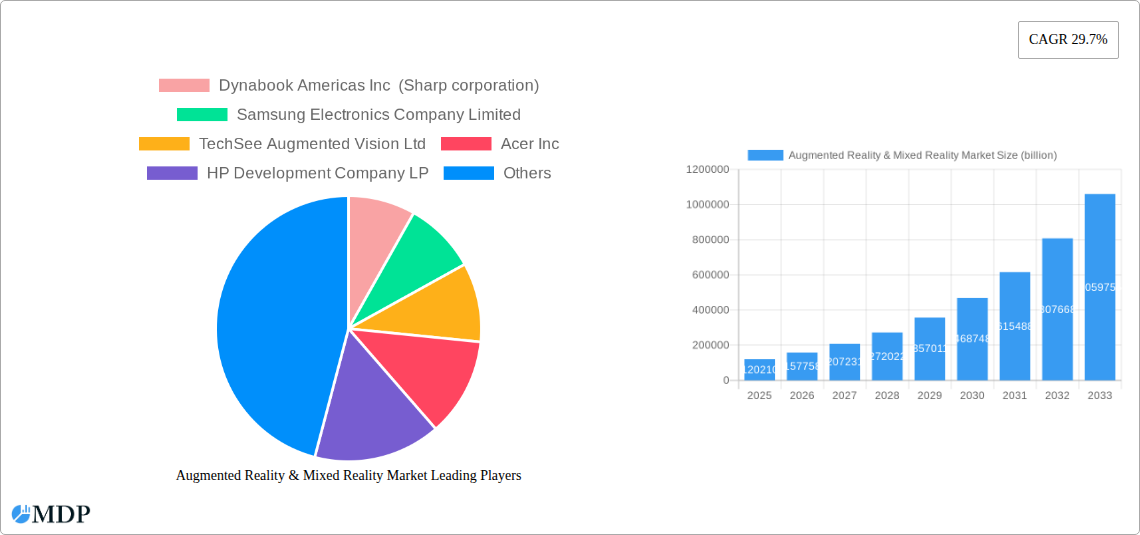
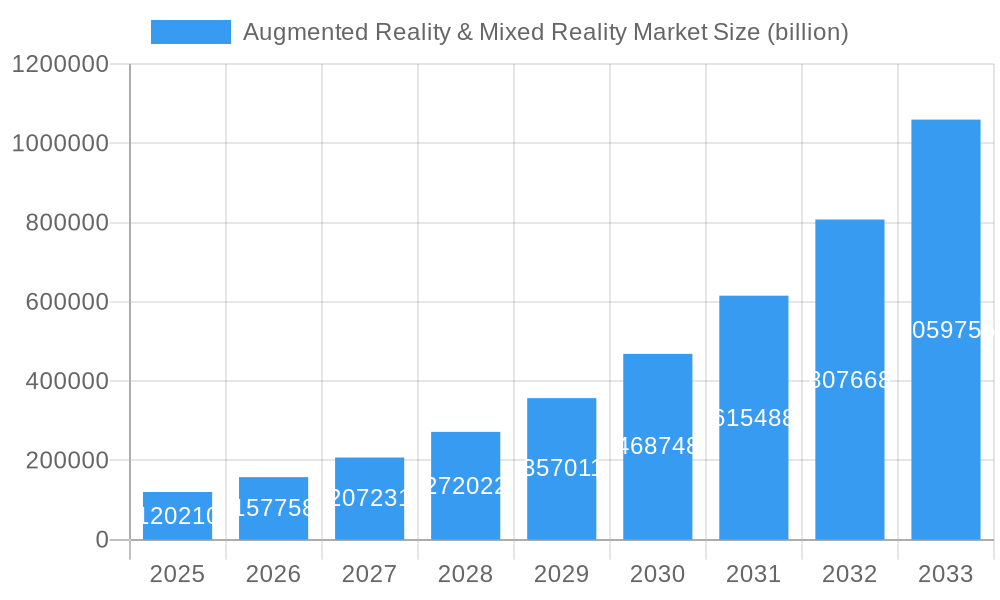
The Augmented Reality (AR) and Mixed Reality (MR) market is poised for exceptional growth, projecting a robust market size of $120.21 billion by 2025, fueled by a remarkable 29.7% CAGR. This rapid expansion is driven by transformative applications across diverse industries. The gaming sector, a foundational segment, continues to innovate, while education is leveraging AR/MR for immersive and interactive learning experiences. The healthcare industry is adopting these technologies for surgical planning, patient education, and remote diagnostics, significantly enhancing precision and accessibility. Retail and advertising are seeing a surge in personalized customer engagement through virtual try-ons and interactive product showcases. Furthermore, the automotive sector is utilizing AR for advanced driver-assistance systems and in-car information displays, while military and defense applications are benefiting from enhanced situational awareness and training capabilities. The increasing adoption of AR/MR hardware, including smart glasses and headsets, coupled with advancements in sophisticated software platforms, forms the bedrock of this market's dynamism.
Augmented Reality & Mixed Reality Market Market Size (In Billion)
The market's trajectory is further shaped by emerging trends such as the convergence of AR/MR with artificial intelligence (AI) and the Internet of Things (IoT), creating more intelligent and interconnected experiences. The development of more accessible and affordable AR/MR devices is expanding consumer adoption beyond niche applications. While significant opportunities exist, challenges such as the high cost of some advanced hardware, the need for greater content development standardization, and ensuring user privacy and data security will need to be addressed. Key players like Microsoft, Google, Meta, and emerging innovators are investing heavily in research and development, fostering a competitive landscape that will continue to drive innovation and market penetration. The interplay between hardware advancements, software sophistication, and a growing understanding of practical applications across various end-user verticals will dictate the market's continued upward momentum.
Augmented Reality & Mixed Reality Market Company Market Share
Augmented Reality & Mixed Reality Market: Unlocking Immersive Futures - Comprehensive Market Analysis Report (2019-2033)
Dive into the rapidly evolving Augmented Reality (AR) and Mixed Reality (MR) market with our definitive report. Spanning from 2019 to 2033, with a deep dive into the 2025 base and estimated year, this comprehensive analysis provides unparalleled insights into market dynamics, technological advancements, and future growth trajectories. We dissect the industry's transformation, from groundbreaking product developments to strategic M&A activities, offering actionable intelligence for stakeholders across Gaming, Education, Healthcare, Retail, Automotive, Military, and beyond. Explore market penetration, CAGR, and the competitive landscape, understanding how key players like Microsoft Corporation, Google LLC (Alphabet Inc.), and Samsung Electronics Company Limited are shaping the immersive future.
Augmented Reality & Mixed Reality Market Market Dynamics & Concentration
The Augmented Reality (AR) & Mixed Reality (MR) market is characterized by a dynamic and moderately concentrated landscape, driven by relentless innovation and increasing adoption across diverse sectors. Innovation is primarily fueled by advancements in display technologies, processing power, and AI algorithms, enabling more sophisticated and seamless user experiences. Regulatory frameworks, while still evolving, are beginning to address data privacy and ethical considerations, influencing product development and deployment strategies. Product substitutes, such as advanced mobile AR applications, pose a competitive challenge, yet dedicated AR/MR hardware continues to offer superior immersive capabilities. End-user trends show a growing demand for AR/MR solutions in industrial training, remote assistance, and consumer entertainment, pushing the market towards wider commercialization. Mergers & Acquisitions (M&A) activity is on the rise as established tech giants and innovative startups consolidate to gain market share and accelerate technological development. The number of significant M&A deals is projected to increase by approximately 15% year-over-year. Market share for leading hardware manufacturers is currently distributed, with key players holding between 8% and 15% each, highlighting both opportunity for growth and the presence of strong competition.
Augmented Reality & Mixed Reality Market Industry Trends & Analysis
The Augmented Reality (AR) & Mixed Reality (MR) market is experiencing robust growth, propelled by a confluence of technological breakthroughs, expanding applications, and shifting consumer preferences. The projected Compound Annual Growth Rate (CAGR) for the market is an impressive 25.7% during the forecast period of 2025–2033. This significant expansion is a direct result of escalating investments in research and development, leading to more powerful, affordable, and user-friendly AR/MR devices. Technological disruptions, particularly in the realm of micro-LED displays and advanced optics, are revolutionizing the visual fidelity and form factor of AR/MR hardware, making them more suitable for everyday use. Consumer preferences are increasingly leaning towards immersive experiences, driving demand for AR/MR in gaming, virtual try-ons, and enhanced social interactions. In the enterprise sector, AR/MR is proving invaluable for improving efficiency in training, maintenance, design, and remote collaboration. The competitive dynamics within the market are intensifying, with both established technology giants and agile startups vying for market dominance. This competition fosters rapid innovation and a continuous stream of new product launches and feature enhancements. Market penetration, while still in its nascent stages for widespread consumer adoption, is rapidly increasing in specialized industrial and professional use cases. The integration of AI and machine learning with AR/MR systems is further enhancing their capabilities, enabling more intelligent and context-aware applications, thereby accelerating their adoption across a wider spectrum of industries.
Leading Markets & Segments in Augmented Reality & Mixed Reality Market
The Augmented Reality (AR) & Mixed Reality (MR) market exhibits diverse strengths across its various segments and geographical regions.
Dominant Segments by Type:
- Hardware: The AR/MR hardware segment is a critical driver, encompassing headsets, smart glasses, and other wearable devices. The increasing demand for immersive experiences in both consumer and enterprise applications fuels this segment. Key drivers include technological advancements in display resolution, field of view, and processing power, as well as declining manufacturing costs. Companies like Microsoft Corporation and Magic Leap Inc. are making significant contributions.
- Software: The AR/MR software segment, including applications, platforms, and development tools, is crucial for enabling the functionality of hardware. Growth is spurred by the need for sophisticated applications in gaming, education, healthcare, and industrial training. Factors such as the development of intuitive user interfaces, robust content creation tools, and the integration of AI are key drivers. Google LLC (Alphabet Inc.) and PTC Inc. are prominent players in this space.
Dominant Segments by End-user Vertical:
- Gaming: This sector has consistently been an early adopter, showcasing the entertainment potential of AR/MR. Innovations in interactive gameplay and the development of dedicated AR/MR gaming hardware continue to drive adoption. The desire for more engaging and immersive gaming experiences is the primary driver.
- Healthcare: The medical and healthcare sector is a rapidly expanding frontier for AR/MR. Applications range from surgical training and planning to remote patient monitoring and visualization of medical data. Key drivers include the potential to improve surgical precision, enhance medical education, and facilitate remote consultations. TechSee Augmented Vision Ltd and Realwear Inc. are contributing to this vertical.
- Industrial: The industrial segment, including manufacturing, logistics, and maintenance, is witnessing substantial AR/MR adoption. AR/MR solutions are used for complex task guidance, remote expert assistance, and augmented training, leading to increased efficiency and reduced errors. The need for improved worker productivity and safety is a significant driver. Dell Technologies Inc. and Vuzix Corporation are key contributors.
- Military and Defense: This vertical leverages AR/MR for enhanced situational awareness, training simulations, and tactical decision-making. The demand for advanced capabilities in complex operational environments drives significant investment and development.
Dominant Regions:
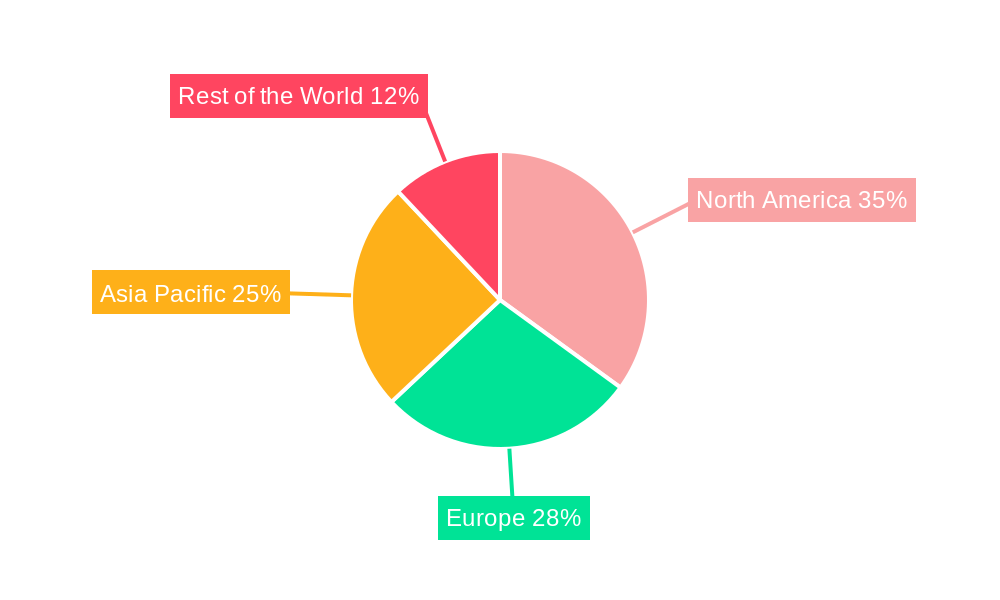
- North America: This region is a frontrunner due to strong technological infrastructure, significant R&D investments, and a large consumer base receptive to new technologies. The presence of leading tech companies and a robust venture capital ecosystem further bolster its dominance.
- Asia Pacific: Rapid digitalization, a growing middle class, and increasing government initiatives to promote technological adoption are propelling the AR/MR market in this region. Countries like China and Japan are making substantial strides in both hardware and software development.
Augmented Reality & Mixed Reality Market Product Developments
Product developments in the AR/MR market are characterized by a relentless pursuit of enhanced immersion, functionality, and user comfort. Innovations focus on improving display technologies for higher resolution and wider fields of view, reducing form factor for increased portability, and integrating advanced sensors for more accurate environmental mapping and interaction. Software advancements are concentrating on intuitive user interfaces, realistic rendering, and the seamless integration of AI for intelligent scene understanding and personalized experiences. Competitive advantages are being forged through proprietary hardware designs, unique software algorithms, and strategic partnerships that expand application ecosystems. The trend towards lighter, more powerful, and versatile AR/MR devices is a significant market differentiator.
Key Drivers of Augmented Reality & Mixed Reality Market Growth
The Augmented Reality (AR) & Mixed Reality (MR) market's impressive growth is fueled by several key factors. Technological advancements, particularly in display resolutions, processing power, and sensor technology, are making AR/MR devices more capable and accessible. Economic factors, including increasing enterprise investment in digital transformation and growing consumer disposable income, are supporting market expansion. Regulatory support, in the form of initiatives promoting innovation and addressing data privacy, also plays a crucial role. Furthermore, the expanding ecosystem of developers creating compelling AR/MR applications across gaming, education, and industrial sectors is a significant growth catalyst.
Challenges in the Augmented Reality & Mixed Reality Market Market
Despite its promising trajectory, the AR/MR market faces notable challenges. High device costs remain a barrier to mass consumer adoption, although prices are gradually decreasing. Developing compelling and high-quality AR/MR content that justifies investment is an ongoing challenge. Concerns regarding data privacy and security, as well as the potential for motion sickness or user discomfort with extended use, need to be addressed. Furthermore, establishing standardized interoperability between different AR/MR platforms and devices is crucial for wider market integration and preventing fragmentation. Supply chain complexities for specialized components can also impact production scalability.
Emerging Opportunities in Augmented Reality & Mixed Reality Market
The Augmented Reality (AR) & Mixed Reality (MR) market is ripe with emerging opportunities. The continued advancement of micro-LED display technology by companies like Micledi Microdisplays and the strategic agreements for mLED display solutions by Vuzix Corporation signal significant progress in visual fidelity. The burgeoning metaverse concept presents a vast new frontier for AR/MR applications, driving demand for immersive social experiences, virtual commerce, and digital asset interaction. Growth in enterprise solutions for remote collaboration, augmented training, and industrial automation offers substantial revenue streams. Strategic partnerships between hardware manufacturers, software developers, and content creators are crucial for building robust ecosystems and accelerating market penetration. The expansion of AR/MR capabilities into new verticals like personalized retail experiences and advanced automotive dashboards further unlocks growth potential.
Leading Players in the Augmented Reality & Mixed Reality Market Sector
- Dynabook Americas Inc (Sharp corporation)
- Samsung Electronics Company Limited
- TechSee Augmented Vision Ltd
- Acer Inc
- HP Development Company LP
- Magic Leap Inc
- Amber Garage (Holokit)
- Wikitude GMBH
- Google LLC (Alphabet Inc )
- Microsoft Corporation
- Vuzix Corporation
- Ultraleap Limited
- AsusTek Computer Inc
- Seiko Epson Corporation
- PTC Inc
- Niantic Inc
- Dell Technologies Inc
- Occipital Inc
- Realwear Inc
- Atheer Inc
- Optinvent
- Blippar com Ltd
Key Milestones in Augmented Reality & Mixed Reality Market Industry
- October 2022: Micledi Microdisplays and Kura Technologies announced a collaboration to manufacture AR glasses, integrating MICLEDI's 300mm microLED displays for enhanced performance in Kura's next-generation AR headsets.
- May 2022: Vuzix Corporation announced an agreement with Atomistic SAS for the design of a custom backplane and exclusive licensing of key mLED technology, aimed at supporting upcoming mLEDs for AR glasses.
Strategic Outlook for Augmented Reality & Mixed Reality Market Market
The strategic outlook for the Augmented Reality (AR) & Mixed Reality (MR) market is exceptionally positive, driven by accelerating innovation and expanding adoption. Key growth accelerators include the continued refinement of hardware, making devices lighter, more powerful, and visually superior, as evidenced by advancements in micro-LED technology. The growing demand for immersive experiences in both enterprise and consumer sectors, particularly fueled by the evolving metaverse landscape, presents a significant opportunity. Strategic partnerships and ecosystem development will be critical for success, fostering wider accessibility and application diversity. Focus on enterprise solutions for training, remote assistance, and design will continue to drive significant market penetration, while consumer applications in gaming and social interaction are poised for substantial growth. The market's future trajectory is one of increasing integration into daily life and professional workflows, promising transformative impacts across industries.
Augmented Reality & Mixed Reality Market Segmentation
-
1. Type
- 1.1. Hardware
- 1.2. Software
-
2. End-user Vertical
- 2.1. Gaming
- 2.2. Education
- 2.3. Healthcare
- 2.4. Retail and Advertising
- 2.5. Automotive
- 2.6. Military and Defense
- 2.7. Other End-user Verticals
-
3. End-user Vertical
- 3.1. Consumer
- 3.2. Medical and Healthcare
- 3.3. Industrial
- 3.4. Other End-user
Augmented Reality & Mixed Reality Market Segmentation By Geography
- 1. North America
- 2. Europe
- 3. Asia Pacific
- 4. Rest of the World
- 5. North America
- 6. Europe
- 7. Asia Pacific
- 8. Rest of the World
Augmented Reality & Mixed Reality Market Regional Market Share
Geographic Coverage of Augmented Reality & Mixed Reality Market
Augmented Reality & Mixed Reality Market REPORT HIGHLIGHTS
| Aspects | Details |
|---|---|
| Study Period | 2020-2034 |
| Base Year | 2025 |
| Estimated Year | 2026 |
| Forecast Period | 2026-2034 |
| Historical Period | 2020-2025 |
| Growth Rate | CAGR of 29.7% from 2020-2034 |
| Segmentation |
|
Table of Contents
- 1. Introduction
- 1.1. Research Scope
- 1.2. Market Segmentation
- 1.3. Research Objective
- 1.4. Definitions and Assumptions
- 2. Executive Summary
- 2.1. Market Snapshot
- 3. Market Dynamics
- 3.1. Market Drivers
- 3.2. Market Restrains
- 3.3. Market Trends
- 3.4. Market Opportunities
- 4. Market Factor Analysis
- 4.1. Porters Five Forces
- 4.1.1. Bargaining Power of Suppliers
- 4.1.2. Bargaining Power of Buyers
- 4.1.3. Threat of New Entrants
- 4.1.4. Threat of Substitutes
- 4.1.5. Competitive Rivalry
- 4.2. PESTEL analysis
- 4.3. BCG Analysis
- 4.3.1. Stars (High Growth, High Market Share)
- 4.3.2. Cash Cows (Low Growth, High Market Share)
- 4.3.3. Question Mark (High Growth, Low Market Share)
- 4.3.4. Dogs (Low Growth, Low Market Share)
- 4.4. Ansoff Matrix Analysis
- 4.5. Supply Chain Analysis
- 4.6. Regulatory Landscape
- 4.7. Current Market Potential and Opportunity Assessment (TAM–SAM–SOM Framework)
- 4.8. MDP Analyst Note
- 4.1. Porters Five Forces
- 5. Market Analysis, Insights and Forecast 2021-2033
- 5.1. Market Analysis, Insights and Forecast - by Type
- 5.1.1. Hardware
- 5.1.2. Software
- 5.2. Market Analysis, Insights and Forecast - by End-user Vertical
- 5.2.1. Gaming
- 5.2.2. Education
- 5.2.3. Healthcare
- 5.2.4. Retail and Advertising
- 5.2.5. Automotive
- 5.2.6. Military and Defense
- 5.2.7. Other End-user Verticals
- 5.3. Market Analysis, Insights and Forecast - by End-user Vertical
- 5.3.1. Consumer
- 5.3.2. Medical and Healthcare
- 5.3.3. Industrial
- 5.3.4. Other End-user
- 5.4. Market Analysis, Insights and Forecast - by Region
- 5.4.1. North America
- 5.4.2. Europe
- 5.4.3. Asia Pacific
- 5.4.4. Rest of the World
- 5.4.5. North America
- 5.4.6. Europe
- 5.4.7. Asia Pacific
- 5.4.8. Rest of the World
- 5.1. Market Analysis, Insights and Forecast - by Type
- 6. Global Augmented Reality & Mixed Reality Market Analysis, Insights and Forecast, 2021-2033
- 6.1. Market Analysis, Insights and Forecast - by Type
- 6.1.1. Hardware
- 6.1.2. Software
- 6.2. Market Analysis, Insights and Forecast - by End-user Vertical
- 6.2.1. Gaming
- 6.2.2. Education
- 6.2.3. Healthcare
- 6.2.4. Retail and Advertising
- 6.2.5. Automotive
- 6.2.6. Military and Defense
- 6.2.7. Other End-user Verticals
- 6.3. Market Analysis, Insights and Forecast - by End-user Vertical
- 6.3.1. Consumer
- 6.3.2. Medical and Healthcare
- 6.3.3. Industrial
- 6.3.4. Other End-user
- 6.1. Market Analysis, Insights and Forecast - by Type
- 7. North America Augmented Reality & Mixed Reality Market Analysis, Insights and Forecast, 2020-2032
- 7.1. Market Analysis, Insights and Forecast - by Type
- 7.1.1. Hardware
- 7.1.2. Software
- 7.2. Market Analysis, Insights and Forecast - by End-user Vertical
- 7.2.1. Gaming
- 7.2.2. Education
- 7.2.3. Healthcare
- 7.2.4. Retail and Advertising
- 7.2.5. Automotive
- 7.2.6. Military and Defense
- 7.2.7. Other End-user Verticals
- 7.3. Market Analysis, Insights and Forecast - by End-user Vertical
- 7.3.1. Consumer
- 7.3.2. Medical and Healthcare
- 7.3.3. Industrial
- 7.3.4. Other End-user
- 7.1. Market Analysis, Insights and Forecast - by Type
- 8. Europe Augmented Reality & Mixed Reality Market Analysis, Insights and Forecast, 2020-2032
- 8.1. Market Analysis, Insights and Forecast - by Type
- 8.1.1. Hardware
- 8.1.2. Software
- 8.2. Market Analysis, Insights and Forecast - by End-user Vertical
- 8.2.1. Gaming
- 8.2.2. Education
- 8.2.3. Healthcare
- 8.2.4. Retail and Advertising
- 8.2.5. Automotive
- 8.2.6. Military and Defense
- 8.2.7. Other End-user Verticals
- 8.3. Market Analysis, Insights and Forecast - by End-user Vertical
- 8.3.1. Consumer
- 8.3.2. Medical and Healthcare
- 8.3.3. Industrial
- 8.3.4. Other End-user
- 8.1. Market Analysis, Insights and Forecast - by Type
- 9. Asia Pacific Augmented Reality & Mixed Reality Market Analysis, Insights and Forecast, 2020-2032
- 9.1. Market Analysis, Insights and Forecast - by Type
- 9.1.1. Hardware
- 9.1.2. Software
- 9.2. Market Analysis, Insights and Forecast - by End-user Vertical
- 9.2.1. Gaming
- 9.2.2. Education
- 9.2.3. Healthcare
- 9.2.4. Retail and Advertising
- 9.2.5. Automotive
- 9.2.6. Military and Defense
- 9.2.7. Other End-user Verticals
- 9.3. Market Analysis, Insights and Forecast - by End-user Vertical
- 9.3.1. Consumer
- 9.3.2. Medical and Healthcare
- 9.3.3. Industrial
- 9.3.4. Other End-user
- 9.1. Market Analysis, Insights and Forecast - by Type
- 10. Rest of the World Augmented Reality & Mixed Reality Market Analysis, Insights and Forecast, 2020-2032
- 10.1. Market Analysis, Insights and Forecast - by Type
- 10.1.1. Hardware
- 10.1.2. Software
- 10.2. Market Analysis, Insights and Forecast - by End-user Vertical
- 10.2.1. Gaming
- 10.2.2. Education
- 10.2.3. Healthcare
- 10.2.4. Retail and Advertising
- 10.2.5. Automotive
- 10.2.6. Military and Defense
- 10.2.7. Other End-user Verticals
- 10.3. Market Analysis, Insights and Forecast - by End-user Vertical
- 10.3.1. Consumer
- 10.3.2. Medical and Healthcare
- 10.3.3. Industrial
- 10.3.4. Other End-user
- 10.1. Market Analysis, Insights and Forecast - by Type
- 11. North America Augmented Reality & Mixed Reality Market Analysis, Insights and Forecast, 2020-2032
- 11.1. Market Analysis, Insights and Forecast - by Type
- 11.1.1. Hardware
- 11.1.2. Software
- 11.2. Market Analysis, Insights and Forecast - by End-user Vertical
- 11.2.1. Gaming
- 11.2.2. Education
- 11.2.3. Healthcare
- 11.2.4. Retail and Advertising
- 11.2.5. Automotive
- 11.2.6. Military and Defense
- 11.2.7. Other End-user Verticals
- 11.3. Market Analysis, Insights and Forecast - by End-user Vertical
- 11.3.1. Consumer
- 11.3.2. Medical and Healthcare
- 11.3.3. Industrial
- 11.3.4. Other End-user
- 11.1. Market Analysis, Insights and Forecast - by Type
- 12. Europe Augmented Reality & Mixed Reality Market Analysis, Insights and Forecast, 2020-2032
- 12.1. Market Analysis, Insights and Forecast - by Type
- 12.1.1. Hardware
- 12.1.2. Software
- 12.2. Market Analysis, Insights and Forecast - by End-user Vertical
- 12.2.1. Gaming
- 12.2.2. Education
- 12.2.3. Healthcare
- 12.2.4. Retail and Advertising
- 12.2.5. Automotive
- 12.2.6. Military and Defense
- 12.2.7. Other End-user Verticals
- 12.3. Market Analysis, Insights and Forecast - by End-user Vertical
- 12.3.1. Consumer
- 12.3.2. Medical and Healthcare
- 12.3.3. Industrial
- 12.3.4. Other End-user
- 12.1. Market Analysis, Insights and Forecast - by Type
- 13. Asia Pacific Augmented Reality & Mixed Reality Market Analysis, Insights and Forecast, 2020-2032
- 13.1. Market Analysis, Insights and Forecast - by Type
- 13.1.1. Hardware
- 13.1.2. Software
- 13.2. Market Analysis, Insights and Forecast - by End-user Vertical
- 13.2.1. Gaming
- 13.2.2. Education
- 13.2.3. Healthcare
- 13.2.4. Retail and Advertising
- 13.2.5. Automotive
- 13.2.6. Military and Defense
- 13.2.7. Other End-user Verticals
- 13.3. Market Analysis, Insights and Forecast - by End-user Vertical
- 13.3.1. Consumer
- 13.3.2. Medical and Healthcare
- 13.3.3. Industrial
- 13.3.4. Other End-user
- 13.1. Market Analysis, Insights and Forecast - by Type
- 14. Rest of the World Augmented Reality & Mixed Reality Market Analysis, Insights and Forecast, 2020-2032
- 14.1. Market Analysis, Insights and Forecast - by Type
- 14.1.1. Hardware
- 14.1.2. Software
- 14.2. Market Analysis, Insights and Forecast - by End-user Vertical
- 14.2.1. Gaming
- 14.2.2. Education
- 14.2.3. Healthcare
- 14.2.4. Retail and Advertising
- 14.2.5. Automotive
- 14.2.6. Military and Defense
- 14.2.7. Other End-user Verticals
- 14.3. Market Analysis, Insights and Forecast - by End-user Vertical
- 14.3.1. Consumer
- 14.3.2. Medical and Healthcare
- 14.3.3. Industrial
- 14.3.4. Other End-user
- 14.1. Market Analysis, Insights and Forecast - by Type
- 15. Competitive Analysis
- 15.1. Company Profiles
- 15.1.1 Dynabook Americas Inc (Sharp corporation)
- 15.1.1.1. Company Overview
- 15.1.1.2. Products
- 15.1.1.3. Company Financials
- 15.1.1.4. SWOT Analysis
- 15.1.2 Samsung Electronics Company Limited
- 15.1.2.1. Company Overview
- 15.1.2.2. Products
- 15.1.2.3. Company Financials
- 15.1.2.4. SWOT Analysis
- 15.1.3 TechSee Augmented Vision Ltd
- 15.1.3.1. Company Overview
- 15.1.3.2. Products
- 15.1.3.3. Company Financials
- 15.1.3.4. SWOT Analysis
- 15.1.4 Acer Inc
- 15.1.4.1. Company Overview
- 15.1.4.2. Products
- 15.1.4.3. Company Financials
- 15.1.4.4. SWOT Analysis
- 15.1.5 HP Development Company LP
- 15.1.5.1. Company Overview
- 15.1.5.2. Products
- 15.1.5.3. Company Financials
- 15.1.5.4. SWOT Analysis
- 15.1.6 Magic Leap Inc
- 15.1.6.1. Company Overview
- 15.1.6.2. Products
- 15.1.6.3. Company Financials
- 15.1.6.4. SWOT Analysis
- 15.1.7 Amber Garage (Holokit)
- 15.1.7.1. Company Overview
- 15.1.7.2. Products
- 15.1.7.3. Company Financials
- 15.1.7.4. SWOT Analysis
- 15.1.8 Wikitude GMBH
- 15.1.8.1. Company Overview
- 15.1.8.2. Products
- 15.1.8.3. Company Financials
- 15.1.8.4. SWOT Analysis
- 15.1.9 Google LLC (Alphabet Inc )
- 15.1.9.1. Company Overview
- 15.1.9.2. Products
- 15.1.9.3. Company Financials
- 15.1.9.4. SWOT Analysis
- 15.1.10 Microsoft Corporation
- 15.1.10.1. Company Overview
- 15.1.10.2. Products
- 15.1.10.3. Company Financials
- 15.1.10.4. SWOT Analysis
- 15.1.11 Vuzix Corporation
- 15.1.11.1. Company Overview
- 15.1.11.2. Products
- 15.1.11.3. Company Financials
- 15.1.11.4. SWOT Analysis
- 15.1.12 Ultraleap Limited
- 15.1.12.1. Company Overview
- 15.1.12.2. Products
- 15.1.12.3. Company Financials
- 15.1.12.4. SWOT Analysis
- 15.1.13 AsusTek Computer Inc
- 15.1.13.1. Company Overview
- 15.1.13.2. Products
- 15.1.13.3. Company Financials
- 15.1.13.4. SWOT Analysis
- 15.1.14 Seiko Epson Corporation
- 15.1.14.1. Company Overview
- 15.1.14.2. Products
- 15.1.14.3. Company Financials
- 15.1.14.4. SWOT Analysis
- 15.1.15 PTC Inc
- 15.1.15.1. Company Overview
- 15.1.15.2. Products
- 15.1.15.3. Company Financials
- 15.1.15.4. SWOT Analysis
- 15.1.16 Niantic Inc
- 15.1.16.1. Company Overview
- 15.1.16.2. Products
- 15.1.16.3. Company Financials
- 15.1.16.4. SWOT Analysis
- 15.1.17 Dell Technologies Inc
- 15.1.17.1. Company Overview
- 15.1.17.2. Products
- 15.1.17.3. Company Financials
- 15.1.17.4. SWOT Analysis
- 15.1.18 Occipital Inc
- 15.1.18.1. Company Overview
- 15.1.18.2. Products
- 15.1.18.3. Company Financials
- 15.1.18.4. SWOT Analysis
- 15.1.19 Realwear Inc
- 15.1.19.1. Company Overview
- 15.1.19.2. Products
- 15.1.19.3. Company Financials
- 15.1.19.4. SWOT Analysis
- 15.1.20 Atheer Inc
- 15.1.20.1. Company Overview
- 15.1.20.2. Products
- 15.1.20.3. Company Financials
- 15.1.20.4. SWOT Analysis
- 15.1.21 Optinvent
- 15.1.21.1. Company Overview
- 15.1.21.2. Products
- 15.1.21.3. Company Financials
- 15.1.21.4. SWOT Analysis
- 15.1.22 Blippar com Ltd
- 15.1.22.1. Company Overview
- 15.1.22.2. Products
- 15.1.22.3. Company Financials
- 15.1.22.4. SWOT Analysis
- 15.1.1 Dynabook Americas Inc (Sharp corporation)
- 15.2. Market Entropy
- 15.2.1 Company's Key Areas Served
- 15.2.2 Recent Developments
- 15.3. Company Market Share Analysis 2025
- 15.3.1 Top 5 Companies Market Share Analysis
- 15.3.2 Top 3 Companies Market Share Analysis
- 15.4. List of Potential Customers
- 16. Research Methodology
List of Figures
- Figure 1: Global Augmented Reality & Mixed Reality Market Revenue Breakdown (billion, %) by Region 2025 & 2033
- Figure 2: Global Augmented Reality & Mixed Reality Market Volume Breakdown (K Unit, %) by Region 2025 & 2033
- Figure 3: North America Augmented Reality & Mixed Reality Market Revenue (billion), by Type 2025 & 2033
- Figure 4: North America Augmented Reality & Mixed Reality Market Volume (K Unit), by Type 2025 & 2033
- Figure 5: North America Augmented Reality & Mixed Reality Market Revenue Share (%), by Type 2025 & 2033
- Figure 6: North America Augmented Reality & Mixed Reality Market Volume Share (%), by Type 2025 & 2033
- Figure 7: North America Augmented Reality & Mixed Reality Market Revenue (billion), by End-user Vertical 2025 & 2033
- Figure 8: North America Augmented Reality & Mixed Reality Market Volume (K Unit), by End-user Vertical 2025 & 2033
- Figure 9: North America Augmented Reality & Mixed Reality Market Revenue Share (%), by End-user Vertical 2025 & 2033
- Figure 10: North America Augmented Reality & Mixed Reality Market Volume Share (%), by End-user Vertical 2025 & 2033
- Figure 11: North America Augmented Reality & Mixed Reality Market Revenue (billion), by End-user Vertical 2025 & 2033
- Figure 12: North America Augmented Reality & Mixed Reality Market Volume (K Unit), by End-user Vertical 2025 & 2033
- Figure 13: North America Augmented Reality & Mixed Reality Market Revenue Share (%), by End-user Vertical 2025 & 2033
- Figure 14: North America Augmented Reality & Mixed Reality Market Volume Share (%), by End-user Vertical 2025 & 2033
- Figure 15: North America Augmented Reality & Mixed Reality Market Revenue (billion), by Country 2025 & 2033
- Figure 16: North America Augmented Reality & Mixed Reality Market Volume (K Unit), by Country 2025 & 2033
- Figure 17: North America Augmented Reality & Mixed Reality Market Revenue Share (%), by Country 2025 & 2033
- Figure 18: North America Augmented Reality & Mixed Reality Market Volume Share (%), by Country 2025 & 2033
- Figure 19: Europe Augmented Reality & Mixed Reality Market Revenue (billion), by Type 2025 & 2033
- Figure 20: Europe Augmented Reality & Mixed Reality Market Volume (K Unit), by Type 2025 & 2033
- Figure 21: Europe Augmented Reality & Mixed Reality Market Revenue Share (%), by Type 2025 & 2033
- Figure 22: Europe Augmented Reality & Mixed Reality Market Volume Share (%), by Type 2025 & 2033
- Figure 23: Europe Augmented Reality & Mixed Reality Market Revenue (billion), by End-user Vertical 2025 & 2033
- Figure 24: Europe Augmented Reality & Mixed Reality Market Volume (K Unit), by End-user Vertical 2025 & 2033
- Figure 25: Europe Augmented Reality & Mixed Reality Market Revenue Share (%), by End-user Vertical 2025 & 2033
- Figure 26: Europe Augmented Reality & Mixed Reality Market Volume Share (%), by End-user Vertical 2025 & 2033
- Figure 27: Europe Augmented Reality & Mixed Reality Market Revenue (billion), by End-user Vertical 2025 & 2033
- Figure 28: Europe Augmented Reality & Mixed Reality Market Volume (K Unit), by End-user Vertical 2025 & 2033
- Figure 29: Europe Augmented Reality & Mixed Reality Market Revenue Share (%), by End-user Vertical 2025 & 2033
- Figure 30: Europe Augmented Reality & Mixed Reality Market Volume Share (%), by End-user Vertical 2025 & 2033
- Figure 31: Europe Augmented Reality & Mixed Reality Market Revenue (billion), by Country 2025 & 2033
- Figure 32: Europe Augmented Reality & Mixed Reality Market Volume (K Unit), by Country 2025 & 2033
- Figure 33: Europe Augmented Reality & Mixed Reality Market Revenue Share (%), by Country 2025 & 2033
- Figure 34: Europe Augmented Reality & Mixed Reality Market Volume Share (%), by Country 2025 & 2033
- Figure 35: Asia Pacific Augmented Reality & Mixed Reality Market Revenue (billion), by Type 2025 & 2033
- Figure 36: Asia Pacific Augmented Reality & Mixed Reality Market Volume (K Unit), by Type 2025 & 2033
- Figure 37: Asia Pacific Augmented Reality & Mixed Reality Market Revenue Share (%), by Type 2025 & 2033
- Figure 38: Asia Pacific Augmented Reality & Mixed Reality Market Volume Share (%), by Type 2025 & 2033
- Figure 39: Asia Pacific Augmented Reality & Mixed Reality Market Revenue (billion), by End-user Vertical 2025 & 2033
- Figure 40: Asia Pacific Augmented Reality & Mixed Reality Market Volume (K Unit), by End-user Vertical 2025 & 2033
- Figure 41: Asia Pacific Augmented Reality & Mixed Reality Market Revenue Share (%), by End-user Vertical 2025 & 2033
- Figure 42: Asia Pacific Augmented Reality & Mixed Reality Market Volume Share (%), by End-user Vertical 2025 & 2033
- Figure 43: Asia Pacific Augmented Reality & Mixed Reality Market Revenue (billion), by End-user Vertical 2025 & 2033
- Figure 44: Asia Pacific Augmented Reality & Mixed Reality Market Volume (K Unit), by End-user Vertical 2025 & 2033
- Figure 45: Asia Pacific Augmented Reality & Mixed Reality Market Revenue Share (%), by End-user Vertical 2025 & 2033
- Figure 46: Asia Pacific Augmented Reality & Mixed Reality Market Volume Share (%), by End-user Vertical 2025 & 2033
- Figure 47: Asia Pacific Augmented Reality & Mixed Reality Market Revenue (billion), by Country 2025 & 2033
- Figure 48: Asia Pacific Augmented Reality & Mixed Reality Market Volume (K Unit), by Country 2025 & 2033
- Figure 49: Asia Pacific Augmented Reality & Mixed Reality Market Revenue Share (%), by Country 2025 & 2033
- Figure 50: Asia Pacific Augmented Reality & Mixed Reality Market Volume Share (%), by Country 2025 & 2033
- Figure 51: Rest of the World Augmented Reality & Mixed Reality Market Revenue (billion), by Type 2025 & 2033
- Figure 52: Rest of the World Augmented Reality & Mixed Reality Market Volume (K Unit), by Type 2025 & 2033
- Figure 53: Rest of the World Augmented Reality & Mixed Reality Market Revenue Share (%), by Type 2025 & 2033
- Figure 54: Rest of the World Augmented Reality & Mixed Reality Market Volume Share (%), by Type 2025 & 2033
- Figure 55: Rest of the World Augmented Reality & Mixed Reality Market Revenue (billion), by End-user Vertical 2025 & 2033
- Figure 56: Rest of the World Augmented Reality & Mixed Reality Market Volume (K Unit), by End-user Vertical 2025 & 2033
- Figure 57: Rest of the World Augmented Reality & Mixed Reality Market Revenue Share (%), by End-user Vertical 2025 & 2033
- Figure 58: Rest of the World Augmented Reality & Mixed Reality Market Volume Share (%), by End-user Vertical 2025 & 2033
- Figure 59: Rest of the World Augmented Reality & Mixed Reality Market Revenue (billion), by End-user Vertical 2025 & 2033
- Figure 60: Rest of the World Augmented Reality & Mixed Reality Market Volume (K Unit), by End-user Vertical 2025 & 2033
- Figure 61: Rest of the World Augmented Reality & Mixed Reality Market Revenue Share (%), by End-user Vertical 2025 & 2033
- Figure 62: Rest of the World Augmented Reality & Mixed Reality Market Volume Share (%), by End-user Vertical 2025 & 2033
- Figure 63: Rest of the World Augmented Reality & Mixed Reality Market Revenue (billion), by Country 2025 & 2033
- Figure 64: Rest of the World Augmented Reality & Mixed Reality Market Volume (K Unit), by Country 2025 & 2033
- Figure 65: Rest of the World Augmented Reality & Mixed Reality Market Revenue Share (%), by Country 2025 & 2033
- Figure 66: Rest of the World Augmented Reality & Mixed Reality Market Volume Share (%), by Country 2025 & 2033
- Figure 67: North America Augmented Reality & Mixed Reality Market Revenue (billion), by Type 2025 & 2033
- Figure 68: North America Augmented Reality & Mixed Reality Market Volume (K Unit), by Type 2025 & 2033
- Figure 69: North America Augmented Reality & Mixed Reality Market Revenue Share (%), by Type 2025 & 2033
- Figure 70: North America Augmented Reality & Mixed Reality Market Volume Share (%), by Type 2025 & 2033
- Figure 71: North America Augmented Reality & Mixed Reality Market Revenue (billion), by End-user Vertical 2025 & 2033
- Figure 72: North America Augmented Reality & Mixed Reality Market Volume (K Unit), by End-user Vertical 2025 & 2033
- Figure 73: North America Augmented Reality & Mixed Reality Market Revenue Share (%), by End-user Vertical 2025 & 2033
- Figure 74: North America Augmented Reality & Mixed Reality Market Volume Share (%), by End-user Vertical 2025 & 2033
- Figure 75: North America Augmented Reality & Mixed Reality Market Revenue (billion), by End-user Vertical 2025 & 2033
- Figure 76: North America Augmented Reality & Mixed Reality Market Volume (K Unit), by End-user Vertical 2025 & 2033
- Figure 77: North America Augmented Reality & Mixed Reality Market Revenue Share (%), by End-user Vertical 2025 & 2033
- Figure 78: North America Augmented Reality & Mixed Reality Market Volume Share (%), by End-user Vertical 2025 & 2033
- Figure 79: North America Augmented Reality & Mixed Reality Market Revenue (billion), by Country 2025 & 2033
- Figure 80: North America Augmented Reality & Mixed Reality Market Volume (K Unit), by Country 2025 & 2033
- Figure 81: North America Augmented Reality & Mixed Reality Market Revenue Share (%), by Country 2025 & 2033
- Figure 82: North America Augmented Reality & Mixed Reality Market Volume Share (%), by Country 2025 & 2033
- Figure 83: Europe Augmented Reality & Mixed Reality Market Revenue (billion), by Type 2025 & 2033
- Figure 84: Europe Augmented Reality & Mixed Reality Market Volume (K Unit), by Type 2025 & 2033
- Figure 85: Europe Augmented Reality & Mixed Reality Market Revenue Share (%), by Type 2025 & 2033
- Figure 86: Europe Augmented Reality & Mixed Reality Market Volume Share (%), by Type 2025 & 2033
- Figure 87: Europe Augmented Reality & Mixed Reality Market Revenue (billion), by End-user Vertical 2025 & 2033
- Figure 88: Europe Augmented Reality & Mixed Reality Market Volume (K Unit), by End-user Vertical 2025 & 2033
- Figure 89: Europe Augmented Reality & Mixed Reality Market Revenue Share (%), by End-user Vertical 2025 & 2033
- Figure 90: Europe Augmented Reality & Mixed Reality Market Volume Share (%), by End-user Vertical 2025 & 2033
- Figure 91: Europe Augmented Reality & Mixed Reality Market Revenue (billion), by End-user Vertical 2025 & 2033
- Figure 92: Europe Augmented Reality & Mixed Reality Market Volume (K Unit), by End-user Vertical 2025 & 2033
- Figure 93: Europe Augmented Reality & Mixed Reality Market Revenue Share (%), by End-user Vertical 2025 & 2033
- Figure 94: Europe Augmented Reality & Mixed Reality Market Volume Share (%), by End-user Vertical 2025 & 2033
- Figure 95: Europe Augmented Reality & Mixed Reality Market Revenue (billion), by Country 2025 & 2033
- Figure 96: Europe Augmented Reality & Mixed Reality Market Volume (K Unit), by Country 2025 & 2033
- Figure 97: Europe Augmented Reality & Mixed Reality Market Revenue Share (%), by Country 2025 & 2033
- Figure 98: Europe Augmented Reality & Mixed Reality Market Volume Share (%), by Country 2025 & 2033
- Figure 99: Asia Pacific Augmented Reality & Mixed Reality Market Revenue (billion), by Type 2025 & 2033
- Figure 100: Asia Pacific Augmented Reality & Mixed Reality Market Volume (K Unit), by Type 2025 & 2033
- Figure 101: Asia Pacific Augmented Reality & Mixed Reality Market Revenue Share (%), by Type 2025 & 2033
- Figure 102: Asia Pacific Augmented Reality & Mixed Reality Market Volume Share (%), by Type 2025 & 2033
- Figure 103: Asia Pacific Augmented Reality & Mixed Reality Market Revenue (billion), by End-user Vertical 2025 & 2033
- Figure 104: Asia Pacific Augmented Reality & Mixed Reality Market Volume (K Unit), by End-user Vertical 2025 & 2033
- Figure 105: Asia Pacific Augmented Reality & Mixed Reality Market Revenue Share (%), by End-user Vertical 2025 & 2033
- Figure 106: Asia Pacific Augmented Reality & Mixed Reality Market Volume Share (%), by End-user Vertical 2025 & 2033
- Figure 107: Asia Pacific Augmented Reality & Mixed Reality Market Revenue (billion), by End-user Vertical 2025 & 2033
- Figure 108: Asia Pacific Augmented Reality & Mixed Reality Market Volume (K Unit), by End-user Vertical 2025 & 2033
- Figure 109: Asia Pacific Augmented Reality & Mixed Reality Market Revenue Share (%), by End-user Vertical 2025 & 2033
- Figure 110: Asia Pacific Augmented Reality & Mixed Reality Market Volume Share (%), by End-user Vertical 2025 & 2033
- Figure 111: Asia Pacific Augmented Reality & Mixed Reality Market Revenue (billion), by Country 2025 & 2033
- Figure 112: Asia Pacific Augmented Reality & Mixed Reality Market Volume (K Unit), by Country 2025 & 2033
- Figure 113: Asia Pacific Augmented Reality & Mixed Reality Market Revenue Share (%), by Country 2025 & 2033
- Figure 114: Asia Pacific Augmented Reality & Mixed Reality Market Volume Share (%), by Country 2025 & 2033
- Figure 115: Rest of the World Augmented Reality & Mixed Reality Market Revenue (billion), by Type 2025 & 2033
- Figure 116: Rest of the World Augmented Reality & Mixed Reality Market Volume (K Unit), by Type 2025 & 2033
- Figure 117: Rest of the World Augmented Reality & Mixed Reality Market Revenue Share (%), by Type 2025 & 2033
- Figure 118: Rest of the World Augmented Reality & Mixed Reality Market Volume Share (%), by Type 2025 & 2033
- Figure 119: Rest of the World Augmented Reality & Mixed Reality Market Revenue (billion), by End-user Vertical 2025 & 2033
- Figure 120: Rest of the World Augmented Reality & Mixed Reality Market Volume (K Unit), by End-user Vertical 2025 & 2033
- Figure 121: Rest of the World Augmented Reality & Mixed Reality Market Revenue Share (%), by End-user Vertical 2025 & 2033
- Figure 122: Rest of the World Augmented Reality & Mixed Reality Market Volume Share (%), by End-user Vertical 2025 & 2033
- Figure 123: Rest of the World Augmented Reality & Mixed Reality Market Revenue (billion), by End-user Vertical 2025 & 2033
- Figure 124: Rest of the World Augmented Reality & Mixed Reality Market Volume (K Unit), by End-user Vertical 2025 & 2033
- Figure 125: Rest of the World Augmented Reality & Mixed Reality Market Revenue Share (%), by End-user Vertical 2025 & 2033
- Figure 126: Rest of the World Augmented Reality & Mixed Reality Market Volume Share (%), by End-user Vertical 2025 & 2033
- Figure 127: Rest of the World Augmented Reality & Mixed Reality Market Revenue (billion), by Country 2025 & 2033
- Figure 128: Rest of the World Augmented Reality & Mixed Reality Market Volume (K Unit), by Country 2025 & 2033
- Figure 129: Rest of the World Augmented Reality & Mixed Reality Market Revenue Share (%), by Country 2025 & 2033
- Figure 130: Rest of the World Augmented Reality & Mixed Reality Market Volume Share (%), by Country 2025 & 2033
List of Tables
- Table 1: Global Augmented Reality & Mixed Reality Market Revenue billion Forecast, by Type 2020 & 2033
- Table 2: Global Augmented Reality & Mixed Reality Market Volume K Unit Forecast, by Type 2020 & 2033
- Table 3: Global Augmented Reality & Mixed Reality Market Revenue billion Forecast, by End-user Vertical 2020 & 2033
- Table 4: Global Augmented Reality & Mixed Reality Market Volume K Unit Forecast, by End-user Vertical 2020 & 2033
- Table 5: Global Augmented Reality & Mixed Reality Market Revenue billion Forecast, by End-user Vertical 2020 & 2033
- Table 6: Global Augmented Reality & Mixed Reality Market Volume K Unit Forecast, by End-user Vertical 2020 & 2033
- Table 7: Global Augmented Reality & Mixed Reality Market Revenue billion Forecast, by Region 2020 & 2033
- Table 8: Global Augmented Reality & Mixed Reality Market Volume K Unit Forecast, by Region 2020 & 2033
- Table 9: Global Augmented Reality & Mixed Reality Market Revenue billion Forecast, by Type 2020 & 2033
- Table 10: Global Augmented Reality & Mixed Reality Market Volume K Unit Forecast, by Type 2020 & 2033
- Table 11: Global Augmented Reality & Mixed Reality Market Revenue billion Forecast, by End-user Vertical 2020 & 2033
- Table 12: Global Augmented Reality & Mixed Reality Market Volume K Unit Forecast, by End-user Vertical 2020 & 2033
- Table 13: Global Augmented Reality & Mixed Reality Market Revenue billion Forecast, by End-user Vertical 2020 & 2033
- Table 14: Global Augmented Reality & Mixed Reality Market Volume K Unit Forecast, by End-user Vertical 2020 & 2033
- Table 15: Global Augmented Reality & Mixed Reality Market Revenue billion Forecast, by Country 2020 & 2033
- Table 16: Global Augmented Reality & Mixed Reality Market Volume K Unit Forecast, by Country 2020 & 2033
- Table 17: Global Augmented Reality & Mixed Reality Market Revenue billion Forecast, by Type 2020 & 2033
- Table 18: Global Augmented Reality & Mixed Reality Market Volume K Unit Forecast, by Type 2020 & 2033
- Table 19: Global Augmented Reality & Mixed Reality Market Revenue billion Forecast, by End-user Vertical 2020 & 2033
- Table 20: Global Augmented Reality & Mixed Reality Market Volume K Unit Forecast, by End-user Vertical 2020 & 2033
- Table 21: Global Augmented Reality & Mixed Reality Market Revenue billion Forecast, by End-user Vertical 2020 & 2033
- Table 22: Global Augmented Reality & Mixed Reality Market Volume K Unit Forecast, by End-user Vertical 2020 & 2033
- Table 23: Global Augmented Reality & Mixed Reality Market Revenue billion Forecast, by Country 2020 & 2033
- Table 24: Global Augmented Reality & Mixed Reality Market Volume K Unit Forecast, by Country 2020 & 2033
- Table 25: Global Augmented Reality & Mixed Reality Market Revenue billion Forecast, by Type 2020 & 2033
- Table 26: Global Augmented Reality & Mixed Reality Market Volume K Unit Forecast, by Type 2020 & 2033
- Table 27: Global Augmented Reality & Mixed Reality Market Revenue billion Forecast, by End-user Vertical 2020 & 2033
- Table 28: Global Augmented Reality & Mixed Reality Market Volume K Unit Forecast, by End-user Vertical 2020 & 2033
- Table 29: Global Augmented Reality & Mixed Reality Market Revenue billion Forecast, by End-user Vertical 2020 & 2033
- Table 30: Global Augmented Reality & Mixed Reality Market Volume K Unit Forecast, by End-user Vertical 2020 & 2033
- Table 31: Global Augmented Reality & Mixed Reality Market Revenue billion Forecast, by Country 2020 & 2033
- Table 32: Global Augmented Reality & Mixed Reality Market Volume K Unit Forecast, by Country 2020 & 2033
- Table 33: Global Augmented Reality & Mixed Reality Market Revenue billion Forecast, by Type 2020 & 2033
- Table 34: Global Augmented Reality & Mixed Reality Market Volume K Unit Forecast, by Type 2020 & 2033
- Table 35: Global Augmented Reality & Mixed Reality Market Revenue billion Forecast, by End-user Vertical 2020 & 2033
- Table 36: Global Augmented Reality & Mixed Reality Market Volume K Unit Forecast, by End-user Vertical 2020 & 2033
- Table 37: Global Augmented Reality & Mixed Reality Market Revenue billion Forecast, by End-user Vertical 2020 & 2033
- Table 38: Global Augmented Reality & Mixed Reality Market Volume K Unit Forecast, by End-user Vertical 2020 & 2033
- Table 39: Global Augmented Reality & Mixed Reality Market Revenue billion Forecast, by Country 2020 & 2033
- Table 40: Global Augmented Reality & Mixed Reality Market Volume K Unit Forecast, by Country 2020 & 2033
- Table 41: Global Augmented Reality & Mixed Reality Market Revenue billion Forecast, by Type 2020 & 2033
- Table 42: Global Augmented Reality & Mixed Reality Market Volume K Unit Forecast, by Type 2020 & 2033
- Table 43: Global Augmented Reality & Mixed Reality Market Revenue billion Forecast, by End-user Vertical 2020 & 2033
- Table 44: Global Augmented Reality & Mixed Reality Market Volume K Unit Forecast, by End-user Vertical 2020 & 2033
- Table 45: Global Augmented Reality & Mixed Reality Market Revenue billion Forecast, by End-user Vertical 2020 & 2033
- Table 46: Global Augmented Reality & Mixed Reality Market Volume K Unit Forecast, by End-user Vertical 2020 & 2033
- Table 47: Global Augmented Reality & Mixed Reality Market Revenue billion Forecast, by Country 2020 & 2033
- Table 48: Global Augmented Reality & Mixed Reality Market Volume K Unit Forecast, by Country 2020 & 2033
- Table 49: Global Augmented Reality & Mixed Reality Market Revenue billion Forecast, by Type 2020 & 2033
- Table 50: Global Augmented Reality & Mixed Reality Market Volume K Unit Forecast, by Type 2020 & 2033
- Table 51: Global Augmented Reality & Mixed Reality Market Revenue billion Forecast, by End-user Vertical 2020 & 2033
- Table 52: Global Augmented Reality & Mixed Reality Market Volume K Unit Forecast, by End-user Vertical 2020 & 2033
- Table 53: Global Augmented Reality & Mixed Reality Market Revenue billion Forecast, by End-user Vertical 2020 & 2033
- Table 54: Global Augmented Reality & Mixed Reality Market Volume K Unit Forecast, by End-user Vertical 2020 & 2033
- Table 55: Global Augmented Reality & Mixed Reality Market Revenue billion Forecast, by Country 2020 & 2033
- Table 56: Global Augmented Reality & Mixed Reality Market Volume K Unit Forecast, by Country 2020 & 2033
- Table 57: Global Augmented Reality & Mixed Reality Market Revenue billion Forecast, by Type 2020 & 2033
- Table 58: Global Augmented Reality & Mixed Reality Market Volume K Unit Forecast, by Type 2020 & 2033
- Table 59: Global Augmented Reality & Mixed Reality Market Revenue billion Forecast, by End-user Vertical 2020 & 2033
- Table 60: Global Augmented Reality & Mixed Reality Market Volume K Unit Forecast, by End-user Vertical 2020 & 2033
- Table 61: Global Augmented Reality & Mixed Reality Market Revenue billion Forecast, by End-user Vertical 2020 & 2033
- Table 62: Global Augmented Reality & Mixed Reality Market Volume K Unit Forecast, by End-user Vertical 2020 & 2033
- Table 63: Global Augmented Reality & Mixed Reality Market Revenue billion Forecast, by Country 2020 & 2033
- Table 64: Global Augmented Reality & Mixed Reality Market Volume K Unit Forecast, by Country 2020 & 2033
- Table 65: Global Augmented Reality & Mixed Reality Market Revenue billion Forecast, by Type 2020 & 2033
- Table 66: Global Augmented Reality & Mixed Reality Market Volume K Unit Forecast, by Type 2020 & 2033
- Table 67: Global Augmented Reality & Mixed Reality Market Revenue billion Forecast, by End-user Vertical 2020 & 2033
- Table 68: Global Augmented Reality & Mixed Reality Market Volume K Unit Forecast, by End-user Vertical 2020 & 2033
- Table 69: Global Augmented Reality & Mixed Reality Market Revenue billion Forecast, by End-user Vertical 2020 & 2033
- Table 70: Global Augmented Reality & Mixed Reality Market Volume K Unit Forecast, by End-user Vertical 2020 & 2033
- Table 71: Global Augmented Reality & Mixed Reality Market Revenue billion Forecast, by Country 2020 & 2033
- Table 72: Global Augmented Reality & Mixed Reality Market Volume K Unit Forecast, by Country 2020 & 2033
Frequently Asked Questions
1. What is the projected Compound Annual Growth Rate (CAGR) of the Augmented Reality & Mixed Reality Market?
The projected CAGR is approximately 29.7%.
2. Which companies are prominent players in the Augmented Reality & Mixed Reality Market?
Key companies in the market include Dynabook Americas Inc (Sharp corporation), Samsung Electronics Company Limited, TechSee Augmented Vision Ltd, Acer Inc, HP Development Company LP, Magic Leap Inc, Amber Garage (Holokit), Wikitude GMBH, Google LLC (Alphabet Inc ), Microsoft Corporation, Vuzix Corporation, Ultraleap Limited, AsusTek Computer Inc, Seiko Epson Corporation, PTC Inc, Niantic Inc, Dell Technologies Inc, Occipital Inc, Realwear Inc, Atheer Inc, Optinvent, Blippar com Ltd.
3. What are the main segments of the Augmented Reality & Mixed Reality Market?
The market segments include Type, End-user Vertical, End-user Vertical.
4. Can you provide details about the market size?
The market size is estimated to be USD 120.21 billion as of 2022.
5. What are some drivers contributing to market growth?
Increasing Applications of Augmented Reality; High Demand for Mobile-based Augmented Reality.
6. What are the notable trends driving market growth?
Increasing Applications of Augmented Reality Drives the Market Growth.
7. Are there any restraints impacting market growth?
Security Issues Associated with Mobile Payments.
8. Can you provide examples of recent developments in the market?
October 2022: Micledi Microdisplays, a leading developer of microLED displays for augmented reality (AR) glasses, and Kura Technologies, one of the top global innovators in AR headsets, announced a collaboration to manufacture AR glasses. The new glasses are designed by Kura and incorporate MICLEDI's unique 300mm microLED displays to achieve the performance required for Kura's next generation of AR glasses.
9. What pricing options are available for accessing the report?
Pricing options include single-user, multi-user, and enterprise licenses priced at USD 4750, USD 5250, and USD 8750 respectively.
10. Is the market size provided in terms of value or volume?
The market size is provided in terms of value, measured in billion and volume, measured in K Unit.
11. Are there any specific market keywords associated with the report?
Yes, the market keyword associated with the report is "Augmented Reality & Mixed Reality Market," which aids in identifying and referencing the specific market segment covered.
12. How do I determine which pricing option suits my needs best?
The pricing options vary based on user requirements and access needs. Individual users may opt for single-user licenses, while businesses requiring broader access may choose multi-user or enterprise licenses for cost-effective access to the report.
13. Are there any additional resources or data provided in the Augmented Reality & Mixed Reality Market report?
While the report offers comprehensive insights, it's advisable to review the specific contents or supplementary materials provided to ascertain if additional resources or data are available.
14. How can I stay updated on further developments or reports in the Augmented Reality & Mixed Reality Market?
To stay informed about further developments, trends, and reports in the Augmented Reality & Mixed Reality Market, consider subscribing to industry newsletters, following relevant companies and organizations, or regularly checking reputable industry news sources and publications.
Methodology
Step 1 - Identification of Relevant Samples Size from Population Database


Step 2 - Approaches for Defining Global Market Size (Value, Volume* & Price*)

Note*: In applicable scenarios
Step 3 - Data Sources
Primary Research
- Web Analytics
- Survey Reports
- Research Institute
- Latest Research Reports
- Opinion Leaders
Secondary Research
- Annual Reports
- White Paper
- Latest Press Release
- Industry Association
- Paid Database
- Investor Presentations

Step 4 - Data Triangulation
Involves using different sources of information in order to increase the validity of a study
These sources are likely to be stakeholders in a program - participants, other researchers, program staff, other community members, and so on.
Then we put all data in single framework & apply various statistical tools to find out the dynamic on the market.
During the analysis stage, feedback from the stakeholder groups would be compared to determine areas of agreement as well as areas of divergence