

Key Insights
The U.S. digital lending industry is poised for substantial growth, with a current market size of 457.29 Million and a projected Compound Annual Growth Rate (CAGR) of 11.87% over the forecast period. This robust expansion is fueled by several key drivers, including the increasing adoption of digital technologies by both businesses and consumers, the demand for faster and more accessible financing options, and the evolving regulatory landscape that is becoming more accommodating to fintech innovations. Businesses are increasingly leveraging digital lending platforms for working capital, inventory financing, and expansion loans, appreciating the streamlined application processes and quicker disbursement times compared to traditional banking. Simultaneously, consumers are turning to digital lenders for personal loans, auto loans, and mortgages, benefiting from competitive interest rates and personalized loan products. The shift towards online financial services, accelerated by the pandemic, has firmly established digital lending as a mainstream financial solution.
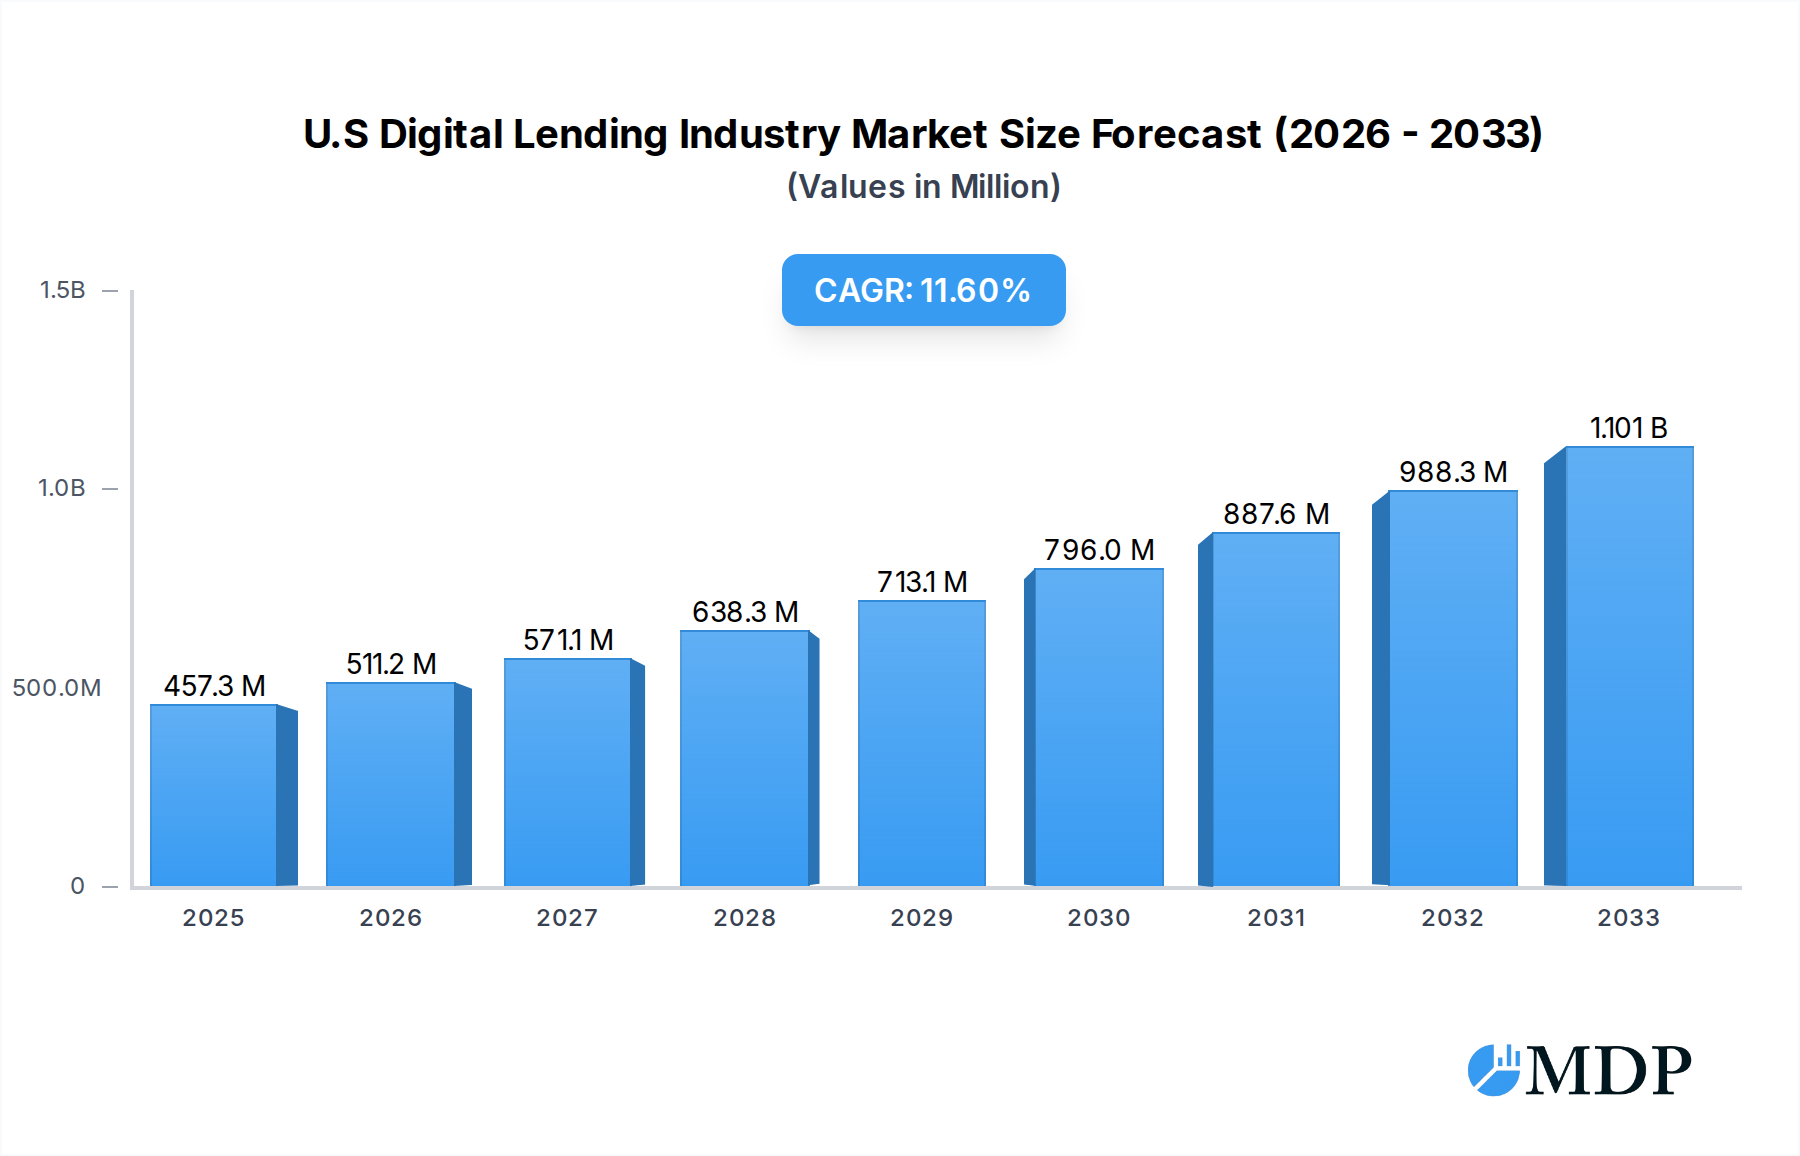
U.S Digital Lending Industry Market Size (In Million)
Further driving this growth are emerging trends such as the integration of artificial intelligence and machine learning for improved credit scoring and risk assessment, leading to more inclusive lending practices. The rise of peer-to-peer lending platforms and the increasing popularity of embedded finance, where lending services are integrated directly into other business platforms, are also significant catalysts. While the market enjoys strong growth, it faces certain restraints, including evolving regulatory scrutiny, concerns around data privacy and cybersecurity, and the need for continuous technological investment to maintain a competitive edge. Nevertheless, the inherent convenience, speed, and broader accessibility offered by digital lending solutions are expected to outweigh these challenges, solidifying its prominent position in the financial ecosystem. The market is segmented into Business and Consumer lending, both experiencing significant traction, with North America, particularly the United States, leading in market penetration and innovation.

U.S Digital Lending Industry Company Market Share
U.S. Digital Lending Industry: Market Dynamics, Growth Forecasts, and Strategic Insights (2019-2033)
Unlock comprehensive insights into the burgeoning U.S. digital lending landscape with this in-depth report. Spanning from 2019 to 2033, with a base year of 2025 and a forecast period through 2033, this analysis provides critical data on market size, trends, competitive intelligence, and future outlook. Targeting industry stakeholders, investors, and innovators, this report delivers actionable intelligence on the $XX trillion digital lending market, covering both business and consumer segments. Dive into detailed market dynamics, technological advancements, regulatory impacts, and emerging opportunities shaping the future of finance.
U.S Digital Lending Industry Market Dynamics & Concentration
The U.S. digital lending industry is characterized by dynamic market concentration, driven by rapid technological innovation and evolving regulatory frameworks. Key innovation drivers include the widespread adoption of AI and machine learning for credit scoring, enhanced data analytics for risk assessment, and the development of user-friendly digital platforms that streamline loan application and approval processes. Regulatory frameworks, while sometimes presenting hurdles, are increasingly adapting to foster innovation while ensuring consumer protection, influencing product development and market entry strategies. Product substitutes, such as traditional banking loans and peer-to-peer lending alternatives, continue to compete, but the convenience and speed offered by digital lending platforms are driving significant adoption. End-user trends highlight a growing preference for personalized loan products, faster funding times, and seamless digital experiences across both business and consumer segments. Merger and acquisition (M&A) activities remain robust, as larger financial institutions seek to acquire or partner with agile fintechs to enhance their digital capabilities. For instance, a significant number of M&A deals, estimated at over 50 annually in recent years, aim to consolidate market share and integrate innovative technologies. Market share is increasingly fragmented, with leading digital lenders holding an estimated 15-20% of the overall lending market, a figure projected to grow substantially. The competitive landscape is marked by intense rivalry, pushing companies to constantly innovate and optimize their service offerings.
U.S Digital Lending Industry Industry Trends & Analysis
The U.S. digital lending industry is experiencing a period of unprecedented growth and transformation, driven by a confluence of technological advancements, shifting consumer preferences, and a dynamic economic environment. The market is projected to witness a Compound Annual Growth Rate (CAGR) of approximately 18% between 2025 and 2033, reaching an estimated market size of over $2.5 trillion by the end of the forecast period. This growth is largely propelled by the increasing penetration of digital channels for financial services, with an estimated 70% of consumers now comfortable or preferring to conduct loan transactions online. Technological disruptions are at the forefront of this evolution, with Artificial Intelligence (AI) and Machine Learning (ML) revolutionizing credit underwriting, risk assessment, and fraud detection. These technologies enable lenders to process loan applications more efficiently, reduce operational costs, and offer more competitive interest rates. The adoption of blockchain technology is also emerging as a key trend, promising to enhance transparency, security, and speed in lending transactions. Consumer preferences are increasingly leaning towards personalized loan products, flexible repayment options, and instant approvals, pushing digital lenders to leverage data analytics to understand individual borrower needs better. The rise of embedded finance, where lending solutions are integrated into non-financial platforms, is another significant trend, broadening access to credit for a wider range of individuals and businesses. Competitive dynamics within the industry are intensifying, with a constant influx of new entrants and established financial institutions bolstering their digital offerings. This competitive pressure is fostering innovation and leading to the development of specialized lending platforms catering to niche markets, such as small businesses, gig economy workers, and specific demographic groups. The focus on customer experience has never been higher, with digital lenders investing heavily in intuitive user interfaces, responsive customer support, and transparent communication throughout the lending lifecycle. Furthermore, the growing demand for alternative data sources in credit scoring is expanding access to credit for individuals with limited traditional credit histories, further democratizing financial services.
Leading Markets & Segments in U.S Digital Lending Industry
The U.S. digital lending industry is broadly segmented into Business Digital Lending and Consumer Digital Lending, with both segments exhibiting robust growth and distinct market dynamics. The Business Digital Lending segment, encompassing loans for small and medium-sized businesses (SMBs), is a particularly dominant force, projected to account for over 60% of the total digital lending market by 2033, with an estimated market size exceeding $1.5 trillion. This dominance is fueled by several key drivers, including the critical need for accessible and agile capital for business expansion and operational needs, the less stringent regulatory oversight compared to consumer lending in certain aspects, and the increasing adoption of digital financial tools by the business community. Economic policies aimed at supporting SMB growth, such as tax incentives and government-backed loan programs, further bolster this segment.
- Key Drivers for Business Digital Lending Dominance:
- SMB Capital Needs: A vast number of SMBs require continuous access to working capital, equipment financing, and expansion loans, which digital lenders can provide more rapidly than traditional institutions.
- Technological Adoption: Businesses are increasingly embracing digital solutions for all aspects of their operations, including financing, leading to a higher propensity to engage with digital lending platforms.
- Streamlined Application Processes: Digital lenders offer significantly faster and less cumbersome application and approval processes compared to conventional banks, which is crucial for time-sensitive business needs.
- Specialized Financing Options: The rise of tailored business loan products, such as invoice financing, merchant cash advances, and lines of credit, caters to the diverse needs of businesses.
The Consumer Digital Lending segment, while representing a smaller portion of the overall market, is also experiencing substantial expansion, projected to grow to an estimated $1 trillion by 2033. This segment includes personal loans, auto loans, student loans, and mortgage refinancing.
- Key Drivers for Consumer Digital Lending Growth:
- Convenience and Speed: Consumers value the ease of applying for and receiving funds from digital lenders from the comfort of their homes.
- Competitive Interest Rates: Digital lenders, with their lower overhead costs, can often offer more competitive interest rates, attracting a wider borrower base.
- Improved Credit Access: The use of alternative data and sophisticated algorithms allows digital lenders to assess creditworthiness for individuals with limited traditional credit histories, increasing financial inclusion.
- Personalization: Digital platforms enable lenders to offer personalized loan products and repayment schedules based on individual consumer profiles and financial goals.
The North American region, specifically the United States, remains the leading market for digital lending due to its mature financial infrastructure, high internet penetration, and a strong culture of technological innovation. The ongoing development of digital payment systems and a growing acceptance of online financial transactions further solidify its position.
U.S Digital Lending Industry Product Developments
Recent product developments in the U.S. digital lending industry underscore a commitment to innovation, enhanced customer experience, and risk mitigation. TruStage's introduction of Payment Guard Insurance in September 2023 represents a significant advancement, offering an inbuilt insurance solution for digital lenders and borrowers designed to guard against covered losses that can lead to loan defaults, safeguarding borrowers in cases of disability or job loss. This innovative product was recognized as a finalist for the Finovate Awards. Concurrently, Citi's sale of its Bridge created by Citi platform to Foro Holdings, Inc. in September 2023, with partnership funding from TTV Capital, US Bank, and Correlation Ventures, aims to democratize capital access for SMBs by connecting them with various lenders through a digital platform, while simultaneously streamlining lenders' prospecting. These developments highlight a trend towards integrated solutions that address borrower security and expand capital access through technological platforms.
Key Drivers of U.S Digital Lending Industry Growth
The U.S. digital lending industry's growth is propelled by a potent combination of technological advancements, favorable economic conditions, and a supportive regulatory environment. The widespread adoption of Artificial Intelligence (AI) and machine learning algorithms for credit scoring and risk assessment significantly enhances efficiency and accuracy, enabling lenders to process more applications faster and at a lower cost. Economic tailwinds, such as sustained business investment and consumer spending, create a consistent demand for credit. Furthermore, evolving regulatory frameworks, while sometimes complex, are increasingly recognizing the benefits of fintech innovation, leading to a more conducive environment for digital lending platforms to operate and expand. The increasing comfort of consumers and businesses with online financial transactions further fuels this growth trajectory.
Challenges in the U.S Digital Lending Industry Market
Despite its rapid growth, the U.S. digital lending industry faces several significant challenges that could impede its expansion. Regulatory hurdles remain a primary concern, with evolving compliance requirements and the potential for stricter oversight creating uncertainty for market participants. Cyber threats and data security vulnerabilities pose a constant risk, requiring substantial investment in robust security infrastructure to protect sensitive customer information. Intense competition among a growing number of digital lenders, coupled with the pressure to maintain profitability, can lead to aggressive pricing strategies and potential margin erosion. Supply chain issues, while less direct, can impact the availability of technology components and skilled labor necessary for scaling operations. Furthermore, concerns about algorithmic bias in credit decision-making and the need for greater transparency and fairness in lending practices require continuous attention and innovation.
Emerging Opportunities in U.S Digital Lending Industry
The U.S. digital lending industry is rife with emerging opportunities poised to drive long-term growth and market expansion. The continued evolution of AI and predictive analytics presents a significant opportunity to refine credit risk models, personalize loan offerings, and enhance fraud detection capabilities, leading to greater inclusivity and efficiency. Strategic partnerships between fintech lenders and traditional financial institutions are becoming increasingly common, allowing for the leveraging of established customer bases and regulatory expertise while integrating innovative digital lending solutions. The growing trend of embedded finance offers a vast untapped market, enabling lending services to be seamlessly integrated into various non-financial platforms, thereby reaching a wider audience. Furthermore, exploring underserved markets, such as those requiring specialized financing for green initiatives, impact investing, or specific demographic groups, presents avenues for differentiation and sustained growth.
Leading Players in the U.S Digital Lending Industry Sector
- BizfiLLC
- LendingtreeInc
- CAN Capital Inc
- Upstart Network Inc
- Kiva Microfunds
- LendingClubCorp
- Social Finance Inc (SoFi)
- On Deck Capital Inc
- Kabbage Inc
- Prosper Marketplace Inc
Key Milestones in U.S Digital Lending Industry Industry
- September 2023: TruStage officially launched Payment Guard Insurance, an innovative lending solution designed as an inbuilt insurance product for digital lenders and borrowers. This product aims to safeguard against sudden covered losses that can cause loan defaults, providing protection for borrowers in cases of disability or job loss, and was a finalist for the Finovate Awards.
- September 2023: Citi announced the sale of its Bridge created by Citi platform (Bridge) to Foro Holdings, Inc. This acquisition, supported by TTV Capital, US Bank, and Correlation Ventures, aims to democratize capital access for SMBs through a digital platform connecting them with lenders and streamlining the prospecting process for lenders.
- August 2022: Arc Home LLC selected Tavant, a Silicon Valley-based digital lending solutions provider, to accelerate its digital transformation strategy. This partnership is focused on enhancing customer experience through more effective operations for the full-service residential lender.
- July 2022: Upstart, an AI lending marketplace, announced preferred access to its AI lending platform with no implementation fees for all Community Development Financial Institutions (CDFIs) nationwide, in addition to its existing commitment to Minority Depository Institutions (MDIs). This initiative aligns with Upstart's founding membership in the Economic Opportunity Coalition, focused on achieving economic fairness in the U.S.
Strategic Outlook for U.S Digital Lending Industry Market
The strategic outlook for the U.S. digital lending industry remains exceptionally positive, driven by sustained demand for flexible and accessible financing solutions. Future growth will be significantly influenced by the continued integration of advanced technologies like AI, machine learning, and blockchain, which will enhance underwriting accuracy, operational efficiency, and security. Strategic partnerships and collaborations, particularly between fintechs and traditional financial institutions, will be crucial for expanding market reach and leveraging complementary strengths. The increasing focus on embedded finance presents a substantial opportunity to embed lending solutions into diverse consumer and business workflows, unlocking new revenue streams and customer segments. Furthermore, a commitment to financial inclusion and serving underserved markets will continue to be a strategic imperative, driving innovation in product development and customer acquisition. The industry is poised for continued expansion and evolution, solidifying its role as a cornerstone of the modern financial ecosystem.
U.S Digital Lending Industry Segmentation
-
1. Type
-
1.1. Business
- 1.1.1. Business Digital Lending Market Dynamics
- 1.1.2. Business
- 1.1.3. Market Size Estimates and Forecasts
-
1.2. Consumer
- 1.2.1. Consumer Digital Lending Market Dynamics
- 1.2.2. Consumer
- 1.2.3. Consumer
-
1.1. Business
U.S Digital Lending Industry Segmentation By Geography
-
1. North America
- 1.1. United States
- 1.2. Canada
- 1.3. Mexico
-
2. South America
- 2.1. Brazil
- 2.2. Argentina
- 2.3. Rest of South America
-
3. Europe
- 3.1. United Kingdom
- 3.2. Germany
- 3.3. France
- 3.4. Italy
- 3.5. Spain
- 3.6. Russia
- 3.7. Benelux
- 3.8. Nordics
- 3.9. Rest of Europe
-
4. Middle East & Africa
- 4.1. Turkey
- 4.2. Israel
- 4.3. GCC
- 4.4. North Africa
- 4.5. South Africa
- 4.6. Rest of Middle East & Africa
-
5. Asia Pacific
- 5.1. China
- 5.2. India
- 5.3. Japan
- 5.4. South Korea
- 5.5. ASEAN
- 5.6. Oceania
- 5.7. Rest of Asia Pacific
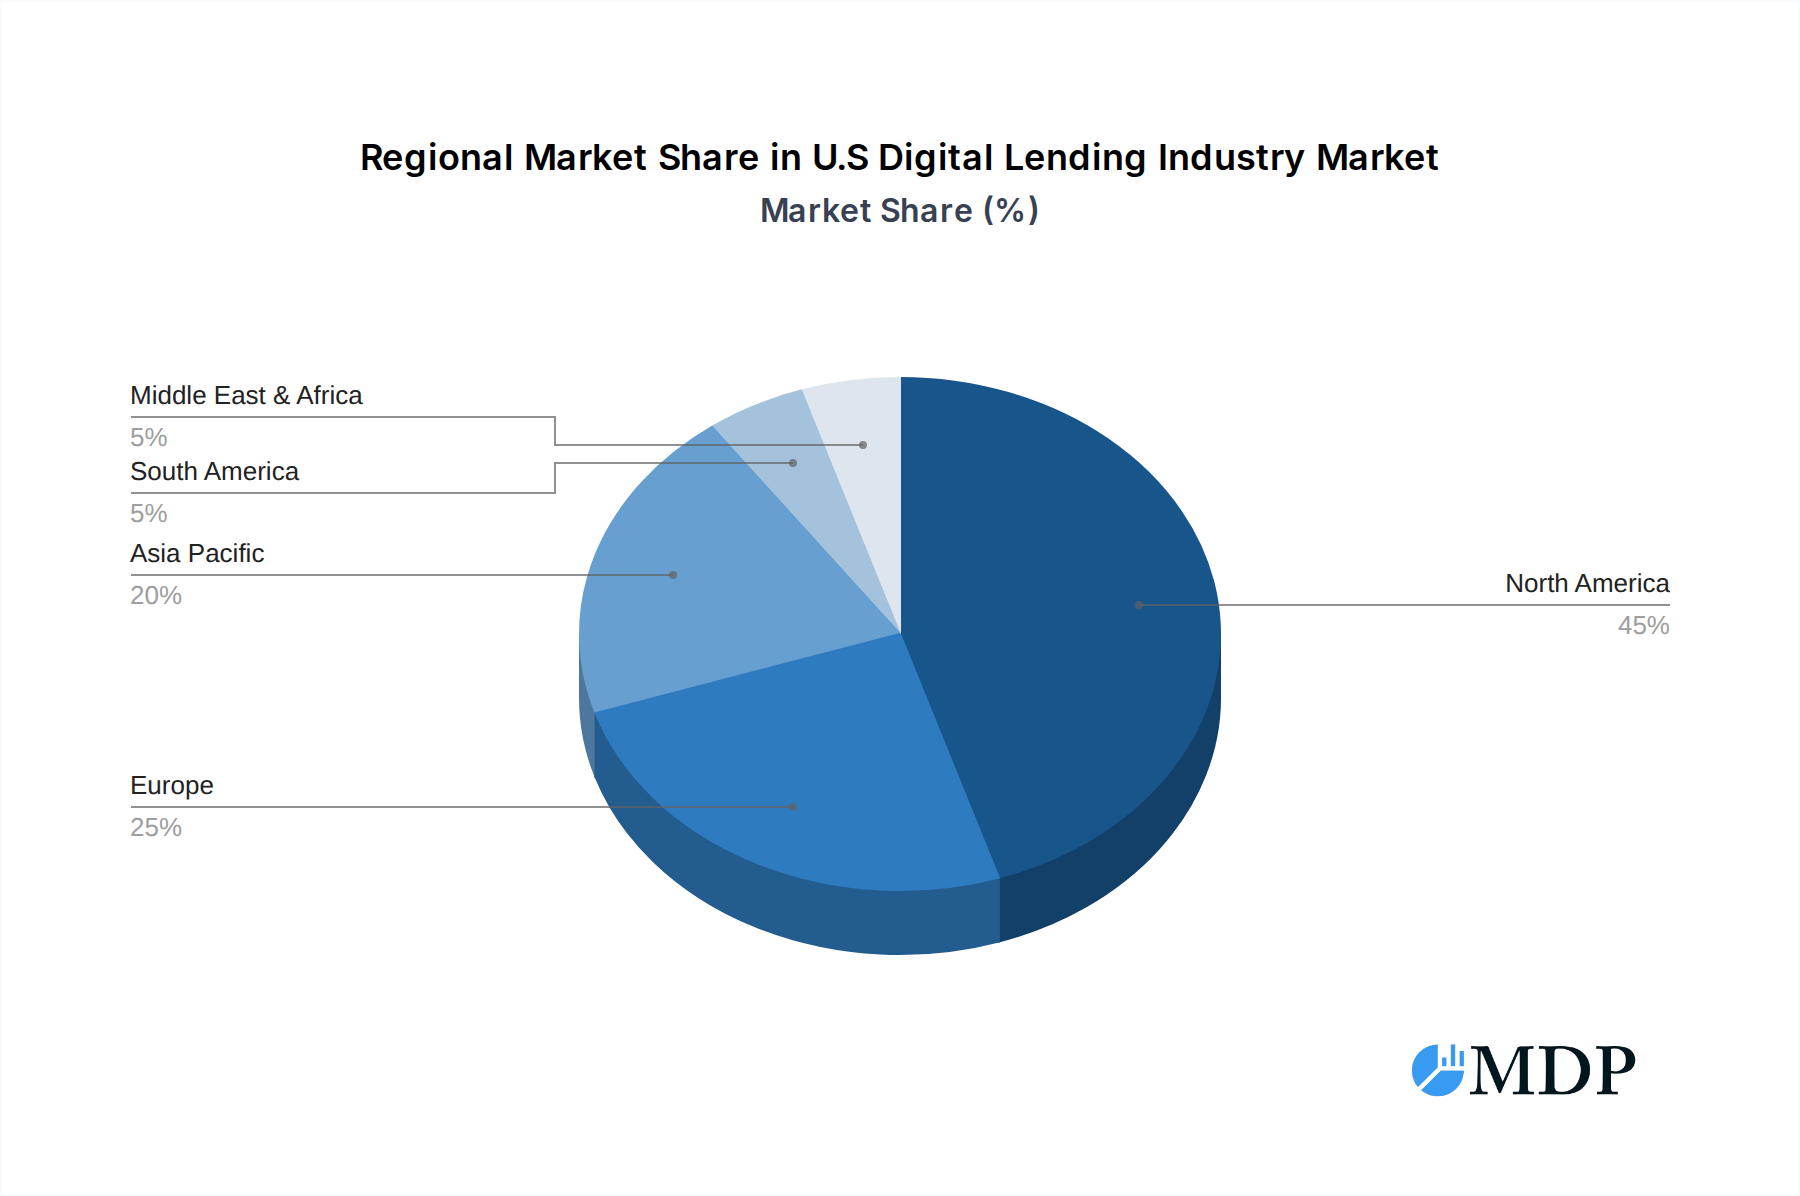
U.S Digital Lending Industry Regional Market Share
Geographic Coverage of U.S Digital Lending Industry
U.S Digital Lending Industry REPORT HIGHLIGHTS
| Aspects | Details |
|---|---|
| Study Period | 2020-2034 |
| Base Year | 2025 |
| Estimated Year | 2026 |
| Forecast Period | 2026-2034 |
| Historical Period | 2020-2025 |
| Growth Rate | CAGR of 11.87% from 2020-2034 |
| Segmentation |
|
Table of Contents
- 1. Introduction
- 1.1. Research Scope
- 1.2. Market Segmentation
- 1.3. Research Objective
- 1.4. Definitions and Assumptions
- 2. Executive Summary
- 2.1. Market Snapshot
- 3. Market Dynamics
- 3.1. Market Drivers
- 3.2. Market Restrains
- 3.3. Market Trends
- 3.4. Market Opportunities
- 4. Market Factor Analysis
- 4.1. Porters Five Forces
- 4.1.1. Bargaining Power of Suppliers
- 4.1.2. Bargaining Power of Buyers
- 4.1.3. Threat of New Entrants
- 4.1.4. Threat of Substitutes
- 4.1.5. Competitive Rivalry
- 4.2. PESTEL analysis
- 4.3. BCG Analysis
- 4.3.1. Stars (High Growth, High Market Share)
- 4.3.2. Cash Cows (Low Growth, High Market Share)
- 4.3.3. Question Mark (High Growth, Low Market Share)
- 4.3.4. Dogs (Low Growth, Low Market Share)
- 4.4. Ansoff Matrix Analysis
- 4.5. Supply Chain Analysis
- 4.6. Regulatory Landscape
- 4.7. Current Market Potential and Opportunity Assessment (TAM–SAM–SOM Framework)
- 4.8. MDP Analyst Note
- 4.1. Porters Five Forces
- 5. Market Analysis, Insights and Forecast 2021-2033
- 5.1. Market Analysis, Insights and Forecast - by Type
- 5.1.1. Business
- 5.1.1.1. Business Digital Lending Market Dynamics
- 5.1.1.2. Business
- 5.1.1.3. Market Size Estimates and Forecasts
- 5.1.2. Consumer
- 5.1.2.1. Consumer Digital Lending Market Dynamics
- 5.1.2.2. Consumer
- 5.1.2.3. Consumer
- 5.1.1. Business
- 5.2. Market Analysis, Insights and Forecast - by Region
- 5.2.1. North America
- 5.2.2. South America
- 5.2.3. Europe
- 5.2.4. Middle East & Africa
- 5.2.5. Asia Pacific
- 5.1. Market Analysis, Insights and Forecast - by Type
- 6. Global U.S Digital Lending Industry Analysis, Insights and Forecast, 2021-2033
- 6.1. Market Analysis, Insights and Forecast - by Type
- 6.1.1. Business
- 6.1.1.1. Business Digital Lending Market Dynamics
- 6.1.1.2. Business
- 6.1.1.3. Market Size Estimates and Forecasts
- 6.1.2. Consumer
- 6.1.2.1. Consumer Digital Lending Market Dynamics
- 6.1.2.2. Consumer
- 6.1.2.3. Consumer
- 6.1.1. Business
- 6.1. Market Analysis, Insights and Forecast - by Type
- 7. North America U.S Digital Lending Industry Analysis, Insights and Forecast, 2020-2032
- 7.1. Market Analysis, Insights and Forecast - by Type
- 7.1.1. Business
- 7.1.1.1. Business Digital Lending Market Dynamics
- 7.1.1.2. Business
- 7.1.1.3. Market Size Estimates and Forecasts
- 7.1.2. Consumer
- 7.1.2.1. Consumer Digital Lending Market Dynamics
- 7.1.2.2. Consumer
- 7.1.2.3. Consumer
- 7.1.1. Business
- 7.1. Market Analysis, Insights and Forecast - by Type
- 8. South America U.S Digital Lending Industry Analysis, Insights and Forecast, 2020-2032
- 8.1. Market Analysis, Insights and Forecast - by Type
- 8.1.1. Business
- 8.1.1.1. Business Digital Lending Market Dynamics
- 8.1.1.2. Business
- 8.1.1.3. Market Size Estimates and Forecasts
- 8.1.2. Consumer
- 8.1.2.1. Consumer Digital Lending Market Dynamics
- 8.1.2.2. Consumer
- 8.1.2.3. Consumer
- 8.1.1. Business
- 8.1. Market Analysis, Insights and Forecast - by Type
- 9. Europe U.S Digital Lending Industry Analysis, Insights and Forecast, 2020-2032
- 9.1. Market Analysis, Insights and Forecast - by Type
- 9.1.1. Business
- 9.1.1.1. Business Digital Lending Market Dynamics
- 9.1.1.2. Business
- 9.1.1.3. Market Size Estimates and Forecasts
- 9.1.2. Consumer
- 9.1.2.1. Consumer Digital Lending Market Dynamics
- 9.1.2.2. Consumer
- 9.1.2.3. Consumer
- 9.1.1. Business
- 9.1. Market Analysis, Insights and Forecast - by Type
- 10. Middle East & Africa U.S Digital Lending Industry Analysis, Insights and Forecast, 2020-2032
- 10.1. Market Analysis, Insights and Forecast - by Type
- 10.1.1. Business
- 10.1.1.1. Business Digital Lending Market Dynamics
- 10.1.1.2. Business
- 10.1.1.3. Market Size Estimates and Forecasts
- 10.1.2. Consumer
- 10.1.2.1. Consumer Digital Lending Market Dynamics
- 10.1.2.2. Consumer
- 10.1.2.3. Consumer
- 10.1.1. Business
- 10.1. Market Analysis, Insights and Forecast - by Type
- 11. Asia Pacific U.S Digital Lending Industry Analysis, Insights and Forecast, 2020-2032
- 11.1. Market Analysis, Insights and Forecast - by Type
- 11.1.1. Business
- 11.1.1.1. Business Digital Lending Market Dynamics
- 11.1.1.2. Business
- 11.1.1.3. Market Size Estimates and Forecasts
- 11.1.2. Consumer
- 11.1.2.1. Consumer Digital Lending Market Dynamics
- 11.1.2.2. Consumer
- 11.1.2.3. Consumer
- 11.1.1. Business
- 11.1. Market Analysis, Insights and Forecast - by Type
- 12. Competitive Analysis
- 12.1. Company Profiles
- 12.1.1 BizfiLLC
- 12.1.1.1. Company Overview
- 12.1.1.2. Products
- 12.1.1.3. Company Financials
- 12.1.1.4. SWOT Analysis
- 12.1.2 LendingtreeInc *List Not Exhaustive
- 12.1.2.1. Company Overview
- 12.1.2.2. Products
- 12.1.2.3. Company Financials
- 12.1.2.4. SWOT Analysis
- 12.1.3 CAN Capital Inc
- 12.1.3.1. Company Overview
- 12.1.3.2. Products
- 12.1.3.3. Company Financials
- 12.1.3.4. SWOT Analysis
- 12.1.4 Upstart Network Inc
- 12.1.4.1. Company Overview
- 12.1.4.2. Products
- 12.1.4.3. Company Financials
- 12.1.4.4. SWOT Analysis
- 12.1.5 Kiva Microfunds
- 12.1.5.1. Company Overview
- 12.1.5.2. Products
- 12.1.5.3. Company Financials
- 12.1.5.4. SWOT Analysis
- 12.1.6 LendingClubCorp
- 12.1.6.1. Company Overview
- 12.1.6.2. Products
- 12.1.6.3. Company Financials
- 12.1.6.4. SWOT Analysis
- 12.1.7 Social Finance Inc (SoFi)
- 12.1.7.1. Company Overview
- 12.1.7.2. Products
- 12.1.7.3. Company Financials
- 12.1.7.4. SWOT Analysis
- 12.1.8 On Deck Capital Inc
- 12.1.8.1. Company Overview
- 12.1.8.2. Products
- 12.1.8.3. Company Financials
- 12.1.8.4. SWOT Analysis
- 12.1.9 Kabbage Inc
- 12.1.9.1. Company Overview
- 12.1.9.2. Products
- 12.1.9.3. Company Financials
- 12.1.9.4. SWOT Analysis
- 12.1.10 Prosper Marketplace Inc
- 12.1.10.1. Company Overview
- 12.1.10.2. Products
- 12.1.10.3. Company Financials
- 12.1.10.4. SWOT Analysis
- 12.1.1 BizfiLLC
- 12.2. Market Entropy
- 12.2.1 Company's Key Areas Served
- 12.2.2 Recent Developments
- 12.3. Company Market Share Analysis 2025
- 12.3.1 Top 5 Companies Market Share Analysis
- 12.3.2 Top 3 Companies Market Share Analysis
- 12.4. List of Potential Customers
- 13. Research Methodology
List of Figures
- Figure 1: Global U.S Digital Lending Industry Revenue Breakdown (Million, %) by Region 2025 & 2033
- Figure 2: North America U.S Digital Lending Industry Revenue (Million), by Type 2025 & 2033
- Figure 3: North America U.S Digital Lending Industry Revenue Share (%), by Type 2025 & 2033
- Figure 4: North America U.S Digital Lending Industry Revenue (Million), by Country 2025 & 2033
- Figure 5: North America U.S Digital Lending Industry Revenue Share (%), by Country 2025 & 2033
- Figure 6: South America U.S Digital Lending Industry Revenue (Million), by Type 2025 & 2033
- Figure 7: South America U.S Digital Lending Industry Revenue Share (%), by Type 2025 & 2033
- Figure 8: South America U.S Digital Lending Industry Revenue (Million), by Country 2025 & 2033
- Figure 9: South America U.S Digital Lending Industry Revenue Share (%), by Country 2025 & 2033
- Figure 10: Europe U.S Digital Lending Industry Revenue (Million), by Type 2025 & 2033
- Figure 11: Europe U.S Digital Lending Industry Revenue Share (%), by Type 2025 & 2033
- Figure 12: Europe U.S Digital Lending Industry Revenue (Million), by Country 2025 & 2033
- Figure 13: Europe U.S Digital Lending Industry Revenue Share (%), by Country 2025 & 2033
- Figure 14: Middle East & Africa U.S Digital Lending Industry Revenue (Million), by Type 2025 & 2033
- Figure 15: Middle East & Africa U.S Digital Lending Industry Revenue Share (%), by Type 2025 & 2033
- Figure 16: Middle East & Africa U.S Digital Lending Industry Revenue (Million), by Country 2025 & 2033
- Figure 17: Middle East & Africa U.S Digital Lending Industry Revenue Share (%), by Country 2025 & 2033
- Figure 18: Asia Pacific U.S Digital Lending Industry Revenue (Million), by Type 2025 & 2033
- Figure 19: Asia Pacific U.S Digital Lending Industry Revenue Share (%), by Type 2025 & 2033
- Figure 20: Asia Pacific U.S Digital Lending Industry Revenue (Million), by Country 2025 & 2033
- Figure 21: Asia Pacific U.S Digital Lending Industry Revenue Share (%), by Country 2025 & 2033
List of Tables
- Table 1: Global U.S Digital Lending Industry Revenue Million Forecast, by Type 2020 & 2033
- Table 2: Global U.S Digital Lending Industry Revenue Million Forecast, by Region 2020 & 2033
- Table 3: Global U.S Digital Lending Industry Revenue Million Forecast, by Type 2020 & 2033
- Table 4: Global U.S Digital Lending Industry Revenue Million Forecast, by Country 2020 & 2033
- Table 5: United States U.S Digital Lending Industry Revenue (Million) Forecast, by Application 2020 & 2033
- Table 6: Canada U.S Digital Lending Industry Revenue (Million) Forecast, by Application 2020 & 2033
- Table 7: Mexico U.S Digital Lending Industry Revenue (Million) Forecast, by Application 2020 & 2033
- Table 8: Global U.S Digital Lending Industry Revenue Million Forecast, by Type 2020 & 2033
- Table 9: Global U.S Digital Lending Industry Revenue Million Forecast, by Country 2020 & 2033
- Table 10: Brazil U.S Digital Lending Industry Revenue (Million) Forecast, by Application 2020 & 2033
- Table 11: Argentina U.S Digital Lending Industry Revenue (Million) Forecast, by Application 2020 & 2033
- Table 12: Rest of South America U.S Digital Lending Industry Revenue (Million) Forecast, by Application 2020 & 2033
- Table 13: Global U.S Digital Lending Industry Revenue Million Forecast, by Type 2020 & 2033
- Table 14: Global U.S Digital Lending Industry Revenue Million Forecast, by Country 2020 & 2033
- Table 15: United Kingdom U.S Digital Lending Industry Revenue (Million) Forecast, by Application 2020 & 2033
- Table 16: Germany U.S Digital Lending Industry Revenue (Million) Forecast, by Application 2020 & 2033
- Table 17: France U.S Digital Lending Industry Revenue (Million) Forecast, by Application 2020 & 2033
- Table 18: Italy U.S Digital Lending Industry Revenue (Million) Forecast, by Application 2020 & 2033
- Table 19: Spain U.S Digital Lending Industry Revenue (Million) Forecast, by Application 2020 & 2033
- Table 20: Russia U.S Digital Lending Industry Revenue (Million) Forecast, by Application 2020 & 2033
- Table 21: Benelux U.S Digital Lending Industry Revenue (Million) Forecast, by Application 2020 & 2033
- Table 22: Nordics U.S Digital Lending Industry Revenue (Million) Forecast, by Application 2020 & 2033
- Table 23: Rest of Europe U.S Digital Lending Industry Revenue (Million) Forecast, by Application 2020 & 2033
- Table 24: Global U.S Digital Lending Industry Revenue Million Forecast, by Type 2020 & 2033
- Table 25: Global U.S Digital Lending Industry Revenue Million Forecast, by Country 2020 & 2033
- Table 26: Turkey U.S Digital Lending Industry Revenue (Million) Forecast, by Application 2020 & 2033
- Table 27: Israel U.S Digital Lending Industry Revenue (Million) Forecast, by Application 2020 & 2033
- Table 28: GCC U.S Digital Lending Industry Revenue (Million) Forecast, by Application 2020 & 2033
- Table 29: North Africa U.S Digital Lending Industry Revenue (Million) Forecast, by Application 2020 & 2033
- Table 30: South Africa U.S Digital Lending Industry Revenue (Million) Forecast, by Application 2020 & 2033
- Table 31: Rest of Middle East & Africa U.S Digital Lending Industry Revenue (Million) Forecast, by Application 2020 & 2033
- Table 32: Global U.S Digital Lending Industry Revenue Million Forecast, by Type 2020 & 2033
- Table 33: Global U.S Digital Lending Industry Revenue Million Forecast, by Country 2020 & 2033
- Table 34: China U.S Digital Lending Industry Revenue (Million) Forecast, by Application 2020 & 2033
- Table 35: India U.S Digital Lending Industry Revenue (Million) Forecast, by Application 2020 & 2033
- Table 36: Japan U.S Digital Lending Industry Revenue (Million) Forecast, by Application 2020 & 2033
- Table 37: South Korea U.S Digital Lending Industry Revenue (Million) Forecast, by Application 2020 & 2033
- Table 38: ASEAN U.S Digital Lending Industry Revenue (Million) Forecast, by Application 2020 & 2033
- Table 39: Oceania U.S Digital Lending Industry Revenue (Million) Forecast, by Application 2020 & 2033
- Table 40: Rest of Asia Pacific U.S Digital Lending Industry Revenue (Million) Forecast, by Application 2020 & 2033
Frequently Asked Questions
1. What is the projected Compound Annual Growth Rate (CAGR) of the U.S Digital Lending Industry?
The projected CAGR is approximately 11.87%.
2. Which companies are prominent players in the U.S Digital Lending Industry?
Key companies in the market include BizfiLLC, LendingtreeInc *List Not Exhaustive, CAN Capital Inc, Upstart Network Inc, Kiva Microfunds, LendingClubCorp, Social Finance Inc (SoFi), On Deck Capital Inc, Kabbage Inc, Prosper Marketplace Inc.
3. What are the main segments of the U.S Digital Lending Industry?
The market segments include Type.
4. Can you provide details about the market size?
The market size is estimated to be USD 457.29 Million as of 2022.
5. What are some drivers contributing to market growth?
5.1 Increasing Number of Potential Loan Purchasers with 'Digital Behavior'5.2 Increasing disposable income.
6. What are the notable trends driving market growth?
Increasing Number of Potential Loan Purchasers with Digital Behavior.
7. Are there any restraints impacting market growth?
Low Light Sensing Capabilities Act as a Restraining Factor; Low-cost Sensors are Increasing the Threat to Scale Down the Quality.
8. Can you provide examples of recent developments in the market?
September 2023 - Payment Guard Insurance, a new lending solution offered by TruStage, a stable financial insurance, investment, and technology provider, was officially made available. As an inbuilt insurance solution for digital lenders and borrowers, the Payment Guard product is an innovative development in the insurance market for digital lending and was recently selected as a finalist for the Finovate Awards. It is intended to guard against sudden covered losses that can cause loan defaults. Borrowers are safeguarded in the case of a covered disability or job loss with TruStage Payment Guard Insurance.
9. What pricing options are available for accessing the report?
Pricing options include single-user, multi-user, and enterprise licenses priced at USD 3800, USD 4500, and USD 5800 respectively.
10. Is the market size provided in terms of value or volume?
The market size is provided in terms of value, measured in Million.
11. Are there any specific market keywords associated with the report?
Yes, the market keyword associated with the report is "U.S Digital Lending Industry," which aids in identifying and referencing the specific market segment covered.
12. How do I determine which pricing option suits my needs best?
The pricing options vary based on user requirements and access needs. Individual users may opt for single-user licenses, while businesses requiring broader access may choose multi-user or enterprise licenses for cost-effective access to the report.
13. Are there any additional resources or data provided in the U.S Digital Lending Industry report?
While the report offers comprehensive insights, it's advisable to review the specific contents or supplementary materials provided to ascertain if additional resources or data are available.
14. How can I stay updated on further developments or reports in the U.S Digital Lending Industry?
To stay informed about further developments, trends, and reports in the U.S Digital Lending Industry, consider subscribing to industry newsletters, following relevant companies and organizations, or regularly checking reputable industry news sources and publications.
Methodology
Step 1 - Identification of Relevant Samples Size from Population Database


Step 2 - Approaches for Defining Global Market Size (Value, Volume* & Price*)

Note*: In applicable scenarios
Step 3 - Data Sources
Primary Research
- Web Analytics
- Survey Reports
- Research Institute
- Latest Research Reports
- Opinion Leaders
Secondary Research
- Annual Reports
- White Paper
- Latest Press Release
- Industry Association
- Paid Database
- Investor Presentations

Step 4 - Data Triangulation
Involves using different sources of information in order to increase the validity of a study
These sources are likely to be stakeholders in a program - participants, other researchers, program staff, other community members, and so on.
Then we put all data in single framework & apply various statistical tools to find out the dynamic on the market.
During the analysis stage, feedback from the stakeholder groups would be compared to determine areas of agreement as well as areas of divergence