

Key Insights into the Smart Manufacturing Industry
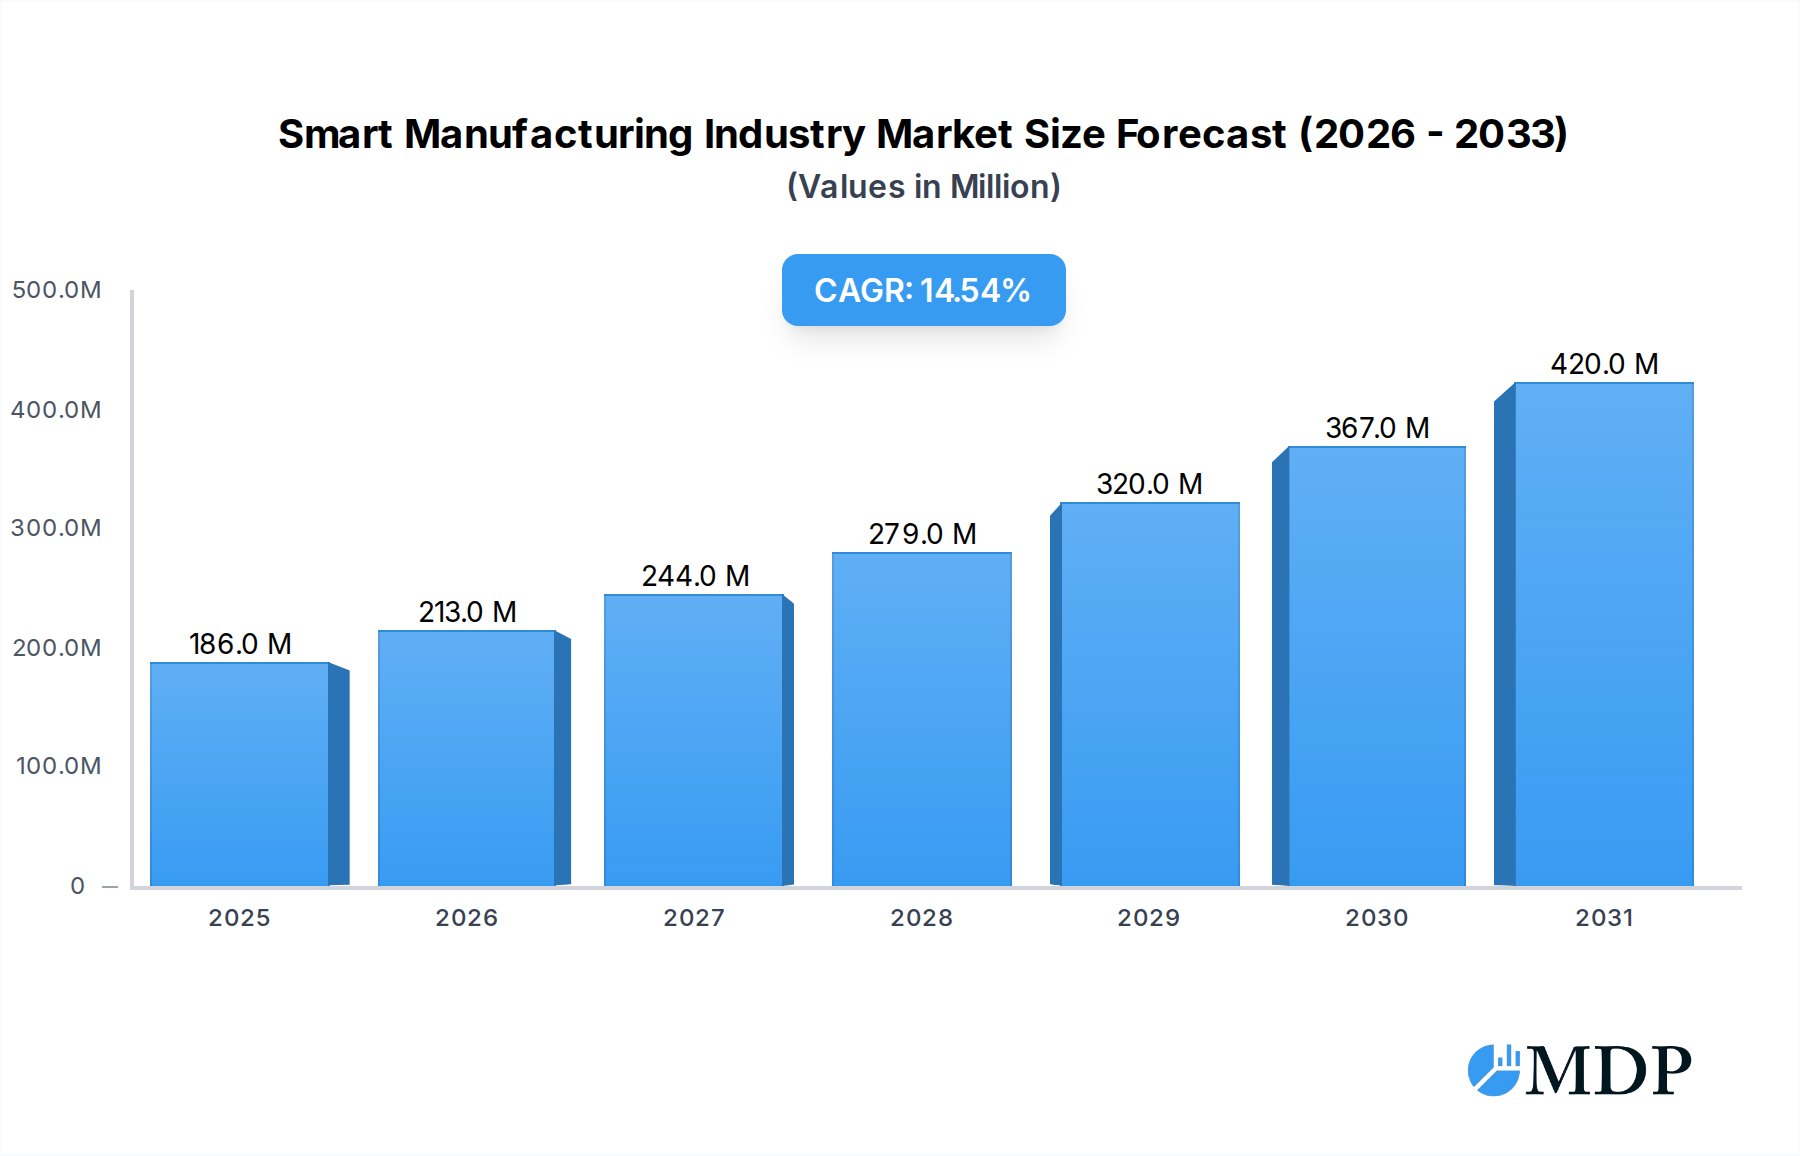
The Smart Manufacturing Industry is undergoing a profound transformation, driven by the convergence of operational technology (OT) and information technology (IT). Valued at an estimated USD 141.39 Million in the current analysis period, the market is poised for robust expansion, projected to achieve a Compound Annual Growth Rate (CAGR) of 14.58% from 2023 to 2030. This impressive growth trajectory is expected to propel the market to approximately USD 365.34 Million by the end of the forecast period. Key demand drivers include an increasing imperative for automation to enhance efficiency and quality across manufacturing operations, coupled with growing requirements for regulatory compliance and proactive government support for industrial digitization initiatives. The pervasive proliferation of Internet of Things (IoT) technologies further accelerates market adoption, enabling real-time data acquisition and actionable insights.

Smart Manufacturing Industry Market Size (In Million)
Despite the significant tailwinds, the Smart Manufacturing Industry navigates several inherent challenges. Prominent among these are persistent concerns regarding data security and intellectual property protection within interconnected systems, which necessitate robust cybersecurity frameworks. Furthermore, the substantial initial installation costs associated with integrating advanced smart manufacturing solutions, alongside a prevailing lack of a sufficiently skilled workforce capable of deploying, managing, and maintaining these complex systems, remain critical restraints hindering full-scale enterprise adoption, particularly for Small & Medium Enterprises (SMEs). Notwithstanding these hurdles, the market exhibits a clear trend toward integration, with the Automotive Industry expected to significantly drive market growth through its aggressive adoption of advanced production methodologies. The future outlook for the Smart Manufacturing Industry is characterized by continued advancements in Artificial Intelligence, machine learning, edge computing, and digital twin technologies, all contributing to more agile, responsive, and resilient manufacturing ecosystems globally.
Smart Manufacturing Industry Company Market Share
Component Segment Dominance in Smart Manufacturing Industry
The Component segment, encompassing hardware, software, and services, stands as the unequivocally dominant segment by revenue share within the Smart Manufacturing Industry. This segment's pre-eminence is attributable to its foundational role in enabling nearly every aspect of intelligent manufacturing. Within this broad category, software solutions, including Manufacturing Execution Systems (MES), Supervisory Control and Data Acquisition (SCADA) systems, Enterprise Resource Planning (ERP), Product Lifecycle Management (PLM), and advanced analytics platforms, are particularly pivotal. The increasing complexity of manufacturing operations, coupled with the relentless pursuit of operational efficiency and quality, necessitates sophisticated software infrastructure to integrate disparate systems, automate processes, and derive actionable intelligence from vast datasets. Companies like Siemens AG and Rockwell Automation Inc. are prominent players, offering extensive software portfolios that address diverse manufacturing needs, from discrete to process environments.
Hardware components, such as Industrial Sensors Market, controllers, actuators, human-machine interfaces (HMIs), and embedded systems, form the physical backbone of smart factories. The proliferation of connected devices and the need for precision control in automated processes drive consistent demand for advanced hardware. The increasing adoption of Robotics Market solutions, both collaborative robots (cobots) and industrial robots, further fuels the demand for specialized hardware and integrated control systems. Services, including system integration, consulting, maintenance, and training, complement hardware and software offerings, ensuring seamless deployment, optimal performance, and ongoing operational support for smart manufacturing solutions. This holistic demand for all facets of the Component segment solidifies its leading position. The segment's share is not merely static; it continues to grow as manufacturers progressively transition from legacy systems to fully integrated, data-driven environments, aligning with the broader Industry 4.0 Market paradigm. This continuous evolution, marked by advancements in cloud-native solutions, edge AI, and enhanced connectivity, ensures the Component segment will retain its dominant status in the Smart Manufacturing Industry for the foreseeable future, making it a critical focus area for technological innovation and investment.
Key Market Drivers & Constraints in Smart Manufacturing Industry
The Smart Manufacturing Industry's trajectory is primarily shaped by a confluence of powerful drivers and formidable constraints, each exerting significant influence on market adoption and expansion. A paramount driver is the increasing demand for automation to achieve efficiency and quality. Manufacturers globally are under immense pressure to reduce operational costs, minimize waste, and enhance product quality and consistency. Automation, facilitated by the Industrial Automation Market and advanced control systems, directly addresses these needs by streamlining production lines, reducing human error, and enabling continuous operation. For instance, the deployment of intelligent automation systems can yield a 15-20% reduction in operational downtime and a 10-15% improvement in product quality within sectors like the Automotive Manufacturing Market.
Another significant driver is the need for compliance and government support for digitization. Regulatory bodies are increasingly mandating stringent quality, safety, and environmental standards, necessitating robust data traceability and transparent manufacturing processes. Governments worldwide are also championing initiatives like "Industry 4.0" to boost national competitiveness, offering incentives, funding, and policy support for digital transformation. These initiatives not only ease the financial burden but also create a conducive environment for the adoption of smart manufacturing technologies. Furthermore, the proliferation of Internet of Things (IoT) technologies is a fundamental catalyst. The increasing deployment of sensors and connected devices across production facilities enables real-time data collection, remote monitoring, and predictive maintenance. This data-rich environment is critical for optimizing operations and fostering the growth of the IoT Platform Market, leading to more informed decision-making and agile responses to production challenges.
Conversely, the market faces notable constraints. Concerns regarding data security represent a major deterrent. As manufacturing systems become increasingly interconnected, they become more vulnerable to cyber threats, data breaches, and intellectual property theft. The potential for disruption to critical infrastructure and the financial and reputational damage from security incidents necessitate significant investment in cybersecurity, which can be prohibitive for some enterprises. The high initial installation costs of smart manufacturing solutions, including hardware, software licenses, and integration services, also pose a substantial barrier. Implementing advanced Robotics Market solutions or a comprehensive Manufacturing Execution System can entail multi-million-dollar investments, limiting uptake, particularly among Small & Medium Enterprises (SMEs) with tighter capital budgets. Lastly, a persistent lack of a skilled workforce capable of deploying, operating, and maintaining these sophisticated systems prevents enterprises from full-scale adoption. The gap between existing skill sets and the demands of digital manufacturing requires significant investment in training and education, a challenge many organizations are still grappling with.
Competitive Ecosystem of Smart Manufacturing Industry
The Smart Manufacturing Industry is characterized by a dynamic and highly competitive landscape, with a mix of multinational conglomerates and specialized technology providers. Key players are continually innovating to offer comprehensive solutions spanning hardware, software, and services.
- Honeywell International Inc: A global leader known for its automation and control technologies, providing integrated software and hardware solutions that enhance operational efficiency and safety in industrial environments.
- ABB Ltd: A pioneering technology company that offers a broad portfolio of electrification products, robotics, industrial automation, and motion solutions, focusing on digital transformation for various industries.
- Mitsubishi Electric Corporation: A diversified electronics company with a strong presence in industrial automation, providing a range of products from PLCs and drives to advanced factory automation systems and solutions.
- Siemens AG: A European industrial giant, recognized for its extensive digital enterprise suite, including PLM software, automation systems, and industrial IoT solutions, driving the digital transformation of manufacturing.
- Schneider Electric SE: Specializes in energy management and automation, offering integrated solutions for industrial control, software, and services that enable smart factory operations and energy efficiency.
- Fanuc Corporation: A leading global manufacturer of factory automation products, including industrial robots, CNC systems, and Robomachines, playing a crucial role in the Robotics Market.
- Robert Bosch GmbH: A global technology and services company, contributing to smart manufacturing through its IoT solutions, sensor technology, and automation components for various industrial applications.
- Texas Instruments Incorporated: A semiconductor design and manufacturing company providing crucial integrated circuits and embedded processors that are fundamental components of smart manufacturing hardware and Industrial Sensors Market.
- Rockwell Automation Inc: A dedicated industrial automation and information solutions provider, known for its control systems, software, and services that help manufacturers achieve operational excellence.
- Yokogawa Electric Corporation: A major provider of industrial automation and control solutions, specializing in process control, enterprise resource planning, and test and measurement equipment for industries.
- General Electric Company: An industrial powerhouse with contributions to smart manufacturing through its digital industrial software, cloud-based MES, and advanced analytics platforms, enhancing factory output and quality.
- Emerson Electric Company: A global technology and engineering company offering solutions for process, industrial, commercial, and residential markets, with a focus on automation technologies and software.
Recent Developments & Milestones in Smart Manufacturing Industry
The Smart Manufacturing Industry is continually evolving, marked by strategic investments, partnerships, and technological enhancements aimed at expanding capabilities and addressing emerging market demands.
- December 2023: TeamViewer announced strategic investments in two pioneering companies focused on smart factory solutions: Sight Machine and Cybus. This initiative significantly strengthens TeamViewer's dedication to digitalizing industrial workplaces and fostering the convergence of IT and OT. These investments are instrumental in positioning TeamViewer as a leading provider of enterprise software, adept at linking manufacturing infrastructure, IT systems, and advanced data analytics.
- February 2023: General Electric Company unveiled new enhancements to its cloud-based Manufacturing Execution System (MES). The improved cloud-based MES software now offers more cost-effective and highly configurable solutions for Overall Equipment Effectiveness (OEE), production management, and quality control, catering to manufacturers of all sizes. This allows discrete, process, and mixed environment manufacturers to significantly reduce costs and maintenance efforts while simultaneously increasing security with a comprehensive cloud MES solution.
- July 2022: ABB and SKF formally entered into a Memorandum of Understanding (MoU) to collaboratively explore potential opportunities for automation in manufacturing processes. Through this strategic partnership, both companies aim to evaluate, identify, and develop innovative solutions designed to enhance manufacturing capabilities and provide robust support for their clients in achieving increased production efficiency.
Regional Market Breakdown for Smart Manufacturing Industry
The Smart Manufacturing Industry exhibits distinct regional dynamics influenced by varying levels of industrialization, technological adoption, and government support. While specific regional CAGRs and revenue shares are subject to ongoing market research, the following outlines the general market landscape and primary drivers across key regions, based on observed market trends and industry activity.
Asia Pacific is anticipated to be the fastest-growing region in the Smart Manufacturing Industry. This growth is primarily fueled by rapid industrialization, particularly in emerging economies like China and India, coupled with substantial government initiatives such as "Made in China 2025" and "Make in India." These programs actively promote the adoption of advanced manufacturing technologies, fostering significant investments in factory automation, Robotics Market, and digital infrastructure. The region also boasts a large and expanding manufacturing base, especially within the Electronics & Semiconductors and Automotive Manufacturing Market sectors, which are eager to adopt smart solutions for efficiency and global competitiveness. The sheer scale of manufacturing output and the ongoing digital transformation efforts position Asia Pacific as a critical growth engine.
North America and Europe represent mature markets with high penetration of advanced manufacturing technologies. These regions are characterized by a strong focus on optimizing existing infrastructure, enhancing productivity, and improving supply chain resilience. The presence of leading technology providers and early adopters of Industry 4.0 Market principles drives continuous innovation and investment in Artificial Intelligence Market solutions, Industrial Automation Market, and sophisticated analytics. While their growth rates may be slightly lower than Asia Pacific due to higher maturity, their absolute market values and continued investment in R&D and advanced capabilities remain substantial. The primary demand drivers in these regions include the need for skilled labor augmentation, product customization, and adherence to stringent environmental and quality regulations.
Latin America and the Middle East and Africa are emerging markets for smart manufacturing. Adoption rates are comparatively slower, largely due to higher initial installation costs, lower digital literacy, and, in some cases, less developed industrial infrastructure. However, selective investments are being made, particularly in sectors like Chemicals & Petrochemicals and Metals & Mining in the Middle East, driven by the need for operational efficiency and diversification from traditional resource-based economies. Brazil and Mexico show promise in Latin America, influenced by their ties to global manufacturing supply chains. The long-term growth in these regions will be contingent on sustained economic development, increased foreign direct investment, and enhanced government support for industrial digitization initiatives.
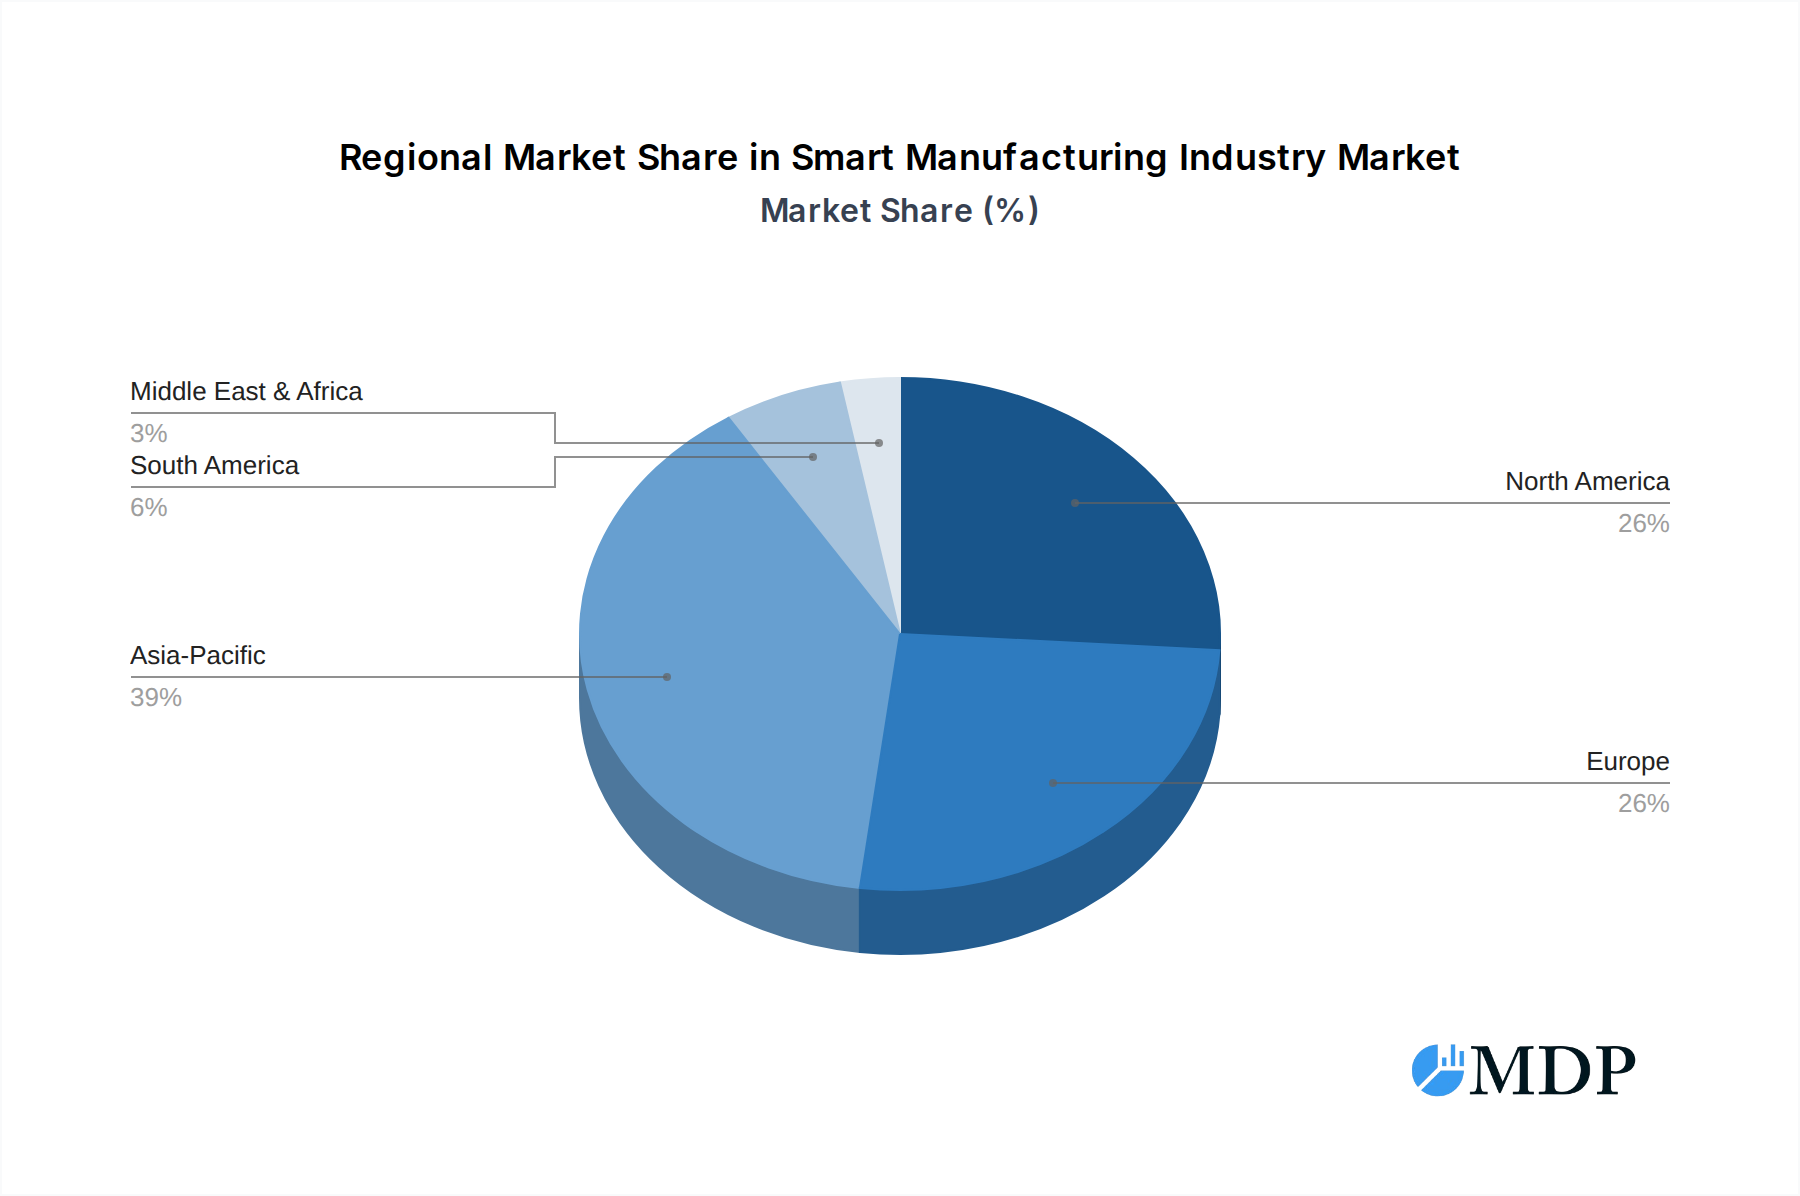
Smart Manufacturing Industry Regional Market Share
Supply Chain & Raw Material Dynamics for Smart Manufacturing Industry
The Smart Manufacturing Industry is inherently reliant on a complex global supply chain, with upstream dependencies ranging from high-precision electronic components to specialized raw materials. Key inputs include semiconductors, microcontrollers, advanced Industrial Sensors Market, and various specialized metals and rare earth elements critical for the production of Robotics Market and advanced machinery. The supply chain is highly susceptible to geopolitical risks, trade disputes, and natural disasters, as evidenced by recent global semiconductor shortages, which profoundly impacted the Automotive Manufacturing Market and other electronics-dependent sectors. Price volatility of these key inputs, particularly silicon for chips and rare earth magnets for high-performance motors, can significantly influence production costs and market pricing.
Sourcing risks are exacerbated by the concentration of certain critical component manufacturing in specific regions. For instance, the dominance of East Asian countries in semiconductor fabrication creates a single point of failure risk for the global Smart Manufacturing Industry. Disruptions, whether from pandemic-related lockdowns or trade restrictions, lead to extended lead times, escalated component costs, and, in severe cases, production halts. The price trends for crucial materials like copper (used in wiring and motors) and steel (for machine frames) also contribute to cost fluctuations. Manufacturers within the Smart Manufacturing Industry must strategically manage these dependencies through diversification of suppliers, localized production capabilities where feasible, and long-term procurement contracts to mitigate exposure to price spikes and supply interruptions. The need for resilient supply chains is becoming a core strategic imperative, driving investments in localized sourcing and digital tools for real-time supply chain visibility.
Pricing Dynamics & Margin Pressure in Smart Manufacturing Industry
The pricing dynamics within the Smart Manufacturing Industry are characterized by a dichotomy: a general trend of decreasing average selling prices (ASPs) for commoditized hardware components and basic software licenses, juxtaposed with premium pricing for highly specialized software, Artificial Intelligence Market solutions, and value-added services. Margin structures vary significantly across the value chain. Hardware manufacturers often face intense margin pressure due to high R&D costs, fierce competition, and increasing raw material costs (e.g., metals, semiconductors). Conversely, proprietary software providers, especially those offering niche Industrial IoT Market platforms or advanced analytics, tend to enjoy higher margins due to intellectual property protection and the recurring revenue models of subscription services.
Key cost levers influencing pricing include significant R&D investments required to develop cutting-edge technologies, the economies of scale achieved through mass production of standard components, and the cost of highly skilled labor for system integration, deployment, and ongoing maintenance. Competitive intensity is a major factor, particularly in established segments of the Industrial Automation Market. This intensity drives down prices for standard solutions, forcing companies to differentiate through innovation, superior performance, or comprehensive service packages. Meanwhile, specialized solutions that address unique industry challenges or offer significant competitive advantages can command premium pricing. The impact of commodity cycles, such as fluctuations in energy prices affecting manufacturing costs or changes in metal prices for Robotics Market components, directly influences the cost base of hardware providers, subsequently affecting their pricing strategies and overall margin health. Manufacturers are increasingly moving towards outcome-based pricing models for services and software, aligning their revenue with the tangible benefits delivered to customers, thereby creating a more value-centric pricing dynamic within the Smart Manufacturing Industry.
Smart Manufacturing Industry Segmentation
-
1. Component
- 1.1. Hardware
- 1.2. Software
- 1.3. Services
-
2. Manufacturing Process
- 2.1. Discrete Manufacturing
- 2.2. Process Manufacturing
- 2.3. Hybrid Manufacturing
-
3. Enterprise Size
- 3.1. Large Enterprises
- 3.2. Small & Medium Enterprises (SMEs)
-
4. End User Industry
- 4.1. Automotive
- 4.2. Electronics & Semiconductors
- 4.3. Machinery & Industrial Equipment
- 4.4. Machinery & Industrial Equipment
- 4.5. Aerospace & Defense
- 4.6. Chemicals & Petrochemicals
- 4.7. Pharmaceuticals & Biotechnology
- 4.8. Food & Beverage
- 4.9. Metals & Mining
- 4.10. Energy & Power
- 4.11. Textiles & Apparel
- 4.12. Consumer Goods
- 4.13. Others
Smart Manufacturing Industry Segmentation By Geography
-
1. North America
- 1.1. United States
- 1.2. Canada
-
2. Europe
- 2.1. Germany
- 2.2. United Kingdom
- 2.3. France
- 2.4. Rest of Europe
-
3. Asia Pacific
- 3.1. China
- 3.2. India
- 3.3. Japan
- 3.4. Rest of Asia Pacific
-
4. Latin America
- 4.1. Brazil
- 4.2. Mexico
- 4.3. Rest of Latin America
- 5. Middle East and Africa
Smart Manufacturing Industry Regional Market Share
Geographic Coverage of Smart Manufacturing Industry
Smart Manufacturing Industry REPORT HIGHLIGHTS
| Aspects | Details |
|---|---|
| Study Period | 2020-2034 |
| Base Year | 2025 |
| Estimated Year | 2026 |
| Forecast Period | 2026-2034 |
| Historical Period | 2020-2025 |
| Growth Rate | CAGR of 14.58% from 2020-2034 |
| Segmentation |
|
Table of Contents
- 1. Introduction
- 1.1. Research Scope
- 1.2. Market Segmentation
- 1.3. Research Objective
- 1.4. Definitions and Assumptions
- 2. Executive Summary
- 2.1. Market Snapshot
- 3. Market Dynamics
- 3.1. Market Drivers
- 3.2. Market Restrains
- 3.3. Market Trends
- 3.4. Market Opportunities
- 4. Market Factor Analysis
- 4.1. Porters Five Forces
- 4.1.1. Bargaining Power of Suppliers
- 4.1.2. Bargaining Power of Buyers
- 4.1.3. Threat of New Entrants
- 4.1.4. Threat of Substitutes
- 4.1.5. Competitive Rivalry
- 4.2. PESTEL analysis
- 4.3. BCG Analysis
- 4.3.1. Stars (High Growth, High Market Share)
- 4.3.2. Cash Cows (Low Growth, High Market Share)
- 4.3.3. Question Mark (High Growth, Low Market Share)
- 4.3.4. Dogs (Low Growth, Low Market Share)
- 4.4. Ansoff Matrix Analysis
- 4.5. Supply Chain Analysis
- 4.6. Regulatory Landscape
- 4.7. Current Market Potential and Opportunity Assessment (TAM–SAM–SOM Framework)
- 4.8. MDP Analyst Note
- 4.1. Porters Five Forces
- 5. Market Analysis, Insights and Forecast 2021-2033
- 5.1. Market Analysis, Insights and Forecast - by Component
- 5.1.1. Hardware
- 5.1.2. Software
- 5.1.3. Services
- 5.2. Market Analysis, Insights and Forecast - by Manufacturing Process
- 5.2.1. Discrete Manufacturing
- 5.2.2. Process Manufacturing
- 5.2.3. Hybrid Manufacturing
- 5.3. Market Analysis, Insights and Forecast - by Enterprise Size
- 5.3.1. Large Enterprises
- 5.3.2. Small & Medium Enterprises (SMEs)
- 5.4. Market Analysis, Insights and Forecast - by End User Industry
- 5.4.1. Automotive
- 5.4.2. Electronics & Semiconductors
- 5.4.3. Machinery & Industrial Equipment
- 5.4.4. Machinery & Industrial Equipment
- 5.4.5. Aerospace & Defense
- 5.4.6. Chemicals & Petrochemicals
- 5.4.7. Pharmaceuticals & Biotechnology
- 5.4.8. Food & Beverage
- 5.4.9. Metals & Mining
- 5.4.10. Energy & Power
- 5.4.11. Textiles & Apparel
- 5.4.12. Consumer Goods
- 5.4.13. Others
- 5.5. Market Analysis, Insights and Forecast - by Region
- 5.5.1. North America
- 5.5.2. Europe
- 5.5.3. Asia Pacific
- 5.5.4. Latin America
- 5.5.5. Middle East and Africa
- 5.1. Market Analysis, Insights and Forecast - by Component
- 6. Global Smart Manufacturing Industry Analysis, Insights and Forecast, 2021-2033
- 6.1. Market Analysis, Insights and Forecast - by Component
- 6.1.1. Hardware
- 6.1.2. Software
- 6.1.3. Services
- 6.2. Market Analysis, Insights and Forecast - by Manufacturing Process
- 6.2.1. Discrete Manufacturing
- 6.2.2. Process Manufacturing
- 6.2.3. Hybrid Manufacturing
- 6.3. Market Analysis, Insights and Forecast - by Enterprise Size
- 6.3.1. Large Enterprises
- 6.3.2. Small & Medium Enterprises (SMEs)
- 6.4. Market Analysis, Insights and Forecast - by End User Industry
- 6.4.1. Automotive
- 6.4.2. Electronics & Semiconductors
- 6.4.3. Machinery & Industrial Equipment
- 6.4.4. Machinery & Industrial Equipment
- 6.4.5. Aerospace & Defense
- 6.4.6. Chemicals & Petrochemicals
- 6.4.7. Pharmaceuticals & Biotechnology
- 6.4.8. Food & Beverage
- 6.4.9. Metals & Mining
- 6.4.10. Energy & Power
- 6.4.11. Textiles & Apparel
- 6.4.12. Consumer Goods
- 6.4.13. Others
- 6.1. Market Analysis, Insights and Forecast - by Component
- 7. North America Smart Manufacturing Industry Analysis, Insights and Forecast, 2020-2032
- 7.1. Market Analysis, Insights and Forecast - by Component
- 7.1.1. Hardware
- 7.1.2. Software
- 7.1.3. Services
- 7.2. Market Analysis, Insights and Forecast - by Manufacturing Process
- 7.2.1. Discrete Manufacturing
- 7.2.2. Process Manufacturing
- 7.2.3. Hybrid Manufacturing
- 7.3. Market Analysis, Insights and Forecast - by Enterprise Size
- 7.3.1. Large Enterprises
- 7.3.2. Small & Medium Enterprises (SMEs)
- 7.4. Market Analysis, Insights and Forecast - by End User Industry
- 7.4.1. Automotive
- 7.4.2. Electronics & Semiconductors
- 7.4.3. Machinery & Industrial Equipment
- 7.4.4. Machinery & Industrial Equipment
- 7.4.5. Aerospace & Defense
- 7.4.6. Chemicals & Petrochemicals
- 7.4.7. Pharmaceuticals & Biotechnology
- 7.4.8. Food & Beverage
- 7.4.9. Metals & Mining
- 7.4.10. Energy & Power
- 7.4.11. Textiles & Apparel
- 7.4.12. Consumer Goods
- 7.4.13. Others
- 7.1. Market Analysis, Insights and Forecast - by Component
- 8. Europe Smart Manufacturing Industry Analysis, Insights and Forecast, 2020-2032
- 8.1. Market Analysis, Insights and Forecast - by Component
- 8.1.1. Hardware
- 8.1.2. Software
- 8.1.3. Services
- 8.2. Market Analysis, Insights and Forecast - by Manufacturing Process
- 8.2.1. Discrete Manufacturing
- 8.2.2. Process Manufacturing
- 8.2.3. Hybrid Manufacturing
- 8.3. Market Analysis, Insights and Forecast - by Enterprise Size
- 8.3.1. Large Enterprises
- 8.3.2. Small & Medium Enterprises (SMEs)
- 8.4. Market Analysis, Insights and Forecast - by End User Industry
- 8.4.1. Automotive
- 8.4.2. Electronics & Semiconductors
- 8.4.3. Machinery & Industrial Equipment
- 8.4.4. Machinery & Industrial Equipment
- 8.4.5. Aerospace & Defense
- 8.4.6. Chemicals & Petrochemicals
- 8.4.7. Pharmaceuticals & Biotechnology
- 8.4.8. Food & Beverage
- 8.4.9. Metals & Mining
- 8.4.10. Energy & Power
- 8.4.11. Textiles & Apparel
- 8.4.12. Consumer Goods
- 8.4.13. Others
- 8.1. Market Analysis, Insights and Forecast - by Component
- 9. Asia Pacific Smart Manufacturing Industry Analysis, Insights and Forecast, 2020-2032
- 9.1. Market Analysis, Insights and Forecast - by Component
- 9.1.1. Hardware
- 9.1.2. Software
- 9.1.3. Services
- 9.2. Market Analysis, Insights and Forecast - by Manufacturing Process
- 9.2.1. Discrete Manufacturing
- 9.2.2. Process Manufacturing
- 9.2.3. Hybrid Manufacturing
- 9.3. Market Analysis, Insights and Forecast - by Enterprise Size
- 9.3.1. Large Enterprises
- 9.3.2. Small & Medium Enterprises (SMEs)
- 9.4. Market Analysis, Insights and Forecast - by End User Industry
- 9.4.1. Automotive
- 9.4.2. Electronics & Semiconductors
- 9.4.3. Machinery & Industrial Equipment
- 9.4.4. Machinery & Industrial Equipment
- 9.4.5. Aerospace & Defense
- 9.4.6. Chemicals & Petrochemicals
- 9.4.7. Pharmaceuticals & Biotechnology
- 9.4.8. Food & Beverage
- 9.4.9. Metals & Mining
- 9.4.10. Energy & Power
- 9.4.11. Textiles & Apparel
- 9.4.12. Consumer Goods
- 9.4.13. Others
- 9.1. Market Analysis, Insights and Forecast - by Component
- 10. Latin America Smart Manufacturing Industry Analysis, Insights and Forecast, 2020-2032
- 10.1. Market Analysis, Insights and Forecast - by Component
- 10.1.1. Hardware
- 10.1.2. Software
- 10.1.3. Services
- 10.2. Market Analysis, Insights and Forecast - by Manufacturing Process
- 10.2.1. Discrete Manufacturing
- 10.2.2. Process Manufacturing
- 10.2.3. Hybrid Manufacturing
- 10.3. Market Analysis, Insights and Forecast - by Enterprise Size
- 10.3.1. Large Enterprises
- 10.3.2. Small & Medium Enterprises (SMEs)
- 10.4. Market Analysis, Insights and Forecast - by End User Industry
- 10.4.1. Automotive
- 10.4.2. Electronics & Semiconductors
- 10.4.3. Machinery & Industrial Equipment
- 10.4.4. Machinery & Industrial Equipment
- 10.4.5. Aerospace & Defense
- 10.4.6. Chemicals & Petrochemicals
- 10.4.7. Pharmaceuticals & Biotechnology
- 10.4.8. Food & Beverage
- 10.4.9. Metals & Mining
- 10.4.10. Energy & Power
- 10.4.11. Textiles & Apparel
- 10.4.12. Consumer Goods
- 10.4.13. Others
- 10.1. Market Analysis, Insights and Forecast - by Component
- 11. Middle East and Africa Smart Manufacturing Industry Analysis, Insights and Forecast, 2020-2032
- 11.1. Market Analysis, Insights and Forecast - by Component
- 11.1.1. Hardware
- 11.1.2. Software
- 11.1.3. Services
- 11.2. Market Analysis, Insights and Forecast - by Manufacturing Process
- 11.2.1. Discrete Manufacturing
- 11.2.2. Process Manufacturing
- 11.2.3. Hybrid Manufacturing
- 11.3. Market Analysis, Insights and Forecast - by Enterprise Size
- 11.3.1. Large Enterprises
- 11.3.2. Small & Medium Enterprises (SMEs)
- 11.4. Market Analysis, Insights and Forecast - by End User Industry
- 11.4.1. Automotive
- 11.4.2. Electronics & Semiconductors
- 11.4.3. Machinery & Industrial Equipment
- 11.4.4. Machinery & Industrial Equipment
- 11.4.5. Aerospace & Defense
- 11.4.6. Chemicals & Petrochemicals
- 11.4.7. Pharmaceuticals & Biotechnology
- 11.4.8. Food & Beverage
- 11.4.9. Metals & Mining
- 11.4.10. Energy & Power
- 11.4.11. Textiles & Apparel
- 11.4.12. Consumer Goods
- 11.4.13. Others
- 11.1. Market Analysis, Insights and Forecast - by Component
- 12. Competitive Analysis
- 12.1. Company Profiles
- 12.1.1 Honeywell International Inc
- 12.1.1.1. Company Overview
- 12.1.1.2. Products
- 12.1.1.3. Company Financials
- 12.1.1.4. SWOT Analysis
- 12.1.2 ABB Ltd
- 12.1.2.1. Company Overview
- 12.1.2.2. Products
- 12.1.2.3. Company Financials
- 12.1.2.4. SWOT Analysis
- 12.1.3 Mitsubishi Electric Corporation
- 12.1.3.1. Company Overview
- 12.1.3.2. Products
- 12.1.3.3. Company Financials
- 12.1.3.4. SWOT Analysis
- 12.1.4 Siemens AG
- 12.1.4.1. Company Overview
- 12.1.4.2. Products
- 12.1.4.3. Company Financials
- 12.1.4.4. SWOT Analysis
- 12.1.5 Schneider Electric SE
- 12.1.5.1. Company Overview
- 12.1.5.2. Products
- 12.1.5.3. Company Financials
- 12.1.5.4. SWOT Analysis
- 12.1.6 Fanuc Corporation
- 12.1.6.1. Company Overview
- 12.1.6.2. Products
- 12.1.6.3. Company Financials
- 12.1.6.4. SWOT Analysis
- 12.1.7 Robert Bosch GmbH
- 12.1.7.1. Company Overview
- 12.1.7.2. Products
- 12.1.7.3. Company Financials
- 12.1.7.4. SWOT Analysis
- 12.1.8 Texas Instruments Incorporated
- 12.1.8.1. Company Overview
- 12.1.8.2. Products
- 12.1.8.3. Company Financials
- 12.1.8.4. SWOT Analysis
- 12.1.9 Rockwell Automation Inc
- 12.1.9.1. Company Overview
- 12.1.9.2. Products
- 12.1.9.3. Company Financials
- 12.1.9.4. SWOT Analysis
- 12.1.10 Yokogawa Electric Corporation
- 12.1.10.1. Company Overview
- 12.1.10.2. Products
- 12.1.10.3. Company Financials
- 12.1.10.4. SWOT Analysis
- 12.1.11 General Electric Company
- 12.1.11.1. Company Overview
- 12.1.11.2. Products
- 12.1.11.3. Company Financials
- 12.1.11.4. SWOT Analysis
- 12.1.12 Emerson Electric Company
- 12.1.12.1. Company Overview
- 12.1.12.2. Products
- 12.1.12.3. Company Financials
- 12.1.12.4. SWOT Analysis
- 12.1.1 Honeywell International Inc
- 12.2. Market Entropy
- 12.2.1 Company's Key Areas Served
- 12.2.2 Recent Developments
- 12.3. Company Market Share Analysis 2025
- 12.3.1 Top 5 Companies Market Share Analysis
- 12.3.2 Top 3 Companies Market Share Analysis
- 12.4. List of Potential Customers
- 13. Research Methodology
List of Figures
- Figure 1: Global Smart Manufacturing Industry Revenue Breakdown (Million, %) by Region 2025 & 2033
- Figure 2: North America Smart Manufacturing Industry Revenue (Million), by Component 2025 & 2033
- Figure 3: North America Smart Manufacturing Industry Revenue Share (%), by Component 2025 & 2033
- Figure 4: North America Smart Manufacturing Industry Revenue (Million), by Manufacturing Process 2025 & 2033
- Figure 5: North America Smart Manufacturing Industry Revenue Share (%), by Manufacturing Process 2025 & 2033
- Figure 6: North America Smart Manufacturing Industry Revenue (Million), by Enterprise Size 2025 & 2033
- Figure 7: North America Smart Manufacturing Industry Revenue Share (%), by Enterprise Size 2025 & 2033
- Figure 8: North America Smart Manufacturing Industry Revenue (Million), by End User Industry 2025 & 2033
- Figure 9: North America Smart Manufacturing Industry Revenue Share (%), by End User Industry 2025 & 2033
- Figure 10: North America Smart Manufacturing Industry Revenue (Million), by Country 2025 & 2033
- Figure 11: North America Smart Manufacturing Industry Revenue Share (%), by Country 2025 & 2033
- Figure 12: Europe Smart Manufacturing Industry Revenue (Million), by Component 2025 & 2033
- Figure 13: Europe Smart Manufacturing Industry Revenue Share (%), by Component 2025 & 2033
- Figure 14: Europe Smart Manufacturing Industry Revenue (Million), by Manufacturing Process 2025 & 2033
- Figure 15: Europe Smart Manufacturing Industry Revenue Share (%), by Manufacturing Process 2025 & 2033
- Figure 16: Europe Smart Manufacturing Industry Revenue (Million), by Enterprise Size 2025 & 2033
- Figure 17: Europe Smart Manufacturing Industry Revenue Share (%), by Enterprise Size 2025 & 2033
- Figure 18: Europe Smart Manufacturing Industry Revenue (Million), by End User Industry 2025 & 2033
- Figure 19: Europe Smart Manufacturing Industry Revenue Share (%), by End User Industry 2025 & 2033
- Figure 20: Europe Smart Manufacturing Industry Revenue (Million), by Country 2025 & 2033
- Figure 21: Europe Smart Manufacturing Industry Revenue Share (%), by Country 2025 & 2033
- Figure 22: Asia Pacific Smart Manufacturing Industry Revenue (Million), by Component 2025 & 2033
- Figure 23: Asia Pacific Smart Manufacturing Industry Revenue Share (%), by Component 2025 & 2033
- Figure 24: Asia Pacific Smart Manufacturing Industry Revenue (Million), by Manufacturing Process 2025 & 2033
- Figure 25: Asia Pacific Smart Manufacturing Industry Revenue Share (%), by Manufacturing Process 2025 & 2033
- Figure 26: Asia Pacific Smart Manufacturing Industry Revenue (Million), by Enterprise Size 2025 & 2033
- Figure 27: Asia Pacific Smart Manufacturing Industry Revenue Share (%), by Enterprise Size 2025 & 2033
- Figure 28: Asia Pacific Smart Manufacturing Industry Revenue (Million), by End User Industry 2025 & 2033
- Figure 29: Asia Pacific Smart Manufacturing Industry Revenue Share (%), by End User Industry 2025 & 2033
- Figure 30: Asia Pacific Smart Manufacturing Industry Revenue (Million), by Country 2025 & 2033
- Figure 31: Asia Pacific Smart Manufacturing Industry Revenue Share (%), by Country 2025 & 2033
- Figure 32: Latin America Smart Manufacturing Industry Revenue (Million), by Component 2025 & 2033
- Figure 33: Latin America Smart Manufacturing Industry Revenue Share (%), by Component 2025 & 2033
- Figure 34: Latin America Smart Manufacturing Industry Revenue (Million), by Manufacturing Process 2025 & 2033
- Figure 35: Latin America Smart Manufacturing Industry Revenue Share (%), by Manufacturing Process 2025 & 2033
- Figure 36: Latin America Smart Manufacturing Industry Revenue (Million), by Enterprise Size 2025 & 2033
- Figure 37: Latin America Smart Manufacturing Industry Revenue Share (%), by Enterprise Size 2025 & 2033
- Figure 38: Latin America Smart Manufacturing Industry Revenue (Million), by End User Industry 2025 & 2033
- Figure 39: Latin America Smart Manufacturing Industry Revenue Share (%), by End User Industry 2025 & 2033
- Figure 40: Latin America Smart Manufacturing Industry Revenue (Million), by Country 2025 & 2033
- Figure 41: Latin America Smart Manufacturing Industry Revenue Share (%), by Country 2025 & 2033
- Figure 42: Middle East and Africa Smart Manufacturing Industry Revenue (Million), by Component 2025 & 2033
- Figure 43: Middle East and Africa Smart Manufacturing Industry Revenue Share (%), by Component 2025 & 2033
- Figure 44: Middle East and Africa Smart Manufacturing Industry Revenue (Million), by Manufacturing Process 2025 & 2033
- Figure 45: Middle East and Africa Smart Manufacturing Industry Revenue Share (%), by Manufacturing Process 2025 & 2033
- Figure 46: Middle East and Africa Smart Manufacturing Industry Revenue (Million), by Enterprise Size 2025 & 2033
- Figure 47: Middle East and Africa Smart Manufacturing Industry Revenue Share (%), by Enterprise Size 2025 & 2033
- Figure 48: Middle East and Africa Smart Manufacturing Industry Revenue (Million), by End User Industry 2025 & 2033
- Figure 49: Middle East and Africa Smart Manufacturing Industry Revenue Share (%), by End User Industry 2025 & 2033
- Figure 50: Middle East and Africa Smart Manufacturing Industry Revenue (Million), by Country 2025 & 2033
- Figure 51: Middle East and Africa Smart Manufacturing Industry Revenue Share (%), by Country 2025 & 2033
List of Tables
- Table 1: Global Smart Manufacturing Industry Revenue Million Forecast, by Component 2020 & 2033
- Table 2: Global Smart Manufacturing Industry Revenue Million Forecast, by Manufacturing Process 2020 & 2033
- Table 3: Global Smart Manufacturing Industry Revenue Million Forecast, by Enterprise Size 2020 & 2033
- Table 4: Global Smart Manufacturing Industry Revenue Million Forecast, by End User Industry 2020 & 2033
- Table 5: Global Smart Manufacturing Industry Revenue Million Forecast, by Region 2020 & 2033
- Table 6: Global Smart Manufacturing Industry Revenue Million Forecast, by Component 2020 & 2033
- Table 7: Global Smart Manufacturing Industry Revenue Million Forecast, by Manufacturing Process 2020 & 2033
- Table 8: Global Smart Manufacturing Industry Revenue Million Forecast, by Enterprise Size 2020 & 2033
- Table 9: Global Smart Manufacturing Industry Revenue Million Forecast, by End User Industry 2020 & 2033
- Table 10: Global Smart Manufacturing Industry Revenue Million Forecast, by Country 2020 & 2033
- Table 11: United States Smart Manufacturing Industry Revenue (Million) Forecast, by Application 2020 & 2033
- Table 12: Canada Smart Manufacturing Industry Revenue (Million) Forecast, by Application 2020 & 2033
- Table 13: Global Smart Manufacturing Industry Revenue Million Forecast, by Component 2020 & 2033
- Table 14: Global Smart Manufacturing Industry Revenue Million Forecast, by Manufacturing Process 2020 & 2033
- Table 15: Global Smart Manufacturing Industry Revenue Million Forecast, by Enterprise Size 2020 & 2033
- Table 16: Global Smart Manufacturing Industry Revenue Million Forecast, by End User Industry 2020 & 2033
- Table 17: Global Smart Manufacturing Industry Revenue Million Forecast, by Country 2020 & 2033
- Table 18: Germany Smart Manufacturing Industry Revenue (Million) Forecast, by Application 2020 & 2033
- Table 19: United Kingdom Smart Manufacturing Industry Revenue (Million) Forecast, by Application 2020 & 2033
- Table 20: France Smart Manufacturing Industry Revenue (Million) Forecast, by Application 2020 & 2033
- Table 21: Rest of Europe Smart Manufacturing Industry Revenue (Million) Forecast, by Application 2020 & 2033
- Table 22: Global Smart Manufacturing Industry Revenue Million Forecast, by Component 2020 & 2033
- Table 23: Global Smart Manufacturing Industry Revenue Million Forecast, by Manufacturing Process 2020 & 2033
- Table 24: Global Smart Manufacturing Industry Revenue Million Forecast, by Enterprise Size 2020 & 2033
- Table 25: Global Smart Manufacturing Industry Revenue Million Forecast, by End User Industry 2020 & 2033
- Table 26: Global Smart Manufacturing Industry Revenue Million Forecast, by Country 2020 & 2033
- Table 27: China Smart Manufacturing Industry Revenue (Million) Forecast, by Application 2020 & 2033
- Table 28: India Smart Manufacturing Industry Revenue (Million) Forecast, by Application 2020 & 2033
- Table 29: Japan Smart Manufacturing Industry Revenue (Million) Forecast, by Application 2020 & 2033
- Table 30: Rest of Asia Pacific Smart Manufacturing Industry Revenue (Million) Forecast, by Application 2020 & 2033
- Table 31: Global Smart Manufacturing Industry Revenue Million Forecast, by Component 2020 & 2033
- Table 32: Global Smart Manufacturing Industry Revenue Million Forecast, by Manufacturing Process 2020 & 2033
- Table 33: Global Smart Manufacturing Industry Revenue Million Forecast, by Enterprise Size 2020 & 2033
- Table 34: Global Smart Manufacturing Industry Revenue Million Forecast, by End User Industry 2020 & 2033
- Table 35: Global Smart Manufacturing Industry Revenue Million Forecast, by Country 2020 & 2033
- Table 36: Brazil Smart Manufacturing Industry Revenue (Million) Forecast, by Application 2020 & 2033
- Table 37: Mexico Smart Manufacturing Industry Revenue (Million) Forecast, by Application 2020 & 2033
- Table 38: Rest of Latin America Smart Manufacturing Industry Revenue (Million) Forecast, by Application 2020 & 2033
- Table 39: Global Smart Manufacturing Industry Revenue Million Forecast, by Component 2020 & 2033
- Table 40: Global Smart Manufacturing Industry Revenue Million Forecast, by Manufacturing Process 2020 & 2033
- Table 41: Global Smart Manufacturing Industry Revenue Million Forecast, by Enterprise Size 2020 & 2033
- Table 42: Global Smart Manufacturing Industry Revenue Million Forecast, by End User Industry 2020 & 2033
- Table 43: Global Smart Manufacturing Industry Revenue Million Forecast, by Country 2020 & 2033
Frequently Asked Questions
1. What is the projected Compound Annual Growth Rate (CAGR) of the Smart Manufacturing Industry?
The projected CAGR is approximately 14.58%.
2. Which companies are prominent players in the Smart Manufacturing Industry?
Key companies in the market include Honeywell International Inc, ABB Ltd, Mitsubishi Electric Corporation, Siemens AG, Schneider Electric SE, Fanuc Corporation, Robert Bosch GmbH, Texas Instruments Incorporated, Rockwell Automation Inc, Yokogawa Electric Corporation, General Electric Company, Emerson Electric Company.
3. What are the main segments of the Smart Manufacturing Industry?
The market segments include Component, Manufacturing Process, Enterprise Size, End User Industry.
4. Can you provide details about the market size?
The market size is estimated to be USD 141.39 Million as of 2022.
5. What are some drivers contributing to market growth?
Increasing Demand for Automation to Achieve Efficiency and Quality; Need for Compliance and Government Support for Digitization; Proliferation of Internet of Things.
6. What are the notable trends driving market growth?
Automotive Industry is Expected to Drive the Market Growth.
7. Are there any restraints impacting market growth?
Concerns Regarding Data Security; High Initial Installation Costs and Lack of Skilled Workforce Preventing Enterprises from Full-scale Adoption.
8. Can you provide examples of recent developments in the market?
Dec 2023: TeamViewer announced strategic investments in two pioneering companies for smart factory solutions: Sight Machine and Cybus. This initiative strengthens TeamViewer's dedication to digitalizing industrial workplaces and merging IT & OT. Also, these investments pave the way for TeamViewer to become a top provider of enterprise software, linking manufacturing infrastructure, IT systems, and data analytics.
9. What pricing options are available for accessing the report?
Pricing options include single-user, multi-user, and enterprise licenses priced at USD 4750, USD 5250, and USD 8750 respectively.
10. Is the market size provided in terms of value or volume?
The market size is provided in terms of value, measured in Million.
11. Are there any specific market keywords associated with the report?
Yes, the market keyword associated with the report is "Smart Manufacturing Industry," which aids in identifying and referencing the specific market segment covered.
12. How do I determine which pricing option suits my needs best?
The pricing options vary based on user requirements and access needs. Individual users may opt for single-user licenses, while businesses requiring broader access may choose multi-user or enterprise licenses for cost-effective access to the report.
13. Are there any additional resources or data provided in the Smart Manufacturing Industry report?
While the report offers comprehensive insights, it's advisable to review the specific contents or supplementary materials provided to ascertain if additional resources or data are available.
14. How can I stay updated on further developments or reports in the Smart Manufacturing Industry?
To stay informed about further developments, trends, and reports in the Smart Manufacturing Industry, consider subscribing to industry newsletters, following relevant companies and organizations, or regularly checking reputable industry news sources and publications.
Methodology
Step 1 - Identification of Relevant Samples Size from Population Database


Step 2 - Approaches for Defining Global Market Size (Value, Volume* & Price*)

Note*: In applicable scenarios
Step 3 - Data Sources
Primary Research
- Web Analytics
- Survey Reports
- Research Institute
- Latest Research Reports
- Opinion Leaders
Secondary Research
- Annual Reports
- White Paper
- Latest Press Release
- Industry Association
- Paid Database
- Investor Presentations

Step 4 - Data Triangulation
Involves using different sources of information in order to increase the validity of a study
These sources are likely to be stakeholders in a program - participants, other researchers, program staff, other community members, and so on.
Then we put all data in single framework & apply various statistical tools to find out the dynamic on the market.
During the analysis stage, feedback from the stakeholder groups would be compared to determine areas of agreement as well as areas of divergence