

Key Insights
The 5G technology market is experiencing substantial growth, driven by escalating demand for high-speed data, ultra-low latency, and the expanding ecosystem of connected devices. The market is projected to reach $41.39 billion by 2025, expanding at a Compound Annual Growth Rate (CAGR) of 13.1% from 2025 to 2033. This rapid expansion is propelled by widespread 5G-enabled smartphone adoption, increasing demand for enhanced mobile broadband services globally, and significant 5G network deployments by telecommunication leaders. The burgeoning Internet of Things (IoT) sector and the need for reliable, high-bandwidth connections for mission-critical applications in healthcare and autonomous vehicles further accelerate growth. The development of private 5G networks for enterprise solutions also significantly contributes to market expansion. Key industry players are making substantial investments in infrastructure and service offerings, shaping a dynamic competitive environment. North America and Asia Pacific currently lead market growth, with Europe following. Emerging markets in Africa and South America present considerable future expansion potential as infrastructure investment and consumer adoption accelerate.
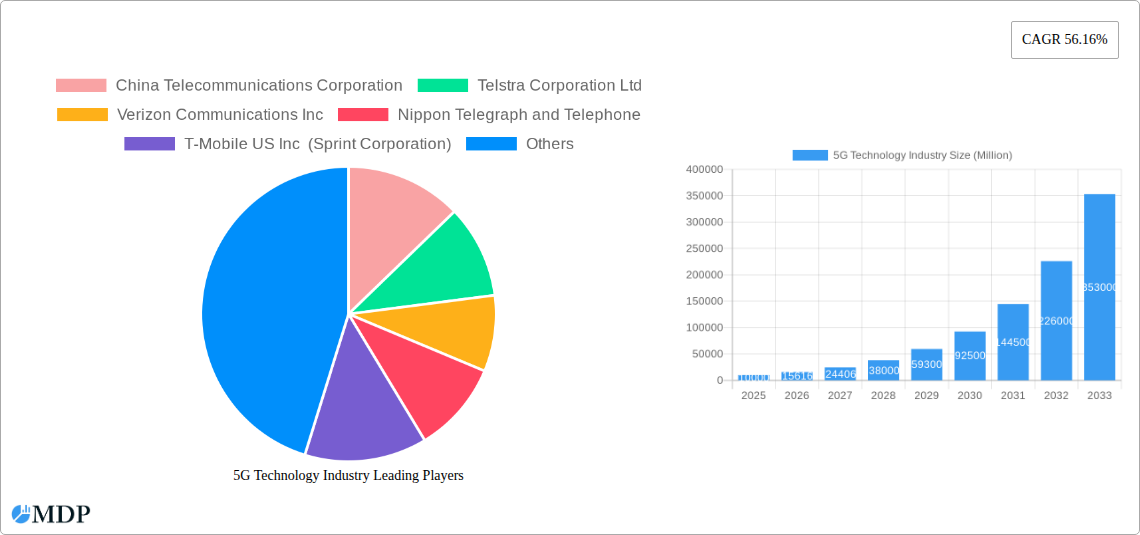
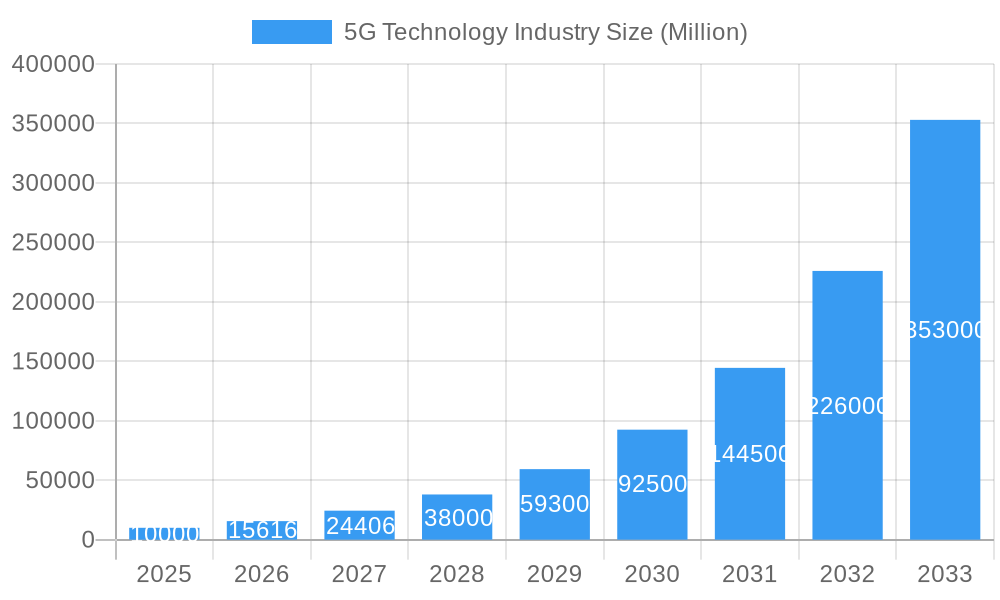
5G Technology Industry Market Size (In Billion)
Despite this strong growth trajectory, the 5G market faces challenges. Substantial initial capital expenditure for infrastructure and the requirement for spectrum allocation present significant barriers, particularly in developing economies. Interoperability challenges and the imperative for standardization to ensure seamless global connectivity are also considerable obstacles. Intense competition among telecommunication providers and the continuous emergence of innovative technologies further shape market dynamics. Moreover, addressing cybersecurity risks associated with an increasingly connected landscape is crucial for fostering consumer trust and ensuring secure adoption. The sustained success of the 5G market depends on effectively navigating these challenges while capitalizing on the vast opportunities presented by an evolving technological environment. Regional growth rates will vary based on regulatory frameworks, economic conditions, and localized infrastructure investments.
5G Technology Industry Company Market Share
5G Technology Industry: A Comprehensive Market Report (2019-2033)
This in-depth report provides a comprehensive analysis of the 5G technology industry, encompassing market dynamics, leading players, technological advancements, and future growth prospects. The study period covers 2019-2033, with a focus on the estimated year 2025 and a forecast period of 2025-2033. This report is essential for industry stakeholders, investors, and anyone seeking a clear understanding of this rapidly evolving sector. The report's key findings are backed by rigorous data analysis and provide actionable insights for informed decision-making. Millions are used for all values.
5G Technology Industry Market Dynamics & Concentration
The 5G technology market is characterized by intense competition and significant consolidation. Market concentration is increasing, with a few major players holding substantial market share. Innovation is a key driver, with continuous advancements in network infrastructure, device technology, and applications pushing market growth. Regulatory frameworks vary across regions, impacting market entry and expansion strategies. While fiber optics remain a strong competitor for fixed-line applications, 5G's mobility and potential for wider coverage are key differentiators. End-user demand, driven by the need for higher speeds and lower latency, is accelerating adoption. Furthermore, M&A activity is a significant trend, with larger companies acquiring smaller players to expand their market reach and capabilities.
- Market Share: The top five players (China Telecommunications Corporation, Verizon Communications Inc, AT&T Inc, Vodafone Group Plc, and Deutsche Telekom) hold an estimated xx% of the global market share in 2025.
- M&A Activity: An estimated xx M&A deals were recorded in the 5G sector between 2019 and 2024.
5G Technology Industry Industry Trends & Analysis
The 5G technology market is experiencing exponential growth, driven by several key factors. The compound annual growth rate (CAGR) is projected to be xx% from 2025 to 2033. Technological disruptions, such as the development of new spectrum bands and improved antenna technology, are enhancing network capabilities and expanding coverage. Consumer preferences are shifting towards high-bandwidth applications, fueling demand for 5G services. Competitive dynamics are shaping innovation and pricing strategies, leading to a more dynamic market landscape. Market penetration continues to rise; xx% of global mobile subscribers are expected to use 5G by 2033.
Leading Markets & Segments in 5G Technology Industry
North America and Asia are currently the leading markets for 5G technology deployment. Within these regions, countries with robust digital infrastructure and supportive government policies show faster adoption rates. Among the various connection types, Mobile Broadband currently dominates, followed by Fixed Wireless Access, while M2M and IoT and Mission-critical segments show strong growth potential.
- Key Drivers for Mobile Broadband: High demand for mobile data, widespread smartphone penetration, and readily available infrastructure.
- Key Drivers for Fixed Wireless Access: Cost-effective alternative to traditional fiber deployments in rural and underserved areas.
- Key Drivers for M2M and IoT: Growing applications in smart cities, industrial automation, and connected devices.
- Key Drivers for Mission-critical: Demand for reliable and low-latency communication in emergency services, transportation, and manufacturing.
5G Technology Industry Product Developments
Recent product innovations include enhanced network slicing capabilities, improved antenna designs, and the development of 5G-enabled devices for various applications, such as autonomous vehicles, smart healthcare, and industrial IoT. The integration of AI and machine learning is further enhancing network efficiency and user experience. These developments are improving market fit by addressing the demands for speed, reliability, and low latency.
Key Drivers of 5G Technology Industry Growth
Several factors are driving the growth of the 5G technology industry. Technological advancements, including higher bandwidth and lower latency, are enabling new applications and use cases. Economic incentives, such as government subsidies and private investment, are stimulating infrastructure development. Favorable regulatory environments are facilitating market entry and expansion. For example, the rapid rollout of 5G in India demonstrates the impact of supportive regulatory policies.
Challenges in the 5G Technology Industry Market
The 5G technology market faces several challenges, including regulatory hurdles around spectrum allocation and licensing, supply chain complexities impacting the availability of components, and intense competition among network operators and technology providers. These challenges are projected to impact market growth by xx% in the short term.
Emerging Opportunities in 5G Technology Industry
Emerging opportunities exist in the convergence of 5G with other technologies, such as AI, edge computing, and IoT. Strategic partnerships and collaborations are accelerating the development and adoption of 5G-enabled solutions across diverse sectors. Expansion into new markets, particularly in developing countries, offers significant growth potential.
Leading Players in the 5G Technology Industry Sector
Key Milestones in 5G Technology Industry Industry
- Oct 2022: 5G rolled out in India, showcasing speeds up to 10 Gbps. Bharti Airtel was the first to launch public services. This milestone significantly impacted market dynamics in India, demonstrating 5G's potential and driving increased investment.
- Oct 2022: Hyundai Mobis developed a 5G communication module for automotive use, projecting 52 Million vehicle adoption by 2028. This innovation has broadened the applications of 5G technology beyond traditional telecommunications, entering the rapidly growing automotive sector.
- Jan 2023: Bharti Airtel, in partnership with Apollo Hospitals, tested 5G-connected ambulances and AI-guided colonoscopies. This exemplifies 5G's potential in healthcare, highlighting its capacity to improve medical services through enhanced connectivity and data analysis.
Strategic Outlook for 5G Technology Industry Market
The 5G technology market presents immense future potential, with continued growth driven by increasing adoption of connected devices, the expansion of 5G networks, and the development of innovative applications. Strategic opportunities exist in vertical market penetration, such as healthcare and manufacturing, as well as in the development of advanced network architectures and services. The integration of 5G with other transformative technologies will further unlock growth potential in the coming years.
5G Technology Industry Segmentation
-
1. Connection Type
- 1.1. Mobile Broadband
- 1.2. Fixed Wireless Access
- 1.3. M2M and IoT
- 1.4. Mission-critical
-
2. Application
- 2.1. Consumer Services
- 2.2. Enterprise Services
- 2.3. Industrial Services
5G Technology Industry Segmentation By Geography
-
1. North America
- 1.1. United States
- 1.2. Canada
-
2. Europe
- 2.1. Germany
- 2.2. France
- 2.3. United Kingdom
- 2.4. Rest of Europe
-
3. Asia Pacific
- 3.1. India
- 3.2. China
- 3.3. Japan
- 3.4. Rest of Asia Pacific
- 4. Rest of the World
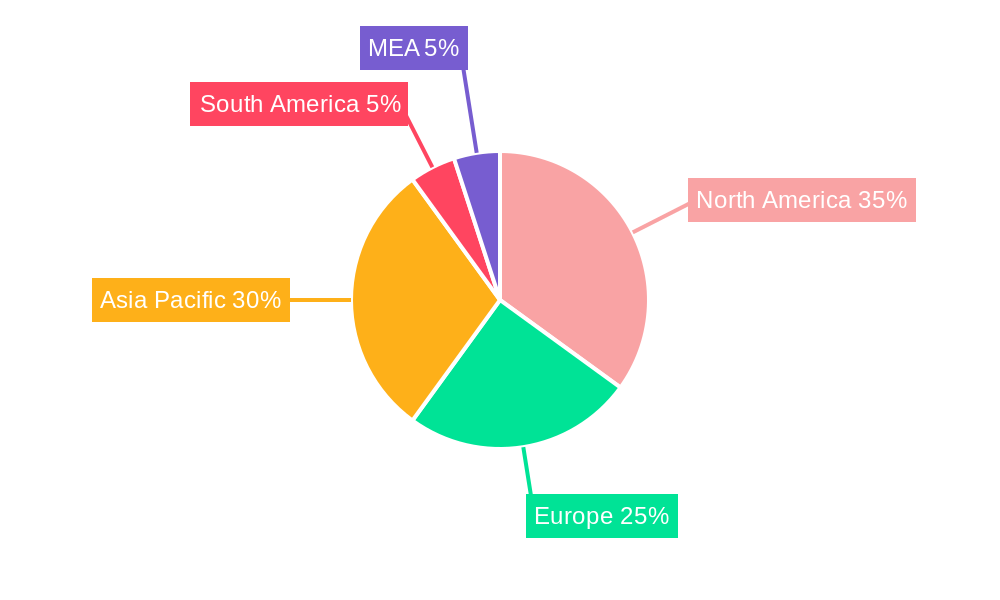
5G Technology Industry Regional Market Share
Geographic Coverage of 5G Technology Industry
5G Technology Industry REPORT HIGHLIGHTS
| Aspects | Details |
|---|---|
| Study Period | 2020-2034 |
| Base Year | 2025 |
| Estimated Year | 2026 |
| Forecast Period | 2026-2034 |
| Historical Period | 2020-2025 |
| Growth Rate | CAGR of 13.1% from 2020-2034 |
| Segmentation |
|
Table of Contents
- 1. Introduction
- 1.1. Research Scope
- 1.2. Market Segmentation
- 1.3. Research Objective
- 1.4. Definitions and Assumptions
- 2. Executive Summary
- 2.1. Market Snapshot
- 3. Market Dynamics
- 3.1. Market Drivers
- 3.2. Market Restrains
- 3.3. Market Trends
- 3.4. Market Opportunities
- 4. Market Factor Analysis
- 4.1. Porters Five Forces
- 4.1.1. Bargaining Power of Suppliers
- 4.1.2. Bargaining Power of Buyers
- 4.1.3. Threat of New Entrants
- 4.1.4. Threat of Substitutes
- 4.1.5. Competitive Rivalry
- 4.2. PESTEL analysis
- 4.3. BCG Analysis
- 4.3.1. Stars (High Growth, High Market Share)
- 4.3.2. Cash Cows (Low Growth, High Market Share)
- 4.3.3. Question Mark (High Growth, Low Market Share)
- 4.3.4. Dogs (Low Growth, Low Market Share)
- 4.4. Ansoff Matrix Analysis
- 4.5. Supply Chain Analysis
- 4.6. Regulatory Landscape
- 4.7. Current Market Potential and Opportunity Assessment (TAM–SAM–SOM Framework)
- 4.8. MDP Analyst Note
- 4.1. Porters Five Forces
- 5. Market Analysis, Insights and Forecast 2021-2033
- 5.1. Market Analysis, Insights and Forecast - by Connection Type
- 5.1.1. Mobile Broadband
- 5.1.2. Fixed Wireless Access
- 5.1.3. M2M and IoT
- 5.1.4. Mission-critical
- 5.2. Market Analysis, Insights and Forecast - by Application
- 5.2.1. Consumer Services
- 5.2.2. Enterprise Services
- 5.2.3. Industrial Services
- 5.3. Market Analysis, Insights and Forecast - by Region
- 5.3.1. North America
- 5.3.2. Europe
- 5.3.3. Asia Pacific
- 5.3.4. Rest of the World
- 5.1. Market Analysis, Insights and Forecast - by Connection Type
- 6. Global 5G Technology Industry Analysis, Insights and Forecast, 2021-2033
- 6.1. Market Analysis, Insights and Forecast - by Connection Type
- 6.1.1. Mobile Broadband
- 6.1.2. Fixed Wireless Access
- 6.1.3. M2M and IoT
- 6.1.4. Mission-critical
- 6.2. Market Analysis, Insights and Forecast - by Application
- 6.2.1. Consumer Services
- 6.2.2. Enterprise Services
- 6.2.3. Industrial Services
- 6.1. Market Analysis, Insights and Forecast - by Connection Type
- 7. North America 5G Technology Industry Analysis, Insights and Forecast, 2020-2032
- 7.1. Market Analysis, Insights and Forecast - by Connection Type
- 7.1.1. Mobile Broadband
- 7.1.2. Fixed Wireless Access
- 7.1.3. M2M and IoT
- 7.1.4. Mission-critical
- 7.2. Market Analysis, Insights and Forecast - by Application
- 7.2.1. Consumer Services
- 7.2.2. Enterprise Services
- 7.2.3. Industrial Services
- 7.1. Market Analysis, Insights and Forecast - by Connection Type
- 8. Europe 5G Technology Industry Analysis, Insights and Forecast, 2020-2032
- 8.1. Market Analysis, Insights and Forecast - by Connection Type
- 8.1.1. Mobile Broadband
- 8.1.2. Fixed Wireless Access
- 8.1.3. M2M and IoT
- 8.1.4. Mission-critical
- 8.2. Market Analysis, Insights and Forecast - by Application
- 8.2.1. Consumer Services
- 8.2.2. Enterprise Services
- 8.2.3. Industrial Services
- 8.1. Market Analysis, Insights and Forecast - by Connection Type
- 9. Asia Pacific 5G Technology Industry Analysis, Insights and Forecast, 2020-2032
- 9.1. Market Analysis, Insights and Forecast - by Connection Type
- 9.1.1. Mobile Broadband
- 9.1.2. Fixed Wireless Access
- 9.1.3. M2M and IoT
- 9.1.4. Mission-critical
- 9.2. Market Analysis, Insights and Forecast - by Application
- 9.2.1. Consumer Services
- 9.2.2. Enterprise Services
- 9.2.3. Industrial Services
- 9.1. Market Analysis, Insights and Forecast - by Connection Type
- 10. Rest of the World 5G Technology Industry Analysis, Insights and Forecast, 2020-2032
- 10.1. Market Analysis, Insights and Forecast - by Connection Type
- 10.1.1. Mobile Broadband
- 10.1.2. Fixed Wireless Access
- 10.1.3. M2M and IoT
- 10.1.4. Mission-critical
- 10.2. Market Analysis, Insights and Forecast - by Application
- 10.2.1. Consumer Services
- 10.2.2. Enterprise Services
- 10.2.3. Industrial Services
- 10.1. Market Analysis, Insights and Forecast - by Connection Type
- 11. Competitive Analysis
- 11.1. Company Profiles
- 11.1.1 China Telecommunications Corporation
- 11.1.1.1. Company Overview
- 11.1.1.2. Products
- 11.1.1.3. Company Financials
- 11.1.1.4. SWOT Analysis
- 11.1.2 Telstra Corporation Ltd
- 11.1.2.1. Company Overview
- 11.1.2.2. Products
- 11.1.2.3. Company Financials
- 11.1.2.4. SWOT Analysis
- 11.1.3 Verizon Communications Inc
- 11.1.3.1. Company Overview
- 11.1.3.2. Products
- 11.1.3.3. Company Financials
- 11.1.3.4. SWOT Analysis
- 11.1.4 Nippon Telegraph and Telephone
- 11.1.4.1. Company Overview
- 11.1.4.2. Products
- 11.1.4.3. Company Financials
- 11.1.4.4. SWOT Analysis
- 11.1.5 T-Mobile US Inc (Sprint Corporation)
- 11.1.5.1. Company Overview
- 11.1.5.2. Products
- 11.1.5.3. Company Financials
- 11.1.5.4. SWOT Analysis
- 11.1.6 Vodafone Group Plc
- 11.1.6.1. Company Overview
- 11.1.6.2. Products
- 11.1.6.3. Company Financials
- 11.1.6.4. SWOT Analysis
- 11.1.7 IDEMIA
- 11.1.7.1. Company Overview
- 11.1.7.2. Products
- 11.1.7.3. Company Financials
- 11.1.7.4. SWOT Analysis
- 11.1.8 AT&T Inc
- 11.1.8.1. Company Overview
- 11.1.8.2. Products
- 11.1.8.3. Company Financials
- 11.1.8.4. SWOT Analysis
- 11.1.9 Deutsche Telekom
- 11.1.9.1. Company Overview
- 11.1.9.2. Products
- 11.1.9.3. Company Financials
- 11.1.9.4. SWOT Analysis
- 11.1.10 Telefonica SA
- 11.1.10.1. Company Overview
- 11.1.10.2. Products
- 11.1.10.3. Company Financials
- 11.1.10.4. SWOT Analysis
- 11.1.1 China Telecommunications Corporation
- 11.2. Market Entropy
- 11.2.1 Company's Key Areas Served
- 11.2.2 Recent Developments
- 11.3. Company Market Share Analysis 2025
- 11.3.1 Top 5 Companies Market Share Analysis
- 11.3.2 Top 3 Companies Market Share Analysis
- 11.4. List of Potential Customers
- 12. Research Methodology
List of Figures
- Figure 1: Global 5G Technology Industry Revenue Breakdown (billion, %) by Region 2025 & 2033
- Figure 2: Global 5G Technology Industry Volume Breakdown (K Unit, %) by Region 2025 & 2033
- Figure 3: North America 5G Technology Industry Revenue (billion), by Connection Type 2025 & 2033
- Figure 4: North America 5G Technology Industry Volume (K Unit), by Connection Type 2025 & 2033
- Figure 5: North America 5G Technology Industry Revenue Share (%), by Connection Type 2025 & 2033
- Figure 6: North America 5G Technology Industry Volume Share (%), by Connection Type 2025 & 2033
- Figure 7: North America 5G Technology Industry Revenue (billion), by Application 2025 & 2033
- Figure 8: North America 5G Technology Industry Volume (K Unit), by Application 2025 & 2033
- Figure 9: North America 5G Technology Industry Revenue Share (%), by Application 2025 & 2033
- Figure 10: North America 5G Technology Industry Volume Share (%), by Application 2025 & 2033
- Figure 11: North America 5G Technology Industry Revenue (billion), by Country 2025 & 2033
- Figure 12: North America 5G Technology Industry Volume (K Unit), by Country 2025 & 2033
- Figure 13: North America 5G Technology Industry Revenue Share (%), by Country 2025 & 2033
- Figure 14: North America 5G Technology Industry Volume Share (%), by Country 2025 & 2033
- Figure 15: Europe 5G Technology Industry Revenue (billion), by Connection Type 2025 & 2033
- Figure 16: Europe 5G Technology Industry Volume (K Unit), by Connection Type 2025 & 2033
- Figure 17: Europe 5G Technology Industry Revenue Share (%), by Connection Type 2025 & 2033
- Figure 18: Europe 5G Technology Industry Volume Share (%), by Connection Type 2025 & 2033
- Figure 19: Europe 5G Technology Industry Revenue (billion), by Application 2025 & 2033
- Figure 20: Europe 5G Technology Industry Volume (K Unit), by Application 2025 & 2033
- Figure 21: Europe 5G Technology Industry Revenue Share (%), by Application 2025 & 2033
- Figure 22: Europe 5G Technology Industry Volume Share (%), by Application 2025 & 2033
- Figure 23: Europe 5G Technology Industry Revenue (billion), by Country 2025 & 2033
- Figure 24: Europe 5G Technology Industry Volume (K Unit), by Country 2025 & 2033
- Figure 25: Europe 5G Technology Industry Revenue Share (%), by Country 2025 & 2033
- Figure 26: Europe 5G Technology Industry Volume Share (%), by Country 2025 & 2033
- Figure 27: Asia Pacific 5G Technology Industry Revenue (billion), by Connection Type 2025 & 2033
- Figure 28: Asia Pacific 5G Technology Industry Volume (K Unit), by Connection Type 2025 & 2033
- Figure 29: Asia Pacific 5G Technology Industry Revenue Share (%), by Connection Type 2025 & 2033
- Figure 30: Asia Pacific 5G Technology Industry Volume Share (%), by Connection Type 2025 & 2033
- Figure 31: Asia Pacific 5G Technology Industry Revenue (billion), by Application 2025 & 2033
- Figure 32: Asia Pacific 5G Technology Industry Volume (K Unit), by Application 2025 & 2033
- Figure 33: Asia Pacific 5G Technology Industry Revenue Share (%), by Application 2025 & 2033
- Figure 34: Asia Pacific 5G Technology Industry Volume Share (%), by Application 2025 & 2033
- Figure 35: Asia Pacific 5G Technology Industry Revenue (billion), by Country 2025 & 2033
- Figure 36: Asia Pacific 5G Technology Industry Volume (K Unit), by Country 2025 & 2033
- Figure 37: Asia Pacific 5G Technology Industry Revenue Share (%), by Country 2025 & 2033
- Figure 38: Asia Pacific 5G Technology Industry Volume Share (%), by Country 2025 & 2033
- Figure 39: Rest of the World 5G Technology Industry Revenue (billion), by Connection Type 2025 & 2033
- Figure 40: Rest of the World 5G Technology Industry Volume (K Unit), by Connection Type 2025 & 2033
- Figure 41: Rest of the World 5G Technology Industry Revenue Share (%), by Connection Type 2025 & 2033
- Figure 42: Rest of the World 5G Technology Industry Volume Share (%), by Connection Type 2025 & 2033
- Figure 43: Rest of the World 5G Technology Industry Revenue (billion), by Application 2025 & 2033
- Figure 44: Rest of the World 5G Technology Industry Volume (K Unit), by Application 2025 & 2033
- Figure 45: Rest of the World 5G Technology Industry Revenue Share (%), by Application 2025 & 2033
- Figure 46: Rest of the World 5G Technology Industry Volume Share (%), by Application 2025 & 2033
- Figure 47: Rest of the World 5G Technology Industry Revenue (billion), by Country 2025 & 2033
- Figure 48: Rest of the World 5G Technology Industry Volume (K Unit), by Country 2025 & 2033
- Figure 49: Rest of the World 5G Technology Industry Revenue Share (%), by Country 2025 & 2033
- Figure 50: Rest of the World 5G Technology Industry Volume Share (%), by Country 2025 & 2033
List of Tables
- Table 1: Global 5G Technology Industry Revenue billion Forecast, by Connection Type 2020 & 2033
- Table 2: Global 5G Technology Industry Volume K Unit Forecast, by Connection Type 2020 & 2033
- Table 3: Global 5G Technology Industry Revenue billion Forecast, by Application 2020 & 2033
- Table 4: Global 5G Technology Industry Volume K Unit Forecast, by Application 2020 & 2033
- Table 5: Global 5G Technology Industry Revenue billion Forecast, by Region 2020 & 2033
- Table 6: Global 5G Technology Industry Volume K Unit Forecast, by Region 2020 & 2033
- Table 7: Global 5G Technology Industry Revenue billion Forecast, by Connection Type 2020 & 2033
- Table 8: Global 5G Technology Industry Volume K Unit Forecast, by Connection Type 2020 & 2033
- Table 9: Global 5G Technology Industry Revenue billion Forecast, by Application 2020 & 2033
- Table 10: Global 5G Technology Industry Volume K Unit Forecast, by Application 2020 & 2033
- Table 11: Global 5G Technology Industry Revenue billion Forecast, by Country 2020 & 2033
- Table 12: Global 5G Technology Industry Volume K Unit Forecast, by Country 2020 & 2033
- Table 13: United States 5G Technology Industry Revenue (billion) Forecast, by Application 2020 & 2033
- Table 14: United States 5G Technology Industry Volume (K Unit) Forecast, by Application 2020 & 2033
- Table 15: Canada 5G Technology Industry Revenue (billion) Forecast, by Application 2020 & 2033
- Table 16: Canada 5G Technology Industry Volume (K Unit) Forecast, by Application 2020 & 2033
- Table 17: Global 5G Technology Industry Revenue billion Forecast, by Connection Type 2020 & 2033
- Table 18: Global 5G Technology Industry Volume K Unit Forecast, by Connection Type 2020 & 2033
- Table 19: Global 5G Technology Industry Revenue billion Forecast, by Application 2020 & 2033
- Table 20: Global 5G Technology Industry Volume K Unit Forecast, by Application 2020 & 2033
- Table 21: Global 5G Technology Industry Revenue billion Forecast, by Country 2020 & 2033
- Table 22: Global 5G Technology Industry Volume K Unit Forecast, by Country 2020 & 2033
- Table 23: Germany 5G Technology Industry Revenue (billion) Forecast, by Application 2020 & 2033
- Table 24: Germany 5G Technology Industry Volume (K Unit) Forecast, by Application 2020 & 2033
- Table 25: France 5G Technology Industry Revenue (billion) Forecast, by Application 2020 & 2033
- Table 26: France 5G Technology Industry Volume (K Unit) Forecast, by Application 2020 & 2033
- Table 27: United Kingdom 5G Technology Industry Revenue (billion) Forecast, by Application 2020 & 2033
- Table 28: United Kingdom 5G Technology Industry Volume (K Unit) Forecast, by Application 2020 & 2033
- Table 29: Rest of Europe 5G Technology Industry Revenue (billion) Forecast, by Application 2020 & 2033
- Table 30: Rest of Europe 5G Technology Industry Volume (K Unit) Forecast, by Application 2020 & 2033
- Table 31: Global 5G Technology Industry Revenue billion Forecast, by Connection Type 2020 & 2033
- Table 32: Global 5G Technology Industry Volume K Unit Forecast, by Connection Type 2020 & 2033
- Table 33: Global 5G Technology Industry Revenue billion Forecast, by Application 2020 & 2033
- Table 34: Global 5G Technology Industry Volume K Unit Forecast, by Application 2020 & 2033
- Table 35: Global 5G Technology Industry Revenue billion Forecast, by Country 2020 & 2033
- Table 36: Global 5G Technology Industry Volume K Unit Forecast, by Country 2020 & 2033
- Table 37: India 5G Technology Industry Revenue (billion) Forecast, by Application 2020 & 2033
- Table 38: India 5G Technology Industry Volume (K Unit) Forecast, by Application 2020 & 2033
- Table 39: China 5G Technology Industry Revenue (billion) Forecast, by Application 2020 & 2033
- Table 40: China 5G Technology Industry Volume (K Unit) Forecast, by Application 2020 & 2033
- Table 41: Japan 5G Technology Industry Revenue (billion) Forecast, by Application 2020 & 2033
- Table 42: Japan 5G Technology Industry Volume (K Unit) Forecast, by Application 2020 & 2033
- Table 43: Rest of Asia Pacific 5G Technology Industry Revenue (billion) Forecast, by Application 2020 & 2033
- Table 44: Rest of Asia Pacific 5G Technology Industry Volume (K Unit) Forecast, by Application 2020 & 2033
- Table 45: Global 5G Technology Industry Revenue billion Forecast, by Connection Type 2020 & 2033
- Table 46: Global 5G Technology Industry Volume K Unit Forecast, by Connection Type 2020 & 2033
- Table 47: Global 5G Technology Industry Revenue billion Forecast, by Application 2020 & 2033
- Table 48: Global 5G Technology Industry Volume K Unit Forecast, by Application 2020 & 2033
- Table 49: Global 5G Technology Industry Revenue billion Forecast, by Country 2020 & 2033
- Table 50: Global 5G Technology Industry Volume K Unit Forecast, by Country 2020 & 2033
Frequently Asked Questions
1. What is the projected Compound Annual Growth Rate (CAGR) of the 5G Technology Industry?
The projected CAGR is approximately 13.1%.
2. Which companies are prominent players in the 5G Technology Industry?
Key companies in the market include China Telecommunications Corporation, Telstra Corporation Ltd, Verizon Communications Inc, Nippon Telegraph and Telephone, T-Mobile US Inc (Sprint Corporation), Vodafone Group Plc, IDEMIA, AT&T Inc, Deutsche Telekom, Telefonica SA.
3. What are the main segments of the 5G Technology Industry?
The market segments include Connection Type, Application .
4. Can you provide details about the market size?
The market size is estimated to be USD 41.39 billion as of 2022.
5. What are some drivers contributing to market growth?
Increase in Demand for Wireless Broadband Services Needing Faster. Higher-Capacity Networks.
6. What are the notable trends driving market growth?
M2M Connectivity Expected to Witness Significant Growth.
7. Are there any restraints impacting market growth?
Availability of Limited Spectrum.
8. Can you provide examples of recent developments in the market?
Jan 2023: 5G connected ambulances were developed and tested by Bharti Airtel in partnership with Apollo Hospitals. Under this partnership, a 5 G-driven Artificial Intelligence (AI) guided Colonoscopy trial was carried out. HealthNet Global, AWS, and Avesha provided their technical expertise and resources to Airtel's ultra-low latency 5G technology to detect colon cancer at a faster rate and with greater accuracy.
9. What pricing options are available for accessing the report?
Pricing options include single-user, multi-user, and enterprise licenses priced at USD 4750, USD 5250, and USD 8750 respectively.
10. Is the market size provided in terms of value or volume?
The market size is provided in terms of value, measured in billion and volume, measured in K Unit.
11. Are there any specific market keywords associated with the report?
Yes, the market keyword associated with the report is "5G Technology Industry," which aids in identifying and referencing the specific market segment covered.
12. How do I determine which pricing option suits my needs best?
The pricing options vary based on user requirements and access needs. Individual users may opt for single-user licenses, while businesses requiring broader access may choose multi-user or enterprise licenses for cost-effective access to the report.
13. Are there any additional resources or data provided in the 5G Technology Industry report?
While the report offers comprehensive insights, it's advisable to review the specific contents or supplementary materials provided to ascertain if additional resources or data are available.
14. How can I stay updated on further developments or reports in the 5G Technology Industry?
To stay informed about further developments, trends, and reports in the 5G Technology Industry, consider subscribing to industry newsletters, following relevant companies and organizations, or regularly checking reputable industry news sources and publications.
Methodology
Step 1 - Identification of Relevant Samples Size from Population Database


Step 2 - Approaches for Defining Global Market Size (Value, Volume* & Price*)

Note*: In applicable scenarios
Step 3 - Data Sources
Primary Research
- Web Analytics
- Survey Reports
- Research Institute
- Latest Research Reports
- Opinion Leaders
Secondary Research
- Annual Reports
- White Paper
- Latest Press Release
- Industry Association
- Paid Database
- Investor Presentations

Step 4 - Data Triangulation
Involves using different sources of information in order to increase the validity of a study
These sources are likely to be stakeholders in a program - participants, other researchers, program staff, other community members, and so on.
Then we put all data in single framework & apply various statistical tools to find out the dynamic on the market.
During the analysis stage, feedback from the stakeholder groups would be compared to determine areas of agreement as well as areas of divergence