

Key Insights
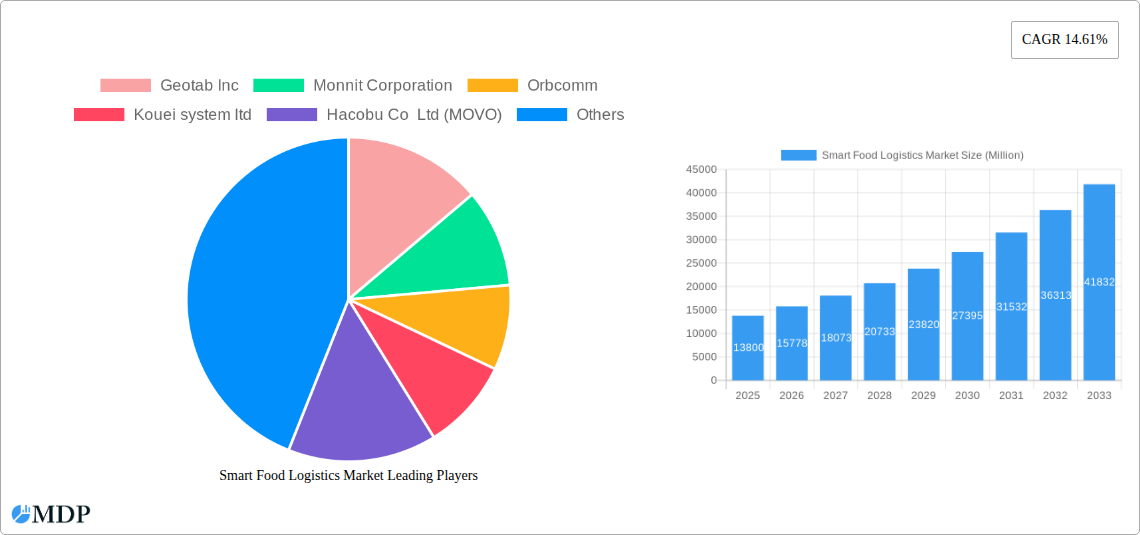
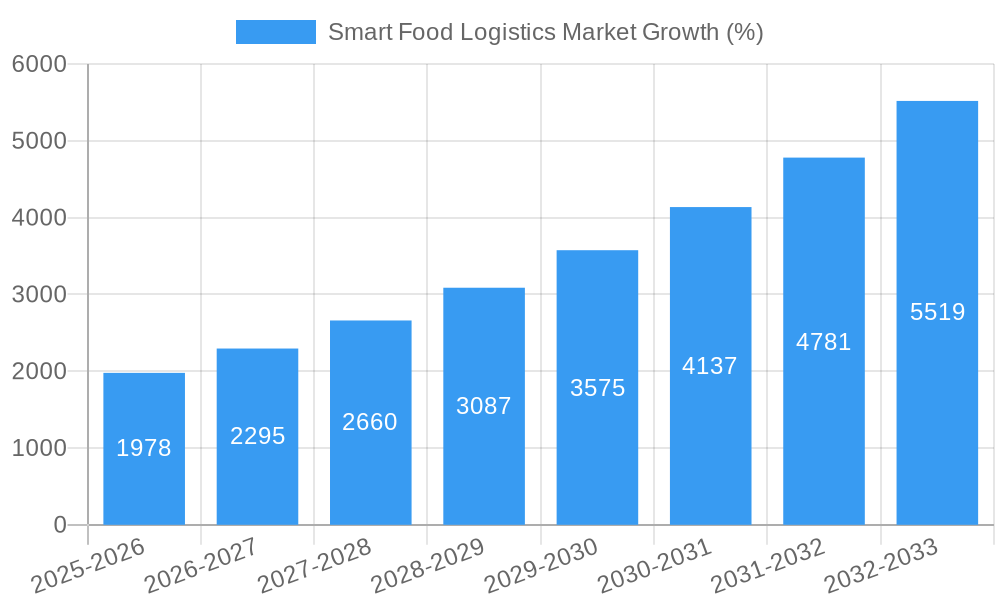
The global smart food logistics market is experiencing robust growth, projected to reach \$13.80 billion in 2025 and exhibiting a Compound Annual Growth Rate (CAGR) of 14.61% from 2025 to 2033. This expansion is driven by several key factors. The increasing demand for food safety and quality assurance, particularly within stringent regulatory environments, is a primary driver. Consumers are increasingly conscious of food provenance and traceability, fueling the adoption of technologies that provide real-time visibility into the supply chain. Furthermore, the need to minimize food waste and spoilage, a significant economic and environmental concern, is pushing the adoption of smart solutions like cold chain monitoring and asset tracking. Technological advancements, including the miniaturization and cost reduction of sensors, the rise of IoT connectivity, and sophisticated data analytics platforms, are making smart food logistics solutions more accessible and affordable for businesses of all sizes. The market segmentation reveals strong growth across all components (hardware such as sensors and telematics, software and services) and technologies (fleet management, asset tracking, and cold chain monitoring), indicating a holistic market expansion.
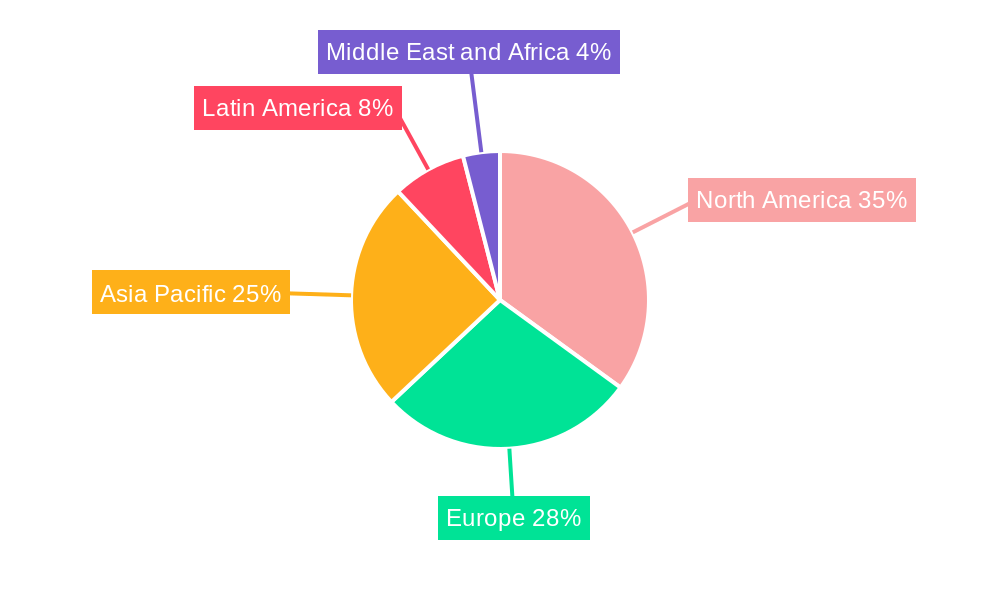
The geographical distribution of market share is likely to reflect existing economic strengths and infrastructure development in various regions. North America and Europe are expected to maintain significant market shares due to early adoption and robust regulatory frameworks. However, rapid growth is anticipated in the Asia-Pacific region, driven by burgeoning economies, increasing urbanization, and rising consumer demands for higher-quality and safer food products. Latin America and the Middle East and Africa are also poised for considerable growth, though perhaps at a slower pace initially, due to varying levels of infrastructure development and regulatory adoption. Competition in the market is intensifying, with established players alongside innovative startups vying for market share. This competitive landscape fosters innovation and drives prices down, making smart food logistics solutions progressively more accessible across the food industry. The market's future trajectory hinges on continued technological innovation, regulatory support promoting food safety, and the evolving consumer demand for sustainable and transparent food supply chains.
Smart Food Logistics Market: A Comprehensive Report (2019-2033)
This in-depth report provides a comprehensive analysis of the Smart Food Logistics Market, offering invaluable insights for industry stakeholders, investors, and strategic decision-makers. With a study period spanning 2019-2033, a base year of 2025, and a forecast period of 2025-2033, this report unveils the market's dynamics, trends, and future potential. The market is projected to reach xx Million by 2033, exhibiting a robust CAGR of xx%.
Smart Food Logistics Market Market Dynamics & Concentration
The Smart Food Logistics Market is experiencing significant growth driven by increasing demand for efficient and transparent supply chains, stringent food safety regulations, and the rising adoption of advanced technologies. Market concentration is relatively moderate, with several key players vying for market share. However, consolidation through mergers and acquisitions (M&A) is expected to increase concentration in the coming years.
- Market Concentration: The Herfindahl-Hirschman Index (HHI) for the market is estimated at xx, indicating a moderately concentrated market.
- Innovation Drivers: Technological advancements such as IoT, AI, and blockchain are driving innovation, leading to the development of sophisticated tracking and monitoring systems.
- Regulatory Frameworks: Stringent food safety regulations and traceability requirements are compelling businesses to adopt smart logistics solutions.
- Product Substitutes: While traditional logistics methods remain present, they are increasingly being challenged by the superior efficiency and data-driven capabilities of smart solutions.
- End-User Trends: The growing preference for fresh and high-quality food products, coupled with rising consumer awareness about food safety, is driving adoption among food retailers and distributors.
- M&A Activities: The number of M&A deals in the market has increased significantly in recent years, with approximately xx deals recorded between 2019 and 2024. Key players are actively consolidating to expand their market reach and technological capabilities. This activity is expected to continue at a pace of xx deals annually over the next decade.
Smart Food Logistics Market Industry Trends & Analysis
The Smart Food Logistics Market is characterized by rapid growth, driven by several key factors. The increasing adoption of IoT devices, such as sensors and trackers, allows for real-time monitoring of temperature, humidity, and location, ensuring food safety and reducing spoilage. Furthermore, advancements in software and analytics provide enhanced visibility across the supply chain, enabling better inventory management and efficient route optimization. The market is witnessing a shift towards cloud-based solutions, offering greater scalability and accessibility. Consumer preferences for transparency and traceability are also impacting market growth, as consumers demand more information about the origin and journey of their food. The competitive landscape is dynamic, with both established players and new entrants vying for market share through innovation and strategic partnerships. The market penetration rate for smart food logistics solutions is currently estimated at xx%, with significant room for growth in emerging markets. The market is expected to maintain a healthy CAGR of xx% throughout the forecast period.
Leading Markets & Segments in Smart Food Logistics Market
The North American region currently holds the largest market share, driven by high technological adoption and stringent food safety regulations. However, Asia-Pacific is projected to experience significant growth in the coming years, fueled by rapid economic development and rising consumer demand for high-quality food products. Within market segments, the hardware component (sensors, telematics, networking devices) currently dominates, although the software and services segment is rapidly gaining traction due to the rising demand for advanced analytics and data-driven insights. Cold chain monitoring technology also accounts for a significant segment and exhibits the highest growth potential due to the perishability of many food products.
- Key Drivers for North America:
- Strong regulatory framework.
- High technological adoption rate.
- Well-established cold chain infrastructure.
- Key Drivers for Asia-Pacific:
- Rapid economic growth.
- Increasing consumer demand for fresh food.
- Growing investment in cold chain infrastructure.
- Segment Dominance: The Hardware segment currently holds the largest market share (xx%), followed by Software and Services (xx%). Cold Chain Monitoring dominates within technology segments.
Smart Food Logistics Market Product Developments
Recent product developments focus on integrating advanced technologies like AI and machine learning for predictive maintenance, route optimization, and anomaly detection. Miniaturization and improved battery life of sensors are enhancing their usability and cost-effectiveness. Cloud-based platforms are enabling real-time data visualization and collaborative supply chain management. These developments are improving supply chain efficiency, reducing food waste, and enhancing traceability.
Key Drivers of Smart Food Logistics Market Growth
Several factors fuel the growth of the smart food logistics market. Technological advancements in IoT, AI, and cloud computing provide solutions for real-time monitoring and data analytics, improving supply chain visibility and efficiency. Stringent food safety regulations and increasing consumer demand for transparency and traceability further drive market growth. Economic factors such as rising disposable incomes and the growth of e-commerce also contribute to the market's expansion. Government initiatives promoting technological adoption in the food and agriculture sectors are also significant drivers.
Challenges in the Smart Food Logistics Market Market
The Smart Food Logistics Market faces challenges, including high initial investment costs for technology adoption, especially for smaller businesses. Interoperability issues between different systems can hinder seamless data exchange. Data security concerns related to the transmission and storage of sensitive information pose a risk. Furthermore, the lack of skilled workforce to implement and manage these sophisticated systems can be a bottleneck. These factors could potentially hinder market growth, though innovation and consolidation efforts are tackling these limitations.
Emerging Opportunities in Smart Food Logistics Market
The market presents several significant opportunities. The integration of blockchain technology for enhanced traceability and transparency is gaining momentum. Strategic partnerships between technology providers and logistics companies can facilitate wider adoption of smart solutions. Market expansion into emerging economies with burgeoning food and beverage sectors offers vast potential. Advancements in sensor technology, offering improved accuracy and reliability at lower costs, will further stimulate growth.
Leading Players in the Smart Food Logistics Market Sector
- Geotab Inc
- Monnit Corporation
- Orbcomm
- Kouei system ltd
- Hacobu Co Ltd (MOVO)
- Seaos
- Berlinger & Co AG
- Samsara Inc
- Kii Corporation
- Teletrac Navman
- Nippon Express co Ltd
- Controlant
- LYNA LOGICS Inc
- Sensitech (Carrier Global Corporation)
- YUSEN LOGISTICS CO LTD (Nippon Yusen Kabushiki Kaisha(NYK)
- Verizon Connect
Key Milestones in Smart Food Logistics Market Industry
- March 2022: ORBCOMM Inc. launched the CT 3500 IoT telematics device, enhancing refrigerated container logistics. This improved functionality, analytics, connectivity, and interoperability.
- April 2022: CoolKit partnered with ORBCOMM Inc. for temperature monitoring in refrigerated vehicles, improving cold chain management and compliance across various industries.
Strategic Outlook for Smart Food Logistics Market Market
The Smart Food Logistics Market is poised for continued expansion, driven by technological innovation, increasing regulatory pressure, and growing consumer demand. Strategic partnerships, focused investments in research and development, and the expansion into new geographic markets will be key to capturing the significant growth opportunities within this sector. The focus on data-driven insights and sustainable practices will further shape the future of this dynamic market.
Smart Food Logistics Market Segmentation
-
1. Component
- 1.1. Hardware
- 1.2. Software and Services
-
2. Technology
- 2.1. Fleet Management
- 2.2. Asset Tracking
- 2.3. Cold Chain Monitoring
Smart Food Logistics Market Segmentation By Geography
- 1. North America
- 2. Europe
- 3. Asia Pacific
- 4. Latin America
- 5. Middle East and Africa
Smart Food Logistics Market REPORT HIGHLIGHTS
| Aspects | Details |
|---|---|
| Study Period | 2019-2033 |
| Base Year | 2024 |
| Estimated Year | 2025 |
| Forecast Period | 2025-2033 |
| Historical Period | 2019-2024 |
| Growth Rate | CAGR of 14.61% from 2019-2033 |
| Segmentation |
|
Table of Contents
- 1. Introduction
- 1.1. Research Scope
- 1.2. Market Segmentation
- 1.3. Research Methodology
- 1.4. Definitions and Assumptions
- 2. Executive Summary
- 2.1. Introduction
- 3. Market Dynamics
- 3.1. Introduction
- 3.2. Market Drivers
- 3.2.1. Increasing Need for Efficient Monitoring and Tracking for Better Control of Assets
- 3.3. Market Restrains
- 3.3.1. Installation Complexities
- 3.4. Market Trends
- 3.4.1. Cold Chain Monitoring to Hold a Significant Share
- 4. Market Factor Analysis
- 4.1. Porters Five Forces
- 4.2. Supply/Value Chain
- 4.3. PESTEL analysis
- 4.4. Market Entropy
- 4.5. Patent/Trademark Analysis
- 5. Global Smart Food Logistics Market Analysis, Insights and Forecast, 2019-2031
- 5.1. Market Analysis, Insights and Forecast - by Component
- 5.1.1. Hardware
- 5.1.2. Software and Services
- 5.2. Market Analysis, Insights and Forecast - by Technology
- 5.2.1. Fleet Management
- 5.2.2. Asset Tracking
- 5.2.3. Cold Chain Monitoring
- 5.3. Market Analysis, Insights and Forecast - by Region
- 5.3.1. North America
- 5.3.2. Europe
- 5.3.3. Asia Pacific
- 5.3.4. Latin America
- 5.3.5. Middle East and Africa
- 5.1. Market Analysis, Insights and Forecast - by Component
- 6. North America Smart Food Logistics Market Analysis, Insights and Forecast, 2019-2031
- 6.1. Market Analysis, Insights and Forecast - by Component
- 6.1.1. Hardware
- 6.1.2. Software and Services
- 6.2. Market Analysis, Insights and Forecast - by Technology
- 6.2.1. Fleet Management
- 6.2.2. Asset Tracking
- 6.2.3. Cold Chain Monitoring
- 6.1. Market Analysis, Insights and Forecast - by Component
- 7. Europe Smart Food Logistics Market Analysis, Insights and Forecast, 2019-2031
- 7.1. Market Analysis, Insights and Forecast - by Component
- 7.1.1. Hardware
- 7.1.2. Software and Services
- 7.2. Market Analysis, Insights and Forecast - by Technology
- 7.2.1. Fleet Management
- 7.2.2. Asset Tracking
- 7.2.3. Cold Chain Monitoring
- 7.1. Market Analysis, Insights and Forecast - by Component
- 8. Asia Pacific Smart Food Logistics Market Analysis, Insights and Forecast, 2019-2031
- 8.1. Market Analysis, Insights and Forecast - by Component
- 8.1.1. Hardware
- 8.1.2. Software and Services
- 8.2. Market Analysis, Insights and Forecast - by Technology
- 8.2.1. Fleet Management
- 8.2.2. Asset Tracking
- 8.2.3. Cold Chain Monitoring
- 8.1. Market Analysis, Insights and Forecast - by Component
- 9. Latin America Smart Food Logistics Market Analysis, Insights and Forecast, 2019-2031
- 9.1. Market Analysis, Insights and Forecast - by Component
- 9.1.1. Hardware
- 9.1.2. Software and Services
- 9.2. Market Analysis, Insights and Forecast - by Technology
- 9.2.1. Fleet Management
- 9.2.2. Asset Tracking
- 9.2.3. Cold Chain Monitoring
- 9.1. Market Analysis, Insights and Forecast - by Component
- 10. Middle East and Africa Smart Food Logistics Market Analysis, Insights and Forecast, 2019-2031
- 10.1. Market Analysis, Insights and Forecast - by Component
- 10.1.1. Hardware
- 10.1.2. Software and Services
- 10.2. Market Analysis, Insights and Forecast - by Technology
- 10.2.1. Fleet Management
- 10.2.2. Asset Tracking
- 10.2.3. Cold Chain Monitoring
- 10.1. Market Analysis, Insights and Forecast - by Component
- 11. North America Smart Food Logistics Market Analysis, Insights and Forecast, 2019-2031
- 11.1. Market Analysis, Insights and Forecast - By Country/Sub-region
- 11.1.1.
- 12. Europe Smart Food Logistics Market Analysis, Insights and Forecast, 2019-2031
- 12.1. Market Analysis, Insights and Forecast - By Country/Sub-region
- 12.1.1.
- 13. Asia Pacific Smart Food Logistics Market Analysis, Insights and Forecast, 2019-2031
- 13.1. Market Analysis, Insights and Forecast - By Country/Sub-region
- 13.1.1.
- 14. Latin America Smart Food Logistics Market Analysis, Insights and Forecast, 2019-2031
- 14.1. Market Analysis, Insights and Forecast - By Country/Sub-region
- 14.1.1.
- 15. Middle East and Africa Smart Food Logistics Market Analysis, Insights and Forecast, 2019-2031
- 15.1. Market Analysis, Insights and Forecast - By Country/Sub-region
- 15.1.1.
- 16. Competitive Analysis
- 16.1. Global Market Share Analysis 2024
- 16.2. Company Profiles
- 16.2.1 Geotab Inc
- 16.2.1.1. Overview
- 16.2.1.2. Products
- 16.2.1.3. SWOT Analysis
- 16.2.1.4. Recent Developments
- 16.2.1.5. Financials (Based on Availability)
- 16.2.2 Monnit Corporation
- 16.2.2.1. Overview
- 16.2.2.2. Products
- 16.2.2.3. SWOT Analysis
- 16.2.2.4. Recent Developments
- 16.2.2.5. Financials (Based on Availability)
- 16.2.3 Orbcomm
- 16.2.3.1. Overview
- 16.2.3.2. Products
- 16.2.3.3. SWOT Analysis
- 16.2.3.4. Recent Developments
- 16.2.3.5. Financials (Based on Availability)
- 16.2.4 Kouei system ltd
- 16.2.4.1. Overview
- 16.2.4.2. Products
- 16.2.4.3. SWOT Analysis
- 16.2.4.4. Recent Developments
- 16.2.4.5. Financials (Based on Availability)
- 16.2.5 Hacobu Co Ltd (MOVO)
- 16.2.5.1. Overview
- 16.2.5.2. Products
- 16.2.5.3. SWOT Analysis
- 16.2.5.4. Recent Developments
- 16.2.5.5. Financials (Based on Availability)
- 16.2.6 Seaos
- 16.2.6.1. Overview
- 16.2.6.2. Products
- 16.2.6.3. SWOT Analysis
- 16.2.6.4. Recent Developments
- 16.2.6.5. Financials (Based on Availability)
- 16.2.7 Berlinger & Co AG
- 16.2.7.1. Overview
- 16.2.7.2. Products
- 16.2.7.3. SWOT Analysis
- 16.2.7.4. Recent Developments
- 16.2.7.5. Financials (Based on Availability)
- 16.2.8 Samsara Inc
- 16.2.8.1. Overview
- 16.2.8.2. Products
- 16.2.8.3. SWOT Analysis
- 16.2.8.4. Recent Developments
- 16.2.8.5. Financials (Based on Availability)
- 16.2.9 Kii Corporation
- 16.2.9.1. Overview
- 16.2.9.2. Products
- 16.2.9.3. SWOT Analysis
- 16.2.9.4. Recent Developments
- 16.2.9.5. Financials (Based on Availability)
- 16.2.10 Teletrac Navman
- 16.2.10.1. Overview
- 16.2.10.2. Products
- 16.2.10.3. SWOT Analysis
- 16.2.10.4. Recent Developments
- 16.2.10.5. Financials (Based on Availability)
- 16.2.11 Nippon Express co Ltd
- 16.2.11.1. Overview
- 16.2.11.2. Products
- 16.2.11.3. SWOT Analysis
- 16.2.11.4. Recent Developments
- 16.2.11.5. Financials (Based on Availability)
- 16.2.12 Controlant
- 16.2.12.1. Overview
- 16.2.12.2. Products
- 16.2.12.3. SWOT Analysis
- 16.2.12.4. Recent Developments
- 16.2.12.5. Financials (Based on Availability)
- 16.2.13 LYNA LOGICS Inc *List Not Exhaustive
- 16.2.13.1. Overview
- 16.2.13.2. Products
- 16.2.13.3. SWOT Analysis
- 16.2.13.4. Recent Developments
- 16.2.13.5. Financials (Based on Availability)
- 16.2.14 Sensitech (Carrier Global Corporation)
- 16.2.14.1. Overview
- 16.2.14.2. Products
- 16.2.14.3. SWOT Analysis
- 16.2.14.4. Recent Developments
- 16.2.14.5. Financials (Based on Availability)
- 16.2.15 YUSEN LOGISTICS CO LTD (Nippon Yusen Kabushiki Kaisha(NYK)
- 16.2.15.1. Overview
- 16.2.15.2. Products
- 16.2.15.3. SWOT Analysis
- 16.2.15.4. Recent Developments
- 16.2.15.5. Financials (Based on Availability)
- 16.2.16 Verizon Connect
- 16.2.16.1. Overview
- 16.2.16.2. Products
- 16.2.16.3. SWOT Analysis
- 16.2.16.4. Recent Developments
- 16.2.16.5. Financials (Based on Availability)
- 16.2.1 Geotab Inc
List of Figures
- Figure 1: Global Smart Food Logistics Market Revenue Breakdown (Million, %) by Region 2024 & 2032
- Figure 2: North America Smart Food Logistics Market Revenue (Million), by Country 2024 & 2032
- Figure 3: North America Smart Food Logistics Market Revenue Share (%), by Country 2024 & 2032
- Figure 4: Europe Smart Food Logistics Market Revenue (Million), by Country 2024 & 2032
- Figure 5: Europe Smart Food Logistics Market Revenue Share (%), by Country 2024 & 2032
- Figure 6: Asia Pacific Smart Food Logistics Market Revenue (Million), by Country 2024 & 2032
- Figure 7: Asia Pacific Smart Food Logistics Market Revenue Share (%), by Country 2024 & 2032
- Figure 8: Latin America Smart Food Logistics Market Revenue (Million), by Country 2024 & 2032
- Figure 9: Latin America Smart Food Logistics Market Revenue Share (%), by Country 2024 & 2032
- Figure 10: Middle East and Africa Smart Food Logistics Market Revenue (Million), by Country 2024 & 2032
- Figure 11: Middle East and Africa Smart Food Logistics Market Revenue Share (%), by Country 2024 & 2032
- Figure 12: North America Smart Food Logistics Market Revenue (Million), by Component 2024 & 2032
- Figure 13: North America Smart Food Logistics Market Revenue Share (%), by Component 2024 & 2032
- Figure 14: North America Smart Food Logistics Market Revenue (Million), by Technology 2024 & 2032
- Figure 15: North America Smart Food Logistics Market Revenue Share (%), by Technology 2024 & 2032
- Figure 16: North America Smart Food Logistics Market Revenue (Million), by Country 2024 & 2032
- Figure 17: North America Smart Food Logistics Market Revenue Share (%), by Country 2024 & 2032
- Figure 18: Europe Smart Food Logistics Market Revenue (Million), by Component 2024 & 2032
- Figure 19: Europe Smart Food Logistics Market Revenue Share (%), by Component 2024 & 2032
- Figure 20: Europe Smart Food Logistics Market Revenue (Million), by Technology 2024 & 2032
- Figure 21: Europe Smart Food Logistics Market Revenue Share (%), by Technology 2024 & 2032
- Figure 22: Europe Smart Food Logistics Market Revenue (Million), by Country 2024 & 2032
- Figure 23: Europe Smart Food Logistics Market Revenue Share (%), by Country 2024 & 2032
- Figure 24: Asia Pacific Smart Food Logistics Market Revenue (Million), by Component 2024 & 2032
- Figure 25: Asia Pacific Smart Food Logistics Market Revenue Share (%), by Component 2024 & 2032
- Figure 26: Asia Pacific Smart Food Logistics Market Revenue (Million), by Technology 2024 & 2032
- Figure 27: Asia Pacific Smart Food Logistics Market Revenue Share (%), by Technology 2024 & 2032
- Figure 28: Asia Pacific Smart Food Logistics Market Revenue (Million), by Country 2024 & 2032
- Figure 29: Asia Pacific Smart Food Logistics Market Revenue Share (%), by Country 2024 & 2032
- Figure 30: Latin America Smart Food Logistics Market Revenue (Million), by Component 2024 & 2032
- Figure 31: Latin America Smart Food Logistics Market Revenue Share (%), by Component 2024 & 2032
- Figure 32: Latin America Smart Food Logistics Market Revenue (Million), by Technology 2024 & 2032
- Figure 33: Latin America Smart Food Logistics Market Revenue Share (%), by Technology 2024 & 2032
- Figure 34: Latin America Smart Food Logistics Market Revenue (Million), by Country 2024 & 2032
- Figure 35: Latin America Smart Food Logistics Market Revenue Share (%), by Country 2024 & 2032
- Figure 36: Middle East and Africa Smart Food Logistics Market Revenue (Million), by Component 2024 & 2032
- Figure 37: Middle East and Africa Smart Food Logistics Market Revenue Share (%), by Component 2024 & 2032
- Figure 38: Middle East and Africa Smart Food Logistics Market Revenue (Million), by Technology 2024 & 2032
- Figure 39: Middle East and Africa Smart Food Logistics Market Revenue Share (%), by Technology 2024 & 2032
- Figure 40: Middle East and Africa Smart Food Logistics Market Revenue (Million), by Country 2024 & 2032
- Figure 41: Middle East and Africa Smart Food Logistics Market Revenue Share (%), by Country 2024 & 2032
List of Tables
- Table 1: Global Smart Food Logistics Market Revenue Million Forecast, by Region 2019 & 2032
- Table 2: Global Smart Food Logistics Market Revenue Million Forecast, by Component 2019 & 2032
- Table 3: Global Smart Food Logistics Market Revenue Million Forecast, by Technology 2019 & 2032
- Table 4: Global Smart Food Logistics Market Revenue Million Forecast, by Region 2019 & 2032
- Table 5: Global Smart Food Logistics Market Revenue Million Forecast, by Country 2019 & 2032
- Table 6: Smart Food Logistics Market Revenue (Million) Forecast, by Application 2019 & 2032
- Table 7: Global Smart Food Logistics Market Revenue Million Forecast, by Country 2019 & 2032
- Table 8: Smart Food Logistics Market Revenue (Million) Forecast, by Application 2019 & 2032
- Table 9: Global Smart Food Logistics Market Revenue Million Forecast, by Country 2019 & 2032
- Table 10: Smart Food Logistics Market Revenue (Million) Forecast, by Application 2019 & 2032
- Table 11: Global Smart Food Logistics Market Revenue Million Forecast, by Country 2019 & 2032
- Table 12: Smart Food Logistics Market Revenue (Million) Forecast, by Application 2019 & 2032
- Table 13: Global Smart Food Logistics Market Revenue Million Forecast, by Country 2019 & 2032
- Table 14: Smart Food Logistics Market Revenue (Million) Forecast, by Application 2019 & 2032
- Table 15: Global Smart Food Logistics Market Revenue Million Forecast, by Component 2019 & 2032
- Table 16: Global Smart Food Logistics Market Revenue Million Forecast, by Technology 2019 & 2032
- Table 17: Global Smart Food Logistics Market Revenue Million Forecast, by Country 2019 & 2032
- Table 18: Global Smart Food Logistics Market Revenue Million Forecast, by Component 2019 & 2032
- Table 19: Global Smart Food Logistics Market Revenue Million Forecast, by Technology 2019 & 2032
- Table 20: Global Smart Food Logistics Market Revenue Million Forecast, by Country 2019 & 2032
- Table 21: Global Smart Food Logistics Market Revenue Million Forecast, by Component 2019 & 2032
- Table 22: Global Smart Food Logistics Market Revenue Million Forecast, by Technology 2019 & 2032
- Table 23: Global Smart Food Logistics Market Revenue Million Forecast, by Country 2019 & 2032
- Table 24: Global Smart Food Logistics Market Revenue Million Forecast, by Component 2019 & 2032
- Table 25: Global Smart Food Logistics Market Revenue Million Forecast, by Technology 2019 & 2032
- Table 26: Global Smart Food Logistics Market Revenue Million Forecast, by Country 2019 & 2032
- Table 27: Global Smart Food Logistics Market Revenue Million Forecast, by Component 2019 & 2032
- Table 28: Global Smart Food Logistics Market Revenue Million Forecast, by Technology 2019 & 2032
- Table 29: Global Smart Food Logistics Market Revenue Million Forecast, by Country 2019 & 2032
Frequently Asked Questions
1. What is the projected Compound Annual Growth Rate (CAGR) of the Smart Food Logistics Market?
The projected CAGR is approximately 14.61%.
2. Which companies are prominent players in the Smart Food Logistics Market?
Key companies in the market include Geotab Inc, Monnit Corporation, Orbcomm, Kouei system ltd, Hacobu Co Ltd (MOVO), Seaos, Berlinger & Co AG, Samsara Inc, Kii Corporation, Teletrac Navman, Nippon Express co Ltd, Controlant, LYNA LOGICS Inc *List Not Exhaustive, Sensitech (Carrier Global Corporation), YUSEN LOGISTICS CO LTD (Nippon Yusen Kabushiki Kaisha(NYK), Verizon Connect.
3. What are the main segments of the Smart Food Logistics Market?
The market segments include Component, Technology.
4. Can you provide details about the market size?
The market size is estimated to be USD 13.80 Million as of 2022.
5. What are some drivers contributing to market growth?
Increasing Need for Efficient Monitoring and Tracking for Better Control of Assets.
6. What are the notable trends driving market growth?
Cold Chain Monitoring to Hold a Significant Share.
7. Are there any restraints impacting market growth?
Installation Complexities.
8. Can you provide examples of recent developments in the market?
April 2022: CoolKit, the largest manufacturer of temperature-controlled vans in the UK, has chosen ORBCOMM Inc. to supply temperature monitoring, management, and compliance for the refrigerated vehicles it offers to customers primarily in the pharmaceutical, healthcare, food, beverage, and agricultural industries. With ORBCOMM's strong temperature recorder solution, CoolKit can prove a continuous cold chain, reduce its carbon footprint by encouraging eco-friendly driving, and improve the efficiency of its administrative operations and workflow.
9. What pricing options are available for accessing the report?
Pricing options include single-user, multi-user, and enterprise licenses priced at USD 4750, USD 5250, and USD 8750 respectively.
10. Is the market size provided in terms of value or volume?
The market size is provided in terms of value, measured in Million.
11. Are there any specific market keywords associated with the report?
Yes, the market keyword associated with the report is "Smart Food Logistics Market," which aids in identifying and referencing the specific market segment covered.
12. How do I determine which pricing option suits my needs best?
The pricing options vary based on user requirements and access needs. Individual users may opt for single-user licenses, while businesses requiring broader access may choose multi-user or enterprise licenses for cost-effective access to the report.
13. Are there any additional resources or data provided in the Smart Food Logistics Market report?
While the report offers comprehensive insights, it's advisable to review the specific contents or supplementary materials provided to ascertain if additional resources or data are available.
14. How can I stay updated on further developments or reports in the Smart Food Logistics Market?
To stay informed about further developments, trends, and reports in the Smart Food Logistics Market, consider subscribing to industry newsletters, following relevant companies and organizations, or regularly checking reputable industry news sources and publications.
Methodology
Step 1 - Identification of Relevant Samples Size from Population Database


Step 2 - Approaches for Defining Global Market Size (Value, Volume* & Price*)

Note*: In applicable scenarios
Step 3 - Data Sources
Primary Research
- Web Analytics
- Survey Reports
- Research Institute
- Latest Research Reports
- Opinion Leaders
Secondary Research
- Annual Reports
- White Paper
- Latest Press Release
- Industry Association
- Paid Database
- Investor Presentations

Step 4 - Data Triangulation
Involves using different sources of information in order to increase the validity of a study
These sources are likely to be stakeholders in a program - participants, other researchers, program staff, other community members, and so on.
Then we put all data in single framework & apply various statistical tools to find out the dynamic on the market.
During the analysis stage, feedback from the stakeholder groups would be compared to determine areas of agreement as well as areas of divergence
