

Key Insights
The Smart Home Security Services market is experiencing robust expansion, driven by escalating consumer demand for enhanced safety and convenience, coupled with the proliferation of smart home technologies. Growing concerns over home security incidents are accelerating investment in advanced solutions. The decreasing cost of smart security devices and the increasing availability of sophisticated features, such as AI-powered surveillance and remote access, are making these systems more accessible and appealing. The trend towards interconnected living environments further fuels the demand for comprehensive smart home security ecosystems. This surge is met by innovative solutions including intelligent video surveillance systems and advanced access control technologies.
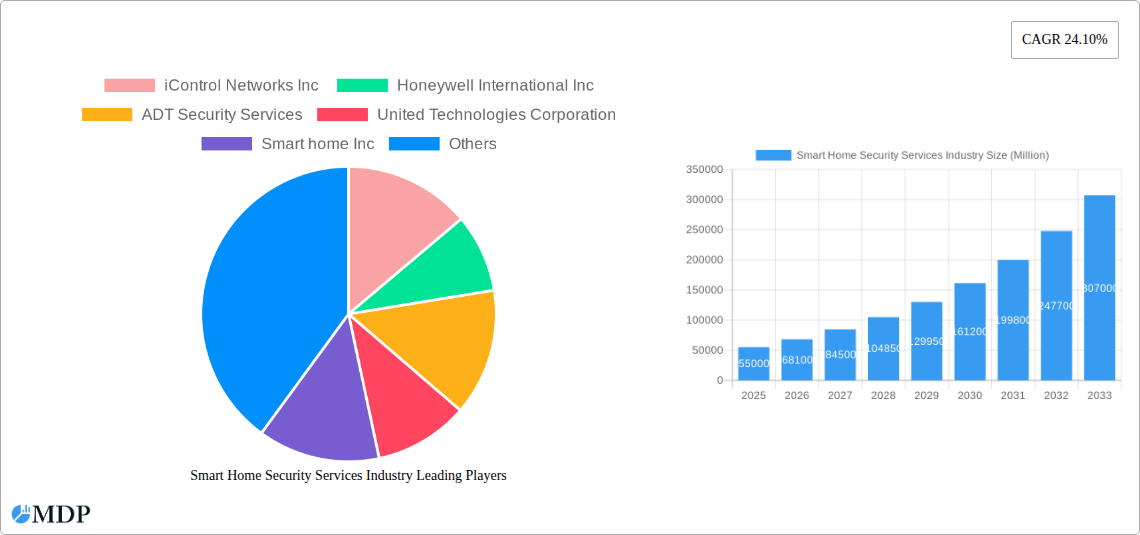
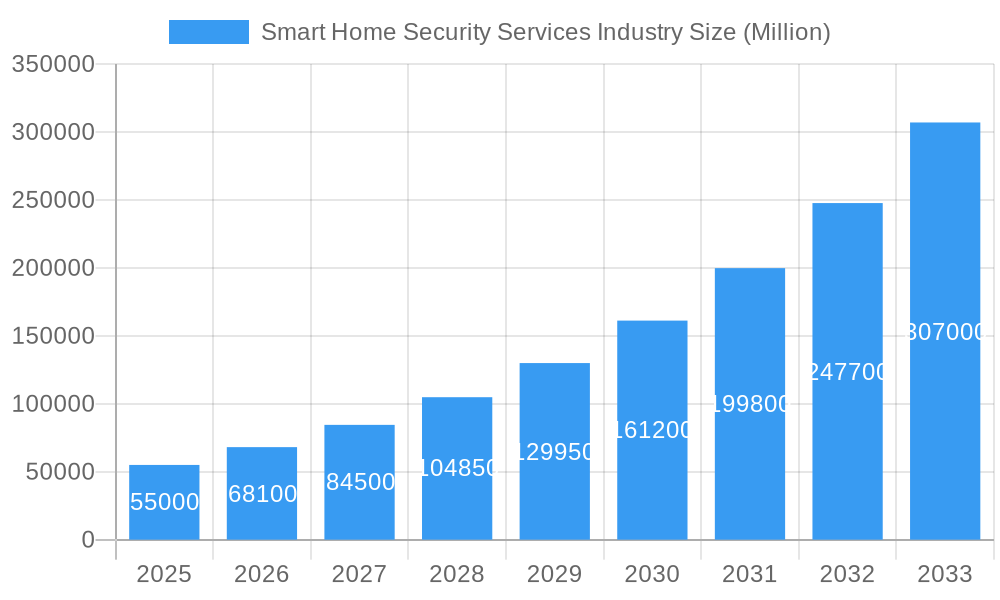
Smart Home Security Services Industry Market Size (In Billion)
Market growth is further supported by a rising preference for professional installation, ensuring optimal system performance. Key industry players are actively investing in R&D to introduce cutting-edge products. Geographically, North America is projected to lead the market, with Asia Pacific presenting significant growth opportunities due to rapid urbanization and a growing middle class. While demand is strong, potential restraints such as data privacy concerns and system integration complexity are being addressed through user-friendly interfaces and enhanced cybersecurity measures.
Smart Home Security Services Industry Company Market Share
This Smart Home Security Services Industry Report provides an in-depth analysis of the market from 2019-2024, with projections through 2033. Based on a 2025 base year, the market is estimated to reach $8.16 billion by 2025, with a projected Compound Annual Growth Rate (CAGR) of 14.45% through 2033. This critical insight is invaluable for stakeholders, investors, and technology providers navigating this dynamic sector.
Smart Home Security Services Industry Market Dynamics & Concentration
The smart home security services industry is characterized by a XX% market concentration, with key players like ADT Security Services, Vivint Inc., and Honeywell International Inc. holding significant market share. Innovation drivers are predominantly fueled by advancements in artificial intelligence, the Internet of Things (IoT), and enhanced connectivity, leading to the development of sophisticated video surveillance and access control systems. Regulatory frameworks are adapting to address data privacy and cybersecurity concerns, impacting product development and service delivery. Product substitutes, such as traditional alarm systems, are gradually being displaced by integrated smart solutions. End-user trends highlight a growing preference for DIY installation options, cloud-based services, and seamless integration with other smart home devices. Merger and acquisition (M&A) activities remain robust, with XX M&A deals recorded in the historical period, indicating a consolidation trend as larger companies acquire innovative startups to expand their product portfolios and market reach.
Smart Home Security Services Industry Industry Trends & Analysis
The smart home security services industry is experiencing a period of robust growth, with an anticipated Compound Annual Growth Rate (CAGR) of XX% during the forecast period (2025-2033). This expansion is primarily driven by increasing consumer awareness of security threats, coupled with a rising disposable income that enables investment in advanced home protection. Technological disruptions, particularly in areas like AI-powered video analytics for facial recognition and anomaly detection, are reshaping the competitive landscape. Consumer preferences are shifting towards integrated systems that offer remote monitoring, automated responses, and personalized security settings. The market penetration of smart home security solutions is expected to reach XX% by 2033, reflecting a substantial increase from current levels. Competitive dynamics are intense, with established security providers collaborating with tech giants and emerging startups to offer comprehensive and cutting-edge solutions. The convergence of security with other smart home functionalities, such as lighting and voice control, is a key trend that enhances user experience and drives adoption. The growing acceptance of cloud-based platforms facilitates easier management, updates, and data storage, further accelerating market growth.
Leading Markets & Segments in Smart Home Security Services Industry
The North America region currently dominates the smart home security services industry, driven by high disposable incomes, strong technological adoption rates, and a proactive approach to home safety. Within this region, the United States stands out as the leading market due to robust economic policies supporting technological innovation and widespread infrastructure for high-speed internet connectivity, essential for these services.
Product Segment Dominance:
Video Surveillance: This segment, encompassing Security Cameras, Monitors, and Storage Devices, holds the largest market share.
- Key Drivers:
- Increasing incidents of home burglary and theft.
- Advancements in high-definition (HD) and ultra-high-definition (UHD) camera technology.
- Integration of AI for intelligent event detection and facial recognition.
- Affordable cloud storage solutions for recorded footage.
- Dominance Analysis: The demand for real-time monitoring and evidence recording fuels the dominance of video surveillance. The availability of diverse camera types, from discreet indoor cameras to robust outdoor weather-proof models, caters to a wide range of consumer needs. The growing popularity of smart doorbells with integrated cameras further solidifies this segment's lead.
- Key Drivers:
Access Control: This segment includes technologies like Facial Recognition, Fingerprint Recognition, and Iris Recognition.
- Key Drivers:
- Desire for enhanced security and keyless entry solutions.
- Technological advancements in biometric accuracy and speed.
- Growing integration with other smart home ecosystems.
- Dominance Analysis: While still a growing segment, access control is rapidly gaining traction. The convenience of biometric authentication and the enhanced security it offers are appealing to consumers. The cost of these technologies is also becoming more accessible, driving wider adoption.
- Key Drivers:
Installation Segment Dominance:
Professional Installation: This remains a significant segment, particularly for complex integrated systems.
- Key Drivers:
- Need for expert setup and configuration of interconnected devices.
- Ensuring optimal system performance and reliability.
- Customer preference for hassle-free installation.
- Dominance Analysis: While DIY solutions are on the rise, professional installation provides a higher level of assurance for many consumers, especially those integrating multiple smart security components.
- Key Drivers:
Self-installation: This segment is experiencing rapid growth.
- Key Drivers:
- User-friendly interfaces and guided setup processes.
- Cost savings compared to professional installation.
- Increased technical proficiency among consumers.
- Dominance Analysis: The increasing availability of intuitive and wireless smart home security products, like the Swann Wire-Free Security Camera, is empowering consumers to easily set up their own systems, contributing to the growth of the self-installation segment.
- Key Drivers:
Smart Home Security Services Industry Product Developments
Product innovation is a cornerstone of the smart home security services industry, with companies continuously introducing advanced solutions. Recent developments focus on enhancing intelligence and user convenience. For instance, the integration of free facial recognition technology within security cameras, as seen with the Swann Wire-Free Security Camera, offers immediate threat identification. Furthermore, the convergence of various security functions, such as video, intrusion detection, and access control, into single cloud-based platforms like Hik-ProConnect, signifies a move towards comprehensive and streamlined security management. These innovations provide competitive advantages by offering enhanced features, easier integration, and improved user experience, directly addressing evolving consumer demands for sophisticated and accessible home protection.
Key Drivers of Smart Home Security Services Industry Growth
Several key factors are propelling the growth of the smart home security services industry.
- Technological Advancements: The proliferation of IoT devices, AI algorithms for facial and object recognition, and enhanced network connectivity are creating more sophisticated and effective security systems.
- Increasing Security Concerns: Rising awareness of crime rates and a desire for personal and property safety are significant motivators for consumers to invest in smart security solutions.
- Growing Disposable Income: A rise in household income in many regions allows consumers to allocate more resources towards enhancing their home security.
- Convenience and Remote Access: Smart home security systems offer the convenience of remote monitoring and control via smartphone apps, appealing to busy homeowners.
Challenges in the Smart Home Security Services Industry Market
Despite its promising growth, the smart home security services industry faces several challenges.
- Cybersecurity Threats: The interconnected nature of smart home devices makes them vulnerable to hacking and data breaches, raising concerns about privacy and the integrity of security systems.
- High Initial Cost: While prices are decreasing, the upfront investment for comprehensive smart security systems can still be a barrier for some consumers.
- Interoperability Issues: Ensuring seamless integration between devices from different manufacturers can be complex, leading to frustration for users.
- Regulatory Hurdles: Evolving regulations around data privacy and storage can impact service providers and require continuous adaptation.
Emerging Opportunities in Smart Home Security Services Industry
The smart home security services industry is ripe with emerging opportunities.
- AI and Machine Learning Integration: Further leveraging AI for predictive analytics, anomaly detection, and personalized security responses will enhance system effectiveness and user experience.
- Expansion into Emerging Markets: As internet penetration and disposable incomes rise in developing economies, there is a significant untapped market for smart home security solutions.
- Partnerships and Ecosystem Development: Collaborations between security providers, smart home device manufacturers, and service providers will foster greater interoperability and create more comprehensive smart home ecosystems.
- Subscription-Based Services: The growth of recurring revenue models, offering ongoing monitoring, cloud storage, and software updates, presents a stable and scalable business opportunity.
Leading Players in the Smart Home Security Services Industry Sector
- iControl Networks Inc
- Honeywell International Inc
- ADT Security Services
- United Technologies Corporation
- Smart home Inc
- Comcast Corporation
- Vivint Inc
- Tyco Security Products
- Control4 Corporation
- AT&T Inc
Key Milestones in Smart Home Security Services Industry Industry
- June 2020: Swann, focusing on DIY security solutions, launched the Swann Wire-Free Security Camera, a completely wireless camera for indoor/outdoor use with features like free face recognition and cloud/local storage.
- September 2020: Hangzhou Hikvision Digital Technology Co. Ltd introduced Hik-ProConnect, a cloud-based convergent security service solution that unifies video, intrusion, access control, and intercom systems, allowing remote system management by authorized security advisors.
Strategic Outlook for Smart Home Security Services Industry Market
The strategic outlook for the smart home security services industry remains highly positive, driven by continuous innovation and increasing consumer adoption. Future growth will be accelerated by the deeper integration of artificial intelligence for predictive security and proactive threat mitigation. The development of more intuitive and user-friendly interfaces will further lower adoption barriers, particularly in self-installation segments. Strategic partnerships and the expansion of open platforms will foster greater interoperability, creating more robust and attractive smart home ecosystems. The growing demand for integrated safety and convenience solutions, coupled with ongoing technological advancements, positions the industry for sustained expansion and significant market potential.
Smart Home Security Services Industry Segmentation
-
1. Product
-
1.1. Video Surveillance
- 1.1.1. Security Cameras
- 1.1.2. Monitors
- 1.1.3. Storage Devices
- 1.1.4. Others
-
1.2. Access Control
- 1.2.1. Facial Recognition
- 1.2.2. Fingerprint Recognition
- 1.2.3. Iris Recognition
-
1.1. Video Surveillance
-
2. Installation
- 2.1. Professional Installation
- 2.2. Self-installation
Smart Home Security Services Industry Segmentation By Geography
-
1. North America
- 1.1. United States
- 1.2. Canada
-
2. Europe
- 2.1. United Kingdom
- 2.2. Germany
- 2.3. France
- 2.4. Rest of Europe
-
3. Asia Pacific
- 3.1. China
- 3.2. Japan
- 3.3. India
- 3.4. Rest of Asia Pacific
-
4. Middle East and Africa
- 4.1. Saudi Arabia
- 4.2. United Arab Emirates
- 4.3. Rest of Middle East and Africa
-
5. Latin America
- 5.1. Brazil
- 5.2. Mexico
- 5.3. Rest of Latin America
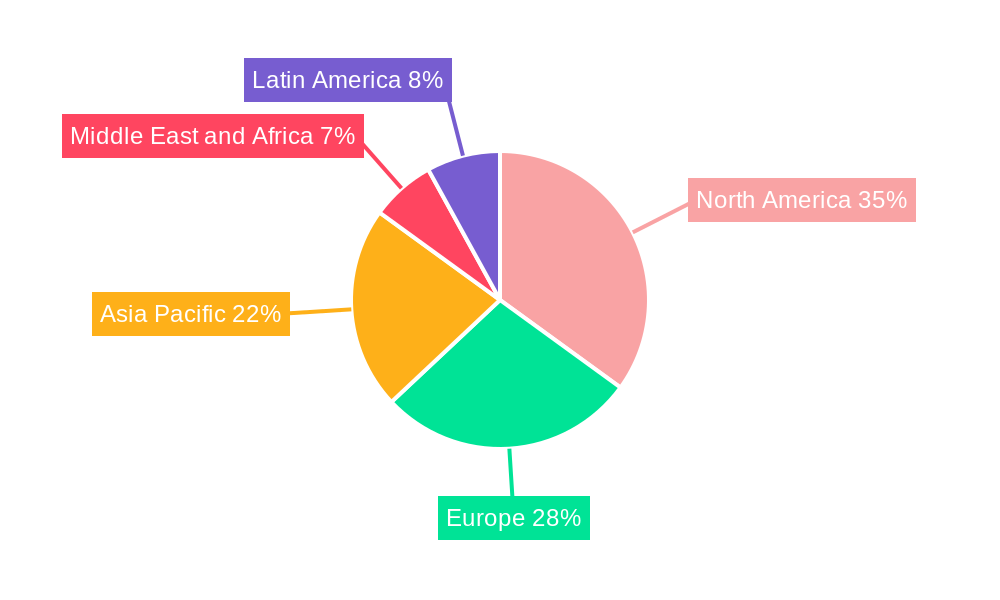
Smart Home Security Services Industry Regional Market Share
Geographic Coverage of Smart Home Security Services Industry
Smart Home Security Services Industry REPORT HIGHLIGHTS
| Aspects | Details |
|---|---|
| Study Period | 2020-2034 |
| Base Year | 2025 |
| Estimated Year | 2026 |
| Forecast Period | 2026-2034 |
| Historical Period | 2020-2025 |
| Growth Rate | CAGR of 14.45% from 2020-2034 |
| Segmentation |
|
Table of Contents
- 1. Introduction
- 1.1. Research Scope
- 1.2. Market Segmentation
- 1.3. Research Objective
- 1.4. Definitions and Assumptions
- 2. Executive Summary
- 2.1. Market Snapshot
- 3. Market Dynamics
- 3.1. Market Drivers
- 3.2. Market Restrains
- 3.3. Market Trends
- 3.4. Market Opportunities
- 4. Market Factor Analysis
- 4.1. Porters Five Forces
- 4.1.1. Bargaining Power of Suppliers
- 4.1.2. Bargaining Power of Buyers
- 4.1.3. Threat of New Entrants
- 4.1.4. Threat of Substitutes
- 4.1.5. Competitive Rivalry
- 4.2. PESTEL analysis
- 4.3. BCG Analysis
- 4.3.1. Stars (High Growth, High Market Share)
- 4.3.2. Cash Cows (Low Growth, High Market Share)
- 4.3.3. Question Mark (High Growth, Low Market Share)
- 4.3.4. Dogs (Low Growth, Low Market Share)
- 4.4. Ansoff Matrix Analysis
- 4.5. Supply Chain Analysis
- 4.6. Regulatory Landscape
- 4.7. Current Market Potential and Opportunity Assessment (TAM–SAM–SOM Framework)
- 4.8. MDP Analyst Note
- 4.1. Porters Five Forces
- 5. Market Analysis, Insights and Forecast 2021-2033
- 5.1. Market Analysis, Insights and Forecast - by Product
- 5.1.1. Video Surveillance
- 5.1.1.1. Security Cameras
- 5.1.1.2. Monitors
- 5.1.1.3. Storage Devices
- 5.1.1.4. Others
- 5.1.2. Access Control
- 5.1.2.1. Facial Recognition
- 5.1.2.2. Fingerprint Recognition
- 5.1.2.3. Iris Recognition
- 5.1.1. Video Surveillance
- 5.2. Market Analysis, Insights and Forecast - by Installation
- 5.2.1. Professional Installation
- 5.2.2. Self-installation
- 5.3. Market Analysis, Insights and Forecast - by Region
- 5.3.1. North America
- 5.3.2. Europe
- 5.3.3. Asia Pacific
- 5.3.4. Middle East and Africa
- 5.3.5. Latin America
- 5.1. Market Analysis, Insights and Forecast - by Product
- 6. Global Smart Home Security Services Industry Analysis, Insights and Forecast, 2021-2033
- 6.1. Market Analysis, Insights and Forecast - by Product
- 6.1.1. Video Surveillance
- 6.1.1.1. Security Cameras
- 6.1.1.2. Monitors
- 6.1.1.3. Storage Devices
- 6.1.1.4. Others
- 6.1.2. Access Control
- 6.1.2.1. Facial Recognition
- 6.1.2.2. Fingerprint Recognition
- 6.1.2.3. Iris Recognition
- 6.1.1. Video Surveillance
- 6.2. Market Analysis, Insights and Forecast - by Installation
- 6.2.1. Professional Installation
- 6.2.2. Self-installation
- 6.1. Market Analysis, Insights and Forecast - by Product
- 7. North America Smart Home Security Services Industry Analysis, Insights and Forecast, 2020-2032
- 7.1. Market Analysis, Insights and Forecast - by Product
- 7.1.1. Video Surveillance
- 7.1.1.1. Security Cameras
- 7.1.1.2. Monitors
- 7.1.1.3. Storage Devices
- 7.1.1.4. Others
- 7.1.2. Access Control
- 7.1.2.1. Facial Recognition
- 7.1.2.2. Fingerprint Recognition
- 7.1.2.3. Iris Recognition
- 7.1.1. Video Surveillance
- 7.2. Market Analysis, Insights and Forecast - by Installation
- 7.2.1. Professional Installation
- 7.2.2. Self-installation
- 7.1. Market Analysis, Insights and Forecast - by Product
- 8. Europe Smart Home Security Services Industry Analysis, Insights and Forecast, 2020-2032
- 8.1. Market Analysis, Insights and Forecast - by Product
- 8.1.1. Video Surveillance
- 8.1.1.1. Security Cameras
- 8.1.1.2. Monitors
- 8.1.1.3. Storage Devices
- 8.1.1.4. Others
- 8.1.2. Access Control
- 8.1.2.1. Facial Recognition
- 8.1.2.2. Fingerprint Recognition
- 8.1.2.3. Iris Recognition
- 8.1.1. Video Surveillance
- 8.2. Market Analysis, Insights and Forecast - by Installation
- 8.2.1. Professional Installation
- 8.2.2. Self-installation
- 8.1. Market Analysis, Insights and Forecast - by Product
- 9. Asia Pacific Smart Home Security Services Industry Analysis, Insights and Forecast, 2020-2032
- 9.1. Market Analysis, Insights and Forecast - by Product
- 9.1.1. Video Surveillance
- 9.1.1.1. Security Cameras
- 9.1.1.2. Monitors
- 9.1.1.3. Storage Devices
- 9.1.1.4. Others
- 9.1.2. Access Control
- 9.1.2.1. Facial Recognition
- 9.1.2.2. Fingerprint Recognition
- 9.1.2.3. Iris Recognition
- 9.1.1. Video Surveillance
- 9.2. Market Analysis, Insights and Forecast - by Installation
- 9.2.1. Professional Installation
- 9.2.2. Self-installation
- 9.1. Market Analysis, Insights and Forecast - by Product
- 10. Middle East and Africa Smart Home Security Services Industry Analysis, Insights and Forecast, 2020-2032
- 10.1. Market Analysis, Insights and Forecast - by Product
- 10.1.1. Video Surveillance
- 10.1.1.1. Security Cameras
- 10.1.1.2. Monitors
- 10.1.1.3. Storage Devices
- 10.1.1.4. Others
- 10.1.2. Access Control
- 10.1.2.1. Facial Recognition
- 10.1.2.2. Fingerprint Recognition
- 10.1.2.3. Iris Recognition
- 10.1.1. Video Surveillance
- 10.2. Market Analysis, Insights and Forecast - by Installation
- 10.2.1. Professional Installation
- 10.2.2. Self-installation
- 10.1. Market Analysis, Insights and Forecast - by Product
- 11. Latin America Smart Home Security Services Industry Analysis, Insights and Forecast, 2020-2032
- 11.1. Market Analysis, Insights and Forecast - by Product
- 11.1.1. Video Surveillance
- 11.1.1.1. Security Cameras
- 11.1.1.2. Monitors
- 11.1.1.3. Storage Devices
- 11.1.1.4. Others
- 11.1.2. Access Control
- 11.1.2.1. Facial Recognition
- 11.1.2.2. Fingerprint Recognition
- 11.1.2.3. Iris Recognition
- 11.1.1. Video Surveillance
- 11.2. Market Analysis, Insights and Forecast - by Installation
- 11.2.1. Professional Installation
- 11.2.2. Self-installation
- 11.1. Market Analysis, Insights and Forecast - by Product
- 12. Competitive Analysis
- 12.1. Company Profiles
- 12.1.1 iControl Networks Inc
- 12.1.1.1. Company Overview
- 12.1.1.2. Products
- 12.1.1.3. Company Financials
- 12.1.1.4. SWOT Analysis
- 12.1.2 Honeywell International Inc
- 12.1.2.1. Company Overview
- 12.1.2.2. Products
- 12.1.2.3. Company Financials
- 12.1.2.4. SWOT Analysis
- 12.1.3 ADT Security Services
- 12.1.3.1. Company Overview
- 12.1.3.2. Products
- 12.1.3.3. Company Financials
- 12.1.3.4. SWOT Analysis
- 12.1.4 United Technologies Corporation
- 12.1.4.1. Company Overview
- 12.1.4.2. Products
- 12.1.4.3. Company Financials
- 12.1.4.4. SWOT Analysis
- 12.1.5 Smart home Inc
- 12.1.5.1. Company Overview
- 12.1.5.2. Products
- 12.1.5.3. Company Financials
- 12.1.5.4. SWOT Analysis
- 12.1.6 Comcast Corporation
- 12.1.6.1. Company Overview
- 12.1.6.2. Products
- 12.1.6.3. Company Financials
- 12.1.6.4. SWOT Analysis
- 12.1.7 Vivint Inc
- 12.1.7.1. Company Overview
- 12.1.7.2. Products
- 12.1.7.3. Company Financials
- 12.1.7.4. SWOT Analysis
- 12.1.8 Tyco Security Products
- 12.1.8.1. Company Overview
- 12.1.8.2. Products
- 12.1.8.3. Company Financials
- 12.1.8.4. SWOT Analysis
- 12.1.9 Control4 Corporation
- 12.1.9.1. Company Overview
- 12.1.9.2. Products
- 12.1.9.3. Company Financials
- 12.1.9.4. SWOT Analysis
- 12.1.10 AT&T Inc
- 12.1.10.1. Company Overview
- 12.1.10.2. Products
- 12.1.10.3. Company Financials
- 12.1.10.4. SWOT Analysis
- 12.1.1 iControl Networks Inc
- 12.2. Market Entropy
- 12.2.1 Company's Key Areas Served
- 12.2.2 Recent Developments
- 12.3. Company Market Share Analysis 2025
- 12.3.1 Top 5 Companies Market Share Analysis
- 12.3.2 Top 3 Companies Market Share Analysis
- 12.4. List of Potential Customers
- 13. Research Methodology
List of Figures
- Figure 1: Global Smart Home Security Services Industry Revenue Breakdown (billion, %) by Region 2025 & 2033
- Figure 2: Global Smart Home Security Services Industry Volume Breakdown (K Unit, %) by Region 2025 & 2033
- Figure 3: North America Smart Home Security Services Industry Revenue (billion), by Product 2025 & 2033
- Figure 4: North America Smart Home Security Services Industry Volume (K Unit), by Product 2025 & 2033
- Figure 5: North America Smart Home Security Services Industry Revenue Share (%), by Product 2025 & 2033
- Figure 6: North America Smart Home Security Services Industry Volume Share (%), by Product 2025 & 2033
- Figure 7: North America Smart Home Security Services Industry Revenue (billion), by Installation 2025 & 2033
- Figure 8: North America Smart Home Security Services Industry Volume (K Unit), by Installation 2025 & 2033
- Figure 9: North America Smart Home Security Services Industry Revenue Share (%), by Installation 2025 & 2033
- Figure 10: North America Smart Home Security Services Industry Volume Share (%), by Installation 2025 & 2033
- Figure 11: North America Smart Home Security Services Industry Revenue (billion), by Country 2025 & 2033
- Figure 12: North America Smart Home Security Services Industry Volume (K Unit), by Country 2025 & 2033
- Figure 13: North America Smart Home Security Services Industry Revenue Share (%), by Country 2025 & 2033
- Figure 14: North America Smart Home Security Services Industry Volume Share (%), by Country 2025 & 2033
- Figure 15: Europe Smart Home Security Services Industry Revenue (billion), by Product 2025 & 2033
- Figure 16: Europe Smart Home Security Services Industry Volume (K Unit), by Product 2025 & 2033
- Figure 17: Europe Smart Home Security Services Industry Revenue Share (%), by Product 2025 & 2033
- Figure 18: Europe Smart Home Security Services Industry Volume Share (%), by Product 2025 & 2033
- Figure 19: Europe Smart Home Security Services Industry Revenue (billion), by Installation 2025 & 2033
- Figure 20: Europe Smart Home Security Services Industry Volume (K Unit), by Installation 2025 & 2033
- Figure 21: Europe Smart Home Security Services Industry Revenue Share (%), by Installation 2025 & 2033
- Figure 22: Europe Smart Home Security Services Industry Volume Share (%), by Installation 2025 & 2033
- Figure 23: Europe Smart Home Security Services Industry Revenue (billion), by Country 2025 & 2033
- Figure 24: Europe Smart Home Security Services Industry Volume (K Unit), by Country 2025 & 2033
- Figure 25: Europe Smart Home Security Services Industry Revenue Share (%), by Country 2025 & 2033
- Figure 26: Europe Smart Home Security Services Industry Volume Share (%), by Country 2025 & 2033
- Figure 27: Asia Pacific Smart Home Security Services Industry Revenue (billion), by Product 2025 & 2033
- Figure 28: Asia Pacific Smart Home Security Services Industry Volume (K Unit), by Product 2025 & 2033
- Figure 29: Asia Pacific Smart Home Security Services Industry Revenue Share (%), by Product 2025 & 2033
- Figure 30: Asia Pacific Smart Home Security Services Industry Volume Share (%), by Product 2025 & 2033
- Figure 31: Asia Pacific Smart Home Security Services Industry Revenue (billion), by Installation 2025 & 2033
- Figure 32: Asia Pacific Smart Home Security Services Industry Volume (K Unit), by Installation 2025 & 2033
- Figure 33: Asia Pacific Smart Home Security Services Industry Revenue Share (%), by Installation 2025 & 2033
- Figure 34: Asia Pacific Smart Home Security Services Industry Volume Share (%), by Installation 2025 & 2033
- Figure 35: Asia Pacific Smart Home Security Services Industry Revenue (billion), by Country 2025 & 2033
- Figure 36: Asia Pacific Smart Home Security Services Industry Volume (K Unit), by Country 2025 & 2033
- Figure 37: Asia Pacific Smart Home Security Services Industry Revenue Share (%), by Country 2025 & 2033
- Figure 38: Asia Pacific Smart Home Security Services Industry Volume Share (%), by Country 2025 & 2033
- Figure 39: Middle East and Africa Smart Home Security Services Industry Revenue (billion), by Product 2025 & 2033
- Figure 40: Middle East and Africa Smart Home Security Services Industry Volume (K Unit), by Product 2025 & 2033
- Figure 41: Middle East and Africa Smart Home Security Services Industry Revenue Share (%), by Product 2025 & 2033
- Figure 42: Middle East and Africa Smart Home Security Services Industry Volume Share (%), by Product 2025 & 2033
- Figure 43: Middle East and Africa Smart Home Security Services Industry Revenue (billion), by Installation 2025 & 2033
- Figure 44: Middle East and Africa Smart Home Security Services Industry Volume (K Unit), by Installation 2025 & 2033
- Figure 45: Middle East and Africa Smart Home Security Services Industry Revenue Share (%), by Installation 2025 & 2033
- Figure 46: Middle East and Africa Smart Home Security Services Industry Volume Share (%), by Installation 2025 & 2033
- Figure 47: Middle East and Africa Smart Home Security Services Industry Revenue (billion), by Country 2025 & 2033
- Figure 48: Middle East and Africa Smart Home Security Services Industry Volume (K Unit), by Country 2025 & 2033
- Figure 49: Middle East and Africa Smart Home Security Services Industry Revenue Share (%), by Country 2025 & 2033
- Figure 50: Middle East and Africa Smart Home Security Services Industry Volume Share (%), by Country 2025 & 2033
- Figure 51: Latin America Smart Home Security Services Industry Revenue (billion), by Product 2025 & 2033
- Figure 52: Latin America Smart Home Security Services Industry Volume (K Unit), by Product 2025 & 2033
- Figure 53: Latin America Smart Home Security Services Industry Revenue Share (%), by Product 2025 & 2033
- Figure 54: Latin America Smart Home Security Services Industry Volume Share (%), by Product 2025 & 2033
- Figure 55: Latin America Smart Home Security Services Industry Revenue (billion), by Installation 2025 & 2033
- Figure 56: Latin America Smart Home Security Services Industry Volume (K Unit), by Installation 2025 & 2033
- Figure 57: Latin America Smart Home Security Services Industry Revenue Share (%), by Installation 2025 & 2033
- Figure 58: Latin America Smart Home Security Services Industry Volume Share (%), by Installation 2025 & 2033
- Figure 59: Latin America Smart Home Security Services Industry Revenue (billion), by Country 2025 & 2033
- Figure 60: Latin America Smart Home Security Services Industry Volume (K Unit), by Country 2025 & 2033
- Figure 61: Latin America Smart Home Security Services Industry Revenue Share (%), by Country 2025 & 2033
- Figure 62: Latin America Smart Home Security Services Industry Volume Share (%), by Country 2025 & 2033
List of Tables
- Table 1: Global Smart Home Security Services Industry Revenue billion Forecast, by Product 2020 & 2033
- Table 2: Global Smart Home Security Services Industry Volume K Unit Forecast, by Product 2020 & 2033
- Table 3: Global Smart Home Security Services Industry Revenue billion Forecast, by Installation 2020 & 2033
- Table 4: Global Smart Home Security Services Industry Volume K Unit Forecast, by Installation 2020 & 2033
- Table 5: Global Smart Home Security Services Industry Revenue billion Forecast, by Region 2020 & 2033
- Table 6: Global Smart Home Security Services Industry Volume K Unit Forecast, by Region 2020 & 2033
- Table 7: Global Smart Home Security Services Industry Revenue billion Forecast, by Product 2020 & 2033
- Table 8: Global Smart Home Security Services Industry Volume K Unit Forecast, by Product 2020 & 2033
- Table 9: Global Smart Home Security Services Industry Revenue billion Forecast, by Installation 2020 & 2033
- Table 10: Global Smart Home Security Services Industry Volume K Unit Forecast, by Installation 2020 & 2033
- Table 11: Global Smart Home Security Services Industry Revenue billion Forecast, by Country 2020 & 2033
- Table 12: Global Smart Home Security Services Industry Volume K Unit Forecast, by Country 2020 & 2033
- Table 13: United States Smart Home Security Services Industry Revenue (billion) Forecast, by Application 2020 & 2033
- Table 14: United States Smart Home Security Services Industry Volume (K Unit) Forecast, by Application 2020 & 2033
- Table 15: Canada Smart Home Security Services Industry Revenue (billion) Forecast, by Application 2020 & 2033
- Table 16: Canada Smart Home Security Services Industry Volume (K Unit) Forecast, by Application 2020 & 2033
- Table 17: Global Smart Home Security Services Industry Revenue billion Forecast, by Product 2020 & 2033
- Table 18: Global Smart Home Security Services Industry Volume K Unit Forecast, by Product 2020 & 2033
- Table 19: Global Smart Home Security Services Industry Revenue billion Forecast, by Installation 2020 & 2033
- Table 20: Global Smart Home Security Services Industry Volume K Unit Forecast, by Installation 2020 & 2033
- Table 21: Global Smart Home Security Services Industry Revenue billion Forecast, by Country 2020 & 2033
- Table 22: Global Smart Home Security Services Industry Volume K Unit Forecast, by Country 2020 & 2033
- Table 23: United Kingdom Smart Home Security Services Industry Revenue (billion) Forecast, by Application 2020 & 2033
- Table 24: United Kingdom Smart Home Security Services Industry Volume (K Unit) Forecast, by Application 2020 & 2033
- Table 25: Germany Smart Home Security Services Industry Revenue (billion) Forecast, by Application 2020 & 2033
- Table 26: Germany Smart Home Security Services Industry Volume (K Unit) Forecast, by Application 2020 & 2033
- Table 27: France Smart Home Security Services Industry Revenue (billion) Forecast, by Application 2020 & 2033
- Table 28: France Smart Home Security Services Industry Volume (K Unit) Forecast, by Application 2020 & 2033
- Table 29: Rest of Europe Smart Home Security Services Industry Revenue (billion) Forecast, by Application 2020 & 2033
- Table 30: Rest of Europe Smart Home Security Services Industry Volume (K Unit) Forecast, by Application 2020 & 2033
- Table 31: Global Smart Home Security Services Industry Revenue billion Forecast, by Product 2020 & 2033
- Table 32: Global Smart Home Security Services Industry Volume K Unit Forecast, by Product 2020 & 2033
- Table 33: Global Smart Home Security Services Industry Revenue billion Forecast, by Installation 2020 & 2033
- Table 34: Global Smart Home Security Services Industry Volume K Unit Forecast, by Installation 2020 & 2033
- Table 35: Global Smart Home Security Services Industry Revenue billion Forecast, by Country 2020 & 2033
- Table 36: Global Smart Home Security Services Industry Volume K Unit Forecast, by Country 2020 & 2033
- Table 37: China Smart Home Security Services Industry Revenue (billion) Forecast, by Application 2020 & 2033
- Table 38: China Smart Home Security Services Industry Volume (K Unit) Forecast, by Application 2020 & 2033
- Table 39: Japan Smart Home Security Services Industry Revenue (billion) Forecast, by Application 2020 & 2033
- Table 40: Japan Smart Home Security Services Industry Volume (K Unit) Forecast, by Application 2020 & 2033
- Table 41: India Smart Home Security Services Industry Revenue (billion) Forecast, by Application 2020 & 2033
- Table 42: India Smart Home Security Services Industry Volume (K Unit) Forecast, by Application 2020 & 2033
- Table 43: Rest of Asia Pacific Smart Home Security Services Industry Revenue (billion) Forecast, by Application 2020 & 2033
- Table 44: Rest of Asia Pacific Smart Home Security Services Industry Volume (K Unit) Forecast, by Application 2020 & 2033
- Table 45: Global Smart Home Security Services Industry Revenue billion Forecast, by Product 2020 & 2033
- Table 46: Global Smart Home Security Services Industry Volume K Unit Forecast, by Product 2020 & 2033
- Table 47: Global Smart Home Security Services Industry Revenue billion Forecast, by Installation 2020 & 2033
- Table 48: Global Smart Home Security Services Industry Volume K Unit Forecast, by Installation 2020 & 2033
- Table 49: Global Smart Home Security Services Industry Revenue billion Forecast, by Country 2020 & 2033
- Table 50: Global Smart Home Security Services Industry Volume K Unit Forecast, by Country 2020 & 2033
- Table 51: Saudi Arabia Smart Home Security Services Industry Revenue (billion) Forecast, by Application 2020 & 2033
- Table 52: Saudi Arabia Smart Home Security Services Industry Volume (K Unit) Forecast, by Application 2020 & 2033
- Table 53: United Arab Emirates Smart Home Security Services Industry Revenue (billion) Forecast, by Application 2020 & 2033
- Table 54: United Arab Emirates Smart Home Security Services Industry Volume (K Unit) Forecast, by Application 2020 & 2033
- Table 55: Rest of Middle East and Africa Smart Home Security Services Industry Revenue (billion) Forecast, by Application 2020 & 2033
- Table 56: Rest of Middle East and Africa Smart Home Security Services Industry Volume (K Unit) Forecast, by Application 2020 & 2033
- Table 57: Global Smart Home Security Services Industry Revenue billion Forecast, by Product 2020 & 2033
- Table 58: Global Smart Home Security Services Industry Volume K Unit Forecast, by Product 2020 & 2033
- Table 59: Global Smart Home Security Services Industry Revenue billion Forecast, by Installation 2020 & 2033
- Table 60: Global Smart Home Security Services Industry Volume K Unit Forecast, by Installation 2020 & 2033
- Table 61: Global Smart Home Security Services Industry Revenue billion Forecast, by Country 2020 & 2033
- Table 62: Global Smart Home Security Services Industry Volume K Unit Forecast, by Country 2020 & 2033
- Table 63: Brazil Smart Home Security Services Industry Revenue (billion) Forecast, by Application 2020 & 2033
- Table 64: Brazil Smart Home Security Services Industry Volume (K Unit) Forecast, by Application 2020 & 2033
- Table 65: Mexico Smart Home Security Services Industry Revenue (billion) Forecast, by Application 2020 & 2033
- Table 66: Mexico Smart Home Security Services Industry Volume (K Unit) Forecast, by Application 2020 & 2033
- Table 67: Rest of Latin America Smart Home Security Services Industry Revenue (billion) Forecast, by Application 2020 & 2033
- Table 68: Rest of Latin America Smart Home Security Services Industry Volume (K Unit) Forecast, by Application 2020 & 2033
Frequently Asked Questions
1. What is the projected Compound Annual Growth Rate (CAGR) of the Smart Home Security Services Industry?
The projected CAGR is approximately 14.45%.
2. Which companies are prominent players in the Smart Home Security Services Industry?
Key companies in the market include iControl Networks Inc , Honeywell International Inc, ADT Security Services, United Technologies Corporation, Smart home Inc, Comcast Corporation, Vivint Inc, Tyco Security Products, Control4 Corporation, AT&T Inc.
3. What are the main segments of the Smart Home Security Services Industry?
The market segments include Product, Installation.
4. Can you provide details about the market size?
The market size is estimated to be USD 8.16 billion as of 2022.
5. What are some drivers contributing to market growth?
Growing Safety Concerns; Decreasing Costs of Sensors.
6. What are the notable trends driving market growth?
Video Surveillance systems are expected to register significant growth in forecasted period.
7. Are there any restraints impacting market growth?
High Installation Costs.
8. Can you provide examples of recent developments in the market?
June 2020: Swann, engaged in providing do-it-yourself security solutions, announced the release of the Swann Wire-Free Security Camera, a new, completely wireless camera that can be set up in seconds and used for monitoring indoors or outdoors in homes. The camera is stocked with modern smart security features, including free face recognition and cloud or local storage.
9. What pricing options are available for accessing the report?
Pricing options include single-user, multi-user, and enterprise licenses priced at USD 4750, USD 5250, and USD 8750 respectively.
10. Is the market size provided in terms of value or volume?
The market size is provided in terms of value, measured in billion and volume, measured in K Unit.
11. Are there any specific market keywords associated with the report?
Yes, the market keyword associated with the report is "Smart Home Security Services Industry," which aids in identifying and referencing the specific market segment covered.
12. How do I determine which pricing option suits my needs best?
The pricing options vary based on user requirements and access needs. Individual users may opt for single-user licenses, while businesses requiring broader access may choose multi-user or enterprise licenses for cost-effective access to the report.
13. Are there any additional resources or data provided in the Smart Home Security Services Industry report?
While the report offers comprehensive insights, it's advisable to review the specific contents or supplementary materials provided to ascertain if additional resources or data are available.
14. How can I stay updated on further developments or reports in the Smart Home Security Services Industry?
To stay informed about further developments, trends, and reports in the Smart Home Security Services Industry, consider subscribing to industry newsletters, following relevant companies and organizations, or regularly checking reputable industry news sources and publications.
Methodology
Step 1 - Identification of Relevant Samples Size from Population Database


Step 2 - Approaches for Defining Global Market Size (Value, Volume* & Price*)

Note*: In applicable scenarios
Step 3 - Data Sources
Primary Research
- Web Analytics
- Survey Reports
- Research Institute
- Latest Research Reports
- Opinion Leaders
Secondary Research
- Annual Reports
- White Paper
- Latest Press Release
- Industry Association
- Paid Database
- Investor Presentations

Step 4 - Data Triangulation
Involves using different sources of information in order to increase the validity of a study
These sources are likely to be stakeholders in a program - participants, other researchers, program staff, other community members, and so on.
Then we put all data in single framework & apply various statistical tools to find out the dynamic on the market.
During the analysis stage, feedback from the stakeholder groups would be compared to determine areas of agreement as well as areas of divergence