
Key Insights
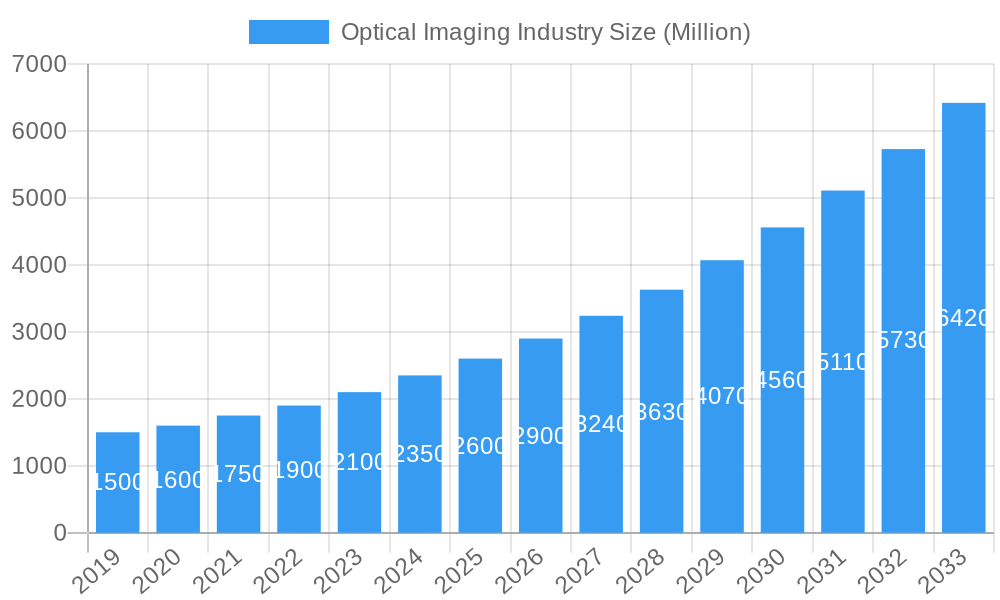
The global optical imaging market is poised for substantial growth, projected to reach approximately $2.60 billion by 2025 with an impressive Compound Annual Growth Rate (CAGR) of 11.30% extending through 2033. This robust expansion is driven by a confluence of factors, including the increasing prevalence of chronic diseases necessitating advanced diagnostic tools, the continuous innovation in imaging technologies, and a growing global demand for minimally invasive procedures. Key market segments demonstrating significant momentum include advanced imaging systems like spectral and hyperspectral imaging, which offer unparalleled detail and diagnostic accuracy. Within applications, ophthalmology, dermatology, and oncology are leading the charge, fueled by an aging population and a heightened focus on early disease detection and personalized treatment. The biotechnology and research sector also contributes significantly, leveraging optical imaging for groundbreaking scientific discoveries. The shift towards sophisticated software solutions, which enhance image analysis and workflow efficiency, is another critical driver.
Optical Imaging Industry Market Size (In Billion)
The market's trajectory is further bolstered by advancements in illumination systems and lens technology, enabling higher resolution and deeper tissue penetration. While the market is characterized by strong growth drivers, certain restraints such as the high cost of advanced equipment and the need for specialized training can pose challenges. However, the increasing accessibility of these technologies through strategic partnerships and government initiatives is mitigating these concerns. Geographically, North America and Europe currently dominate the market share due to well-established healthcare infrastructure and significant investments in R&D. The Asia Pacific region, particularly China and India, is emerging as a high-growth market, driven by rapid healthcare modernization and increasing patient awareness. Key players like Philips, Canon Medical Systems, and Carl Zeiss AG are at the forefront, innovating and expanding their product portfolios to capitalize on this burgeoning market. The continued integration of artificial intelligence and machine learning into optical imaging platforms is expected to further revolutionize diagnostic capabilities and patient outcomes in the coming years.
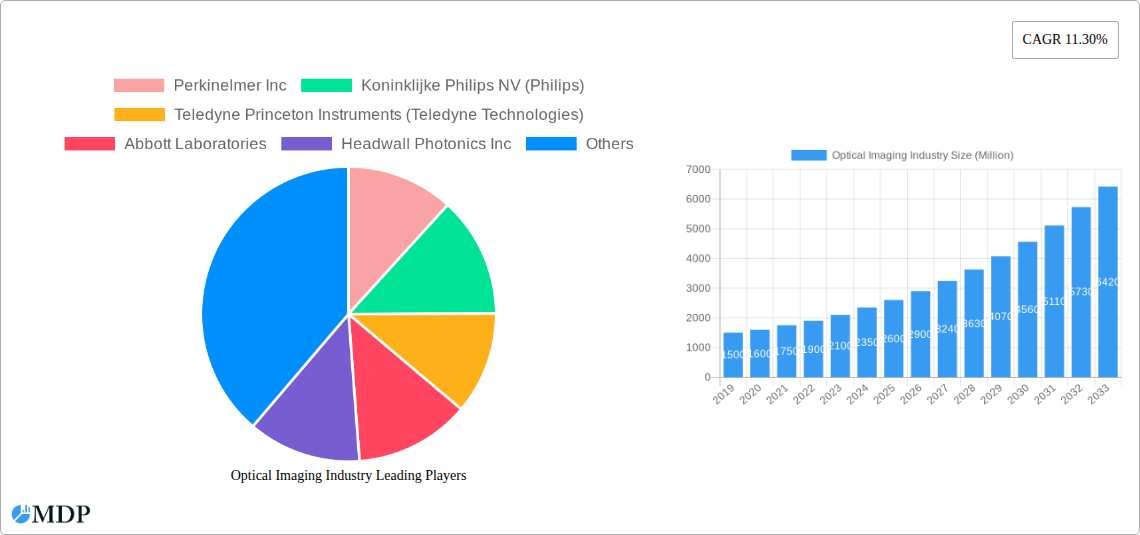
Optical Imaging Industry Company Market Share
Unveiling the Future of Vision: A Comprehensive Report on the Global Optical Imaging Industry (2019–2033)
This in-depth report provides an exhaustive analysis of the global optical imaging market, a sector poised for significant growth driven by advancements in medical diagnostics, research, and industrial applications. Spanning a study period from 2019 to 2033, with a base and estimated year of 2025 and a forecast period of 2025–2033, this report delves into the intricate dynamics shaping this multi-billion dollar industry. The historical period (2019–2024) lays the foundation for understanding current trends, while the forecast period offers actionable insights into future market trajectories.
The optical imaging market is segmented by product type, illumination system, lenses, software, application areas including ophthalmology, dentistry, dermatology, cardiology, neurology, oncology, and biotechnology & research, and end-user industries such as diagnostic imaging centers, hospitals & clinics, and research laboratories. Key techniques like Optical Coherence Tomography (OCT), Near Infrared Spectroscopy (NIRS), Hyperspectral Imaging, and Photoacoustic Tomography are meticulously examined. This report identifies leading players, analyzes market concentration, innovation drivers, regulatory landscapes, and strategic opportunities, making it an indispensable resource for industry stakeholders, investors, and decision-makers. The market is projected to reach XX Million by 2033, exhibiting a Compound Annual Growth Rate (CAGR) of XX%.
Optical Imaging Industry Market Dynamics & Concentration
The optical imaging industry is characterized by a moderate to high concentration, with a few dominant players holding significant market share, estimated at over XX% collectively. However, the market also exhibits room for innovation from specialized companies. Key innovation drivers include the relentless pursuit of higher resolution, improved sensitivity, faster acquisition speeds, and miniaturization of imaging systems. The integration of Artificial Intelligence (AI) and machine learning is a transformative force, enhancing image analysis, diagnostic accuracy, and workflow efficiency. Regulatory frameworks, particularly those from bodies like the FDA and EMA, play a crucial role in ensuring product safety and efficacy, influencing market entry and product development timelines. The development of advanced imaging techniques like hyperspectral and photoacoustic imaging offers new diagnostic capabilities, reducing reliance on conventional methods.
- Market Share of Top 5 Players: Estimated at XX%
- Number of M&A Deals (2021-2024): Approximately XX
- Innovation Drivers:
- AI/ML Integration for enhanced analysis
- Miniaturization and portability of devices
- Development of novel contrast agents and molecular imaging probes
- Increased demand for non-invasive diagnostic tools
- Regulatory Impact: Stringent approval processes for medical devices, particularly for novel technologies.
- Product Substitutes: While direct substitutes are limited for core optical imaging functionalities, advancements in other imaging modalities (e.g., MRI, CT) can indirectly impact market growth.
- End-User Trends: Growing preference for integrated solutions, cloud-based data management, and telemedicine capabilities.
- M&A Activities: Strategic acquisitions are common, driven by the need to expand product portfolios, gain access to new technologies, and consolidate market presence.
Optical Imaging Industry Industry Trends & Analysis
The global optical imaging market is experiencing robust growth, fueled by several interconnected trends and technological advancements. The increasing prevalence of chronic diseases such as cardiovascular diseases, neurological disorders, and cancer globally necessitates more accurate and early diagnostic tools, driving the demand for advanced optical imaging systems. For instance, the growing burden of cardiology-related ailments is a significant growth driver, with technologies like OCT playing a vital role in visualizing coronary artery blockages. Similarly, the burgeoning field of biotechnology and research relies heavily on optical imaging for molecular imaging, cell tracking, and drug discovery, creating a consistent demand for high-performance imaging solutions.
Technological disruptions are at the forefront of market expansion. The integration of AI and machine learning algorithms is revolutionizing image interpretation, enabling faster and more precise diagnoses, and automating repetitive tasks for researchers. This advancement is critical in complex applications like oncology, where early detection and accurate staging are paramount. The development of spectral imaging systems, including hyperspectral imaging, offers unparalleled capabilities in tissue characterization and disease identification, finding applications in dermatology and beyond. The market penetration of these advanced technologies is steadily increasing as their clinical and research benefits become more widely recognized.
Consumer preferences are shifting towards non-invasive and minimally invasive diagnostic procedures. Optical imaging techniques, by their very nature, often fulfill this requirement, offering a less burdensome experience for patients compared to traditional invasive methods. This preference is particularly pronounced in fields like ophthalmology, where OCT has become an indispensable tool for diagnosing and monitoring conditions like glaucoma and macular degeneration. The rising disposable income in emerging economies and increased healthcare spending are further contributing to market growth, making advanced imaging solutions more accessible. The competitive dynamics within the industry are characterized by both intense competition among established players and the emergence of agile startups pushing the boundaries of innovation.
The market is also benefiting from the growing emphasis on personalized medicine. Optical imaging techniques, especially those capable of molecular imaging, can provide detailed insights into cellular and molecular processes, aiding in the development of targeted therapies and treatment monitoring. This is a significant trend in neurology, where understanding brain function and disease progression at a cellular level is crucial. The overall market penetration is still evolving, but the trajectory is upward, indicating a strong future for optical imaging technologies across diverse applications. The estimated market size of XX Million in 2025 is expected to grow at a CAGR of XX% during the forecast period, reaching XX Million by 2033.
Leading Markets & Segments in Optical Imaging Industry
The global optical imaging market exhibits strong performance across several key regions and segments, driven by a combination of technological adoption, healthcare infrastructure, and research investment. North America, particularly the United States, currently holds a dominant position, driven by substantial healthcare spending, a high concentration of leading research institutions, and a robust regulatory environment that encourages innovation. Europe follows closely, with countries like Germany, the UK, and France demonstrating significant adoption of advanced optical imaging technologies, particularly in cardiology and oncology. Asia Pacific is emerging as a rapidly growing market, propelled by increasing healthcare expenditure, a growing awareness of advanced diagnostic methods, and government initiatives to improve healthcare access, especially in countries like China and India.
Within product segments, Imaging Systems represent the largest and most influential category. This encompasses both general Optical Imaging Systems and specialized Spectral Imaging Systems. The demand for high-resolution optical imaging systems for applications in biotechnology and research, oncology, and ophthalmology remains consistently high. The Software segment is also experiencing rapid expansion, as advanced image analysis, AI-driven diagnostics, and data management solutions become integral to the optical imaging workflow.
- Dominant Region: North America (USA)
- Key Drivers: High healthcare expenditure, strong R&D investment, advanced technological adoption.
- Infrastructure: Well-established hospital networks and diagnostic centers.
- Fastest Growing Region: Asia Pacific
- Key Drivers: Increasing healthcare spending, government support for medical technology, growing prevalence of target diseases.
- Economic Policies: Favorable policies promoting medical device manufacturing and adoption.
- Dominant Product Segment: Imaging Systems (Optical Imaging Systems, Spectral Imaging Systems)
- Key Drivers: Growing demand for high-resolution imaging, technological advancements, and widespread application in medical diagnostics.
- Market Penetration: High adoption rates in hospitals and research labs.
- Key Application Segments Driving Growth:
- Ophthalmology: Dominant due to the widespread use of OCT for glaucoma, diabetic retinopathy, and macular degeneration.
- Biotechnology and Research: Continuous need for advanced imaging in drug discovery, preclinical studies, and basic research.
- Oncology: Crucial for early detection, staging, and treatment monitoring.
- Cardiology: Growing demand for non-invasive visualization of coronary arteries using OCT.
- Emerging Application Segments: Neurology and Dermatology are showing significant growth potential with the development of specialized optical imaging techniques.
- Dominant Technique: Optical Coherence Tomography (OCT) remains a cornerstone due to its non-invasive nature and high resolution in cross-sectional imaging. Hyperspectral Imaging is gaining traction for its ability to provide detailed spectral information for tissue analysis.
- Dominant End User: Hospitals and Clinics represent the largest end-user segment, followed closely by Research Laboratories. Diagnostic Imaging Centers are also key contributors.
- Key Drivers: Increasing adoption of advanced diagnostics, focus on early disease detection, and growing patient volumes.
- Infrastructure: Investment in advanced medical equipment to improve patient care.
Optical Imaging Industry Product Developments
Recent product developments in the optical imaging industry are characterized by enhanced resolution, increased sensitivity, and novel integration capabilities. Revvity's September 2023 release of advanced preclinical imaging technologies, including the IVIS SpectrumCT 2 and next-generation IVIS Spectrum 2, significantly elevates in vivo optical imaging standards for preclinical research. These systems offer unparalleled sensitivity and versatility, supporting a wider array of research applications. Concurrently, Abbott's October 2023 launch of Ultreon 1.0 in India signifies a major step forward in coronary imaging. This software merges OCT with AI to provide detailed insights into coronary arteries, enabling precise differentiation of blockages and guiding stent deployment. These innovations underscore a trend towards more intelligent, sensitive, and application-specific optical imaging solutions.
Key Drivers of Optical Imaging Industry Growth
The optical imaging industry's growth is propelled by a confluence of factors. Technologically, the relentless advancements in sensor technology, optics, and software, particularly the integration of artificial intelligence, are enhancing imaging capabilities. Economically, increasing global healthcare expenditure, rising disposable incomes in emerging markets, and a growing demand for early and accurate disease diagnosis are significant drivers. Regulatory bodies' support for novel diagnostic tools and therapies further stimulates market expansion. The expanding application scope in fields like ophthalmology, cardiology, oncology, and biotechnology fuels sustained demand, while the inherent non-invasive nature of many optical imaging techniques aligns with evolving patient preferences for less burdensome procedures.
Challenges in the Optical Imaging Industry Market
Despite its robust growth, the optical imaging industry faces several challenges. High initial investment costs for advanced imaging systems can be a barrier, particularly for smaller healthcare facilities and research labs in developing economies. Stringent regulatory approval processes, while ensuring safety, can lead to prolonged market entry timelines for new technologies. The availability of skilled personnel to operate and interpret complex optical imaging equipment is also a concern, necessitating ongoing training and education initiatives. Furthermore, while not a direct substitute, the continuous improvement of competing imaging modalities like MRI and CT can influence market dynamics and investment priorities. Supply chain disruptions, as witnessed in recent global events, can also impact the availability and cost of critical components.
Emerging Opportunities in Optical Imaging Industry
Emerging opportunities in the optical imaging industry are abundant, driven by ongoing technological breakthroughs and evolving healthcare needs. The burgeoning field of personalized medicine presents a significant avenue for growth, with optical imaging techniques poised to play a crucial role in molecular diagnostics and targeted therapy assessment. The expansion of AI and machine learning into real-time image analysis and predictive diagnostics promises to unlock new levels of diagnostic accuracy and efficiency. Strategic partnerships between imaging technology developers and pharmaceutical companies for in vivo drug development and efficacy studies are also creating new avenues. Furthermore, the increasing focus on point-of-care diagnostics and portable imaging devices opens up opportunities in remote healthcare settings and specialized clinical applications.
Leading Players in the Optical Imaging Industry Sector
- Perkinelmer Inc
- Koninklijke Philips NV (Philips)
- Teledyne Princeton Instruments (Teledyne Technologies)
- Abbott Laboratories
- Headwall Photonics Inc
- Canon Medical Systems Corporation (Canon Inc)
- Carl Zeiss AG
- Thorlabs Inc
- Topcon Corporation
- Prior Scientific
- Olympus Corporation
- Leica Microsystems (Danaher Corporation)
- Nikon Metrology NV (Nikon Corporation)
Key Milestones in Optical Imaging Industry Industry
- September 2023: Revvity released advanced preclinical imaging technologies, including the IVIS SpectrumCT 2 and next-generation IVIS Spectrum 2 imaging systems, enhancing in vivo optical imaging sensitivity and versatility for preclinical research.
- October 2023: Abbott launched Ultreon 1.0, a coronary imaging software in India, merging OCT with AI for detailed visualization and analysis of coronary arteries, aiding in blockage differentiation and stent deployment guidance.
Strategic Outlook for Optical Imaging Industry Market
The strategic outlook for the optical imaging industry is exceptionally positive, characterized by sustained innovation and expanding application horizons. The continued integration of AI and machine learning will be a pivotal growth accelerator, driving higher diagnostic accuracy and operational efficiencies. The development of novel spectral and molecular imaging techniques will unlock unprecedented insights into disease mechanisms and therapeutic responses, particularly in oncology, neurology, and biotechnology. Expansion into emerging markets, coupled with a focus on developing more affordable and accessible imaging solutions, will further fuel market penetration. Strategic collaborations between technology providers, research institutions, and end-users will be crucial for translating groundbreaking research into clinically viable and commercially successful products, ensuring the industry's continued trajectory of multi-billion dollar growth.
Optical Imaging Industry Segmentation
-
1. Product
-
1.1. Imaging Systems
- 1.1.1. Optical Imaging Systems
- 1.1.2. Spectral Imaging Systems
- 1.2. By Illumination System
- 1.3. Lenses
- 1.4. Software
-
1.1. Imaging Systems
-
2. Application
- 2.1. Ophthalmology
- 2.2. Dentistry
- 2.3. Dermatology
- 2.4. Cardiology
- 2.5. Neurology
- 2.6. Oncology
- 2.7. Biotechnology and Research
- 2.8. Other Applications
-
3. Technique
- 3.1. Optical Coherence Tomography
- 3.2. Near Infrared Spectroscopy
- 3.3. Hyperspectral Imaging
- 3.4. Photoacoustic Tomography
-
4. End User
- 4.1. Diagnostic Imaging Center
- 4.2. Hospitals and Clinics
- 4.3. Research Laboratories
- 4.4. Other End Users
Optical Imaging Industry Segmentation By Geography
-
1. North America
- 1.1. United States
- 1.2. Canada
-
2. Europe
- 2.1. Germany
- 2.2. United Kingdom
- 2.3. France
-
3. Asia
- 3.1. China
- 3.2. Japan
- 3.3. India
- 4. Australia and New Zealand
- 5. Latin America
- 6. Middle East and Africa
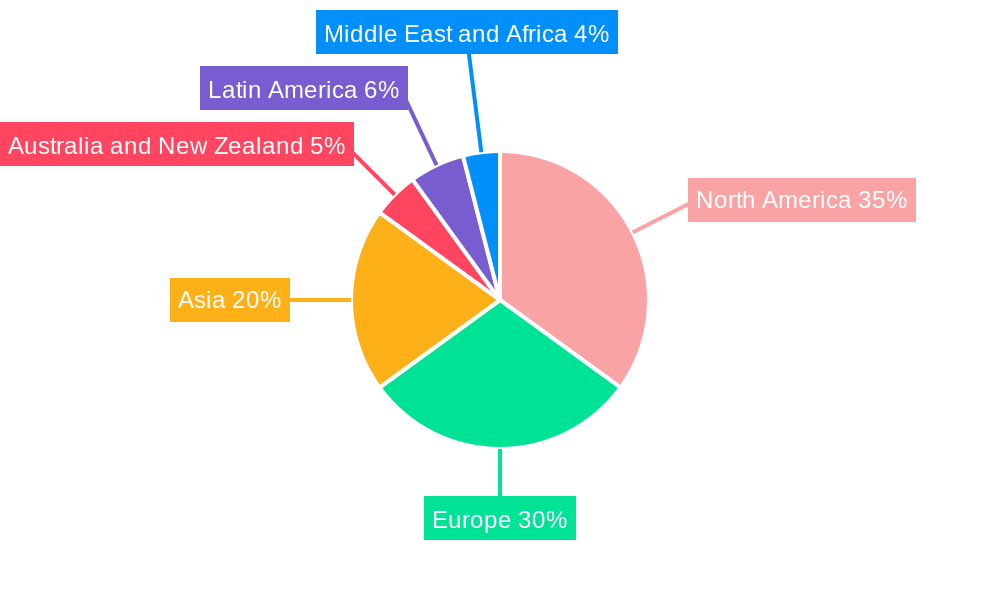
Optical Imaging Industry Regional Market Share
Geographic Coverage of Optical Imaging Industry
Optical Imaging Industry REPORT HIGHLIGHTS
| Aspects | Details |
|---|---|
| Study Period | 2020-2034 |
| Base Year | 2025 |
| Estimated Year | 2026 |
| Forecast Period | 2026-2034 |
| Historical Period | 2020-2025 |
| Growth Rate | CAGR of 11.30% from 2020-2034 |
| Segmentation |
|
Table of Contents
- 1. Introduction
- 1.1. Research Scope
- 1.2. Market Segmentation
- 1.3. Research Methodology
- 1.4. Definitions and Assumptions
- 2. Executive Summary
- 2.1. Introduction
- 3. Market Dynamics
- 3.1. Introduction
- 3.2. Market Drivers
- 3.2.1 Technological Advancements; Ability to Give Enhanced Pictures to Medical Practitioners
- 3.2.2 for Diagnosing Complex Diseases
- 3.3. Market Restrains
- 3.3.1. ; Emergence of Digital Radiography and Flat Panel Detector Technology
- 3.4. Market Trends
- 3.4.1. Oncology Application Segment is Expected to Hold Significant Market Share
- 4. Market Factor Analysis
- 4.1. Porters Five Forces
- 4.2. Supply/Value Chain
- 4.3. PESTEL analysis
- 4.4. Market Entropy
- 4.5. Patent/Trademark Analysis
- 5. Global Optical Imaging Industry Analysis, Insights and Forecast, 2020-2032
- 5.1. Market Analysis, Insights and Forecast - by Product
- 5.1.1. Imaging Systems
- 5.1.1.1. Optical Imaging Systems
- 5.1.1.2. Spectral Imaging Systems
- 5.1.2. By Illumination System
- 5.1.3. Lenses
- 5.1.4. Software
- 5.1.1. Imaging Systems
- 5.2. Market Analysis, Insights and Forecast - by Application
- 5.2.1. Ophthalmology
- 5.2.2. Dentistry
- 5.2.3. Dermatology
- 5.2.4. Cardiology
- 5.2.5. Neurology
- 5.2.6. Oncology
- 5.2.7. Biotechnology and Research
- 5.2.8. Other Applications
- 5.3. Market Analysis, Insights and Forecast - by Technique
- 5.3.1. Optical Coherence Tomography
- 5.3.2. Near Infrared Spectroscopy
- 5.3.3. Hyperspectral Imaging
- 5.3.4. Photoacoustic Tomography
- 5.4. Market Analysis, Insights and Forecast - by End User
- 5.4.1. Diagnostic Imaging Center
- 5.4.2. Hospitals and Clinics
- 5.4.3. Research Laboratories
- 5.4.4. Other End Users
- 5.5. Market Analysis, Insights and Forecast - by Region
- 5.5.1. North America
- 5.5.2. Europe
- 5.5.3. Asia
- 5.5.4. Australia and New Zealand
- 5.5.5. Latin America
- 5.5.6. Middle East and Africa
- 5.1. Market Analysis, Insights and Forecast - by Product
- 6. North America Optical Imaging Industry Analysis, Insights and Forecast, 2020-2032
- 6.1. Market Analysis, Insights and Forecast - by Product
- 6.1.1. Imaging Systems
- 6.1.1.1. Optical Imaging Systems
- 6.1.1.2. Spectral Imaging Systems
- 6.1.2. By Illumination System
- 6.1.3. Lenses
- 6.1.4. Software
- 6.1.1. Imaging Systems
- 6.2. Market Analysis, Insights and Forecast - by Application
- 6.2.1. Ophthalmology
- 6.2.2. Dentistry
- 6.2.3. Dermatology
- 6.2.4. Cardiology
- 6.2.5. Neurology
- 6.2.6. Oncology
- 6.2.7. Biotechnology and Research
- 6.2.8. Other Applications
- 6.3. Market Analysis, Insights and Forecast - by Technique
- 6.3.1. Optical Coherence Tomography
- 6.3.2. Near Infrared Spectroscopy
- 6.3.3. Hyperspectral Imaging
- 6.3.4. Photoacoustic Tomography
- 6.4. Market Analysis, Insights and Forecast - by End User
- 6.4.1. Diagnostic Imaging Center
- 6.4.2. Hospitals and Clinics
- 6.4.3. Research Laboratories
- 6.4.4. Other End Users
- 6.1. Market Analysis, Insights and Forecast - by Product
- 7. Europe Optical Imaging Industry Analysis, Insights and Forecast, 2020-2032
- 7.1. Market Analysis, Insights and Forecast - by Product
- 7.1.1. Imaging Systems
- 7.1.1.1. Optical Imaging Systems
- 7.1.1.2. Spectral Imaging Systems
- 7.1.2. By Illumination System
- 7.1.3. Lenses
- 7.1.4. Software
- 7.1.1. Imaging Systems
- 7.2. Market Analysis, Insights and Forecast - by Application
- 7.2.1. Ophthalmology
- 7.2.2. Dentistry
- 7.2.3. Dermatology
- 7.2.4. Cardiology
- 7.2.5. Neurology
- 7.2.6. Oncology
- 7.2.7. Biotechnology and Research
- 7.2.8. Other Applications
- 7.3. Market Analysis, Insights and Forecast - by Technique
- 7.3.1. Optical Coherence Tomography
- 7.3.2. Near Infrared Spectroscopy
- 7.3.3. Hyperspectral Imaging
- 7.3.4. Photoacoustic Tomography
- 7.4. Market Analysis, Insights and Forecast - by End User
- 7.4.1. Diagnostic Imaging Center
- 7.4.2. Hospitals and Clinics
- 7.4.3. Research Laboratories
- 7.4.4. Other End Users
- 7.1. Market Analysis, Insights and Forecast - by Product
- 8. Asia Optical Imaging Industry Analysis, Insights and Forecast, 2020-2032
- 8.1. Market Analysis, Insights and Forecast - by Product
- 8.1.1. Imaging Systems
- 8.1.1.1. Optical Imaging Systems
- 8.1.1.2. Spectral Imaging Systems
- 8.1.2. By Illumination System
- 8.1.3. Lenses
- 8.1.4. Software
- 8.1.1. Imaging Systems
- 8.2. Market Analysis, Insights and Forecast - by Application
- 8.2.1. Ophthalmology
- 8.2.2. Dentistry
- 8.2.3. Dermatology
- 8.2.4. Cardiology
- 8.2.5. Neurology
- 8.2.6. Oncology
- 8.2.7. Biotechnology and Research
- 8.2.8. Other Applications
- 8.3. Market Analysis, Insights and Forecast - by Technique
- 8.3.1. Optical Coherence Tomography
- 8.3.2. Near Infrared Spectroscopy
- 8.3.3. Hyperspectral Imaging
- 8.3.4. Photoacoustic Tomography
- 8.4. Market Analysis, Insights and Forecast - by End User
- 8.4.1. Diagnostic Imaging Center
- 8.4.2. Hospitals and Clinics
- 8.4.3. Research Laboratories
- 8.4.4. Other End Users
- 8.1. Market Analysis, Insights and Forecast - by Product
- 9. Australia and New Zealand Optical Imaging Industry Analysis, Insights and Forecast, 2020-2032
- 9.1. Market Analysis, Insights and Forecast - by Product
- 9.1.1. Imaging Systems
- 9.1.1.1. Optical Imaging Systems
- 9.1.1.2. Spectral Imaging Systems
- 9.1.2. By Illumination System
- 9.1.3. Lenses
- 9.1.4. Software
- 9.1.1. Imaging Systems
- 9.2. Market Analysis, Insights and Forecast - by Application
- 9.2.1. Ophthalmology
- 9.2.2. Dentistry
- 9.2.3. Dermatology
- 9.2.4. Cardiology
- 9.2.5. Neurology
- 9.2.6. Oncology
- 9.2.7. Biotechnology and Research
- 9.2.8. Other Applications
- 9.3. Market Analysis, Insights and Forecast - by Technique
- 9.3.1. Optical Coherence Tomography
- 9.3.2. Near Infrared Spectroscopy
- 9.3.3. Hyperspectral Imaging
- 9.3.4. Photoacoustic Tomography
- 9.4. Market Analysis, Insights and Forecast - by End User
- 9.4.1. Diagnostic Imaging Center
- 9.4.2. Hospitals and Clinics
- 9.4.3. Research Laboratories
- 9.4.4. Other End Users
- 9.1. Market Analysis, Insights and Forecast - by Product
- 10. Latin America Optical Imaging Industry Analysis, Insights and Forecast, 2020-2032
- 10.1. Market Analysis, Insights and Forecast - by Product
- 10.1.1. Imaging Systems
- 10.1.1.1. Optical Imaging Systems
- 10.1.1.2. Spectral Imaging Systems
- 10.1.2. By Illumination System
- 10.1.3. Lenses
- 10.1.4. Software
- 10.1.1. Imaging Systems
- 10.2. Market Analysis, Insights and Forecast - by Application
- 10.2.1. Ophthalmology
- 10.2.2. Dentistry
- 10.2.3. Dermatology
- 10.2.4. Cardiology
- 10.2.5. Neurology
- 10.2.6. Oncology
- 10.2.7. Biotechnology and Research
- 10.2.8. Other Applications
- 10.3. Market Analysis, Insights and Forecast - by Technique
- 10.3.1. Optical Coherence Tomography
- 10.3.2. Near Infrared Spectroscopy
- 10.3.3. Hyperspectral Imaging
- 10.3.4. Photoacoustic Tomography
- 10.4. Market Analysis, Insights and Forecast - by End User
- 10.4.1. Diagnostic Imaging Center
- 10.4.2. Hospitals and Clinics
- 10.4.3. Research Laboratories
- 10.4.4. Other End Users
- 10.1. Market Analysis, Insights and Forecast - by Product
- 11. Middle East and Africa Optical Imaging Industry Analysis, Insights and Forecast, 2020-2032
- 11.1. Market Analysis, Insights and Forecast - by Product
- 11.1.1. Imaging Systems
- 11.1.1.1. Optical Imaging Systems
- 11.1.1.2. Spectral Imaging Systems
- 11.1.2. By Illumination System
- 11.1.3. Lenses
- 11.1.4. Software
- 11.1.1. Imaging Systems
- 11.2. Market Analysis, Insights and Forecast - by Application
- 11.2.1. Ophthalmology
- 11.2.2. Dentistry
- 11.2.3. Dermatology
- 11.2.4. Cardiology
- 11.2.5. Neurology
- 11.2.6. Oncology
- 11.2.7. Biotechnology and Research
- 11.2.8. Other Applications
- 11.3. Market Analysis, Insights and Forecast - by Technique
- 11.3.1. Optical Coherence Tomography
- 11.3.2. Near Infrared Spectroscopy
- 11.3.3. Hyperspectral Imaging
- 11.3.4. Photoacoustic Tomography
- 11.4. Market Analysis, Insights and Forecast - by End User
- 11.4.1. Diagnostic Imaging Center
- 11.4.2. Hospitals and Clinics
- 11.4.3. Research Laboratories
- 11.4.4. Other End Users
- 11.1. Market Analysis, Insights and Forecast - by Product
- 12. Competitive Analysis
- 12.1. Global Market Share Analysis 2025
- 12.2. Company Profiles
- 12.2.1 Perkinelmer Inc
- 12.2.1.1. Overview
- 12.2.1.2. Products
- 12.2.1.3. SWOT Analysis
- 12.2.1.4. Recent Developments
- 12.2.1.5. Financials (Based on Availability)
- 12.2.2 Koninklijke Philips NV (Philips)
- 12.2.2.1. Overview
- 12.2.2.2. Products
- 12.2.2.3. SWOT Analysis
- 12.2.2.4. Recent Developments
- 12.2.2.5. Financials (Based on Availability)
- 12.2.3 Teledyne Princeton Instruments (Teledyne Technologies)
- 12.2.3.1. Overview
- 12.2.3.2. Products
- 12.2.3.3. SWOT Analysis
- 12.2.3.4. Recent Developments
- 12.2.3.5. Financials (Based on Availability)
- 12.2.4 Abbott Laboratories
- 12.2.4.1. Overview
- 12.2.4.2. Products
- 12.2.4.3. SWOT Analysis
- 12.2.4.4. Recent Developments
- 12.2.4.5. Financials (Based on Availability)
- 12.2.5 Headwall Photonics Inc
- 12.2.5.1. Overview
- 12.2.5.2. Products
- 12.2.5.3. SWOT Analysis
- 12.2.5.4. Recent Developments
- 12.2.5.5. Financials (Based on Availability)
- 12.2.6 Canon Medical Systems Corporation (Canon Inc )
- 12.2.6.1. Overview
- 12.2.6.2. Products
- 12.2.6.3. SWOT Analysis
- 12.2.6.4. Recent Developments
- 12.2.6.5. Financials (Based on Availability)
- 12.2.7 Carl Zeiss AG
- 12.2.7.1. Overview
- 12.2.7.2. Products
- 12.2.7.3. SWOT Analysis
- 12.2.7.4. Recent Developments
- 12.2.7.5. Financials (Based on Availability)
- 12.2.8 Thorlabs Inc
- 12.2.8.1. Overview
- 12.2.8.2. Products
- 12.2.8.3. SWOT Analysis
- 12.2.8.4. Recent Developments
- 12.2.8.5. Financials (Based on Availability)
- 12.2.9 Topcon Corporation
- 12.2.9.1. Overview
- 12.2.9.2. Products
- 12.2.9.3. SWOT Analysis
- 12.2.9.4. Recent Developments
- 12.2.9.5. Financials (Based on Availability)
- 12.2.10 Prior Scientific
- 12.2.10.1. Overview
- 12.2.10.2. Products
- 12.2.10.3. SWOT Analysis
- 12.2.10.4. Recent Developments
- 12.2.10.5. Financials (Based on Availability)
- 12.2.11 Olympus Corporation
- 12.2.11.1. Overview
- 12.2.11.2. Products
- 12.2.11.3. SWOT Analysis
- 12.2.11.4. Recent Developments
- 12.2.11.5. Financials (Based on Availability)
- 12.2.12 Leica Microsystems (Danaher Corporation)
- 12.2.12.1. Overview
- 12.2.12.2. Products
- 12.2.12.3. SWOT Analysis
- 12.2.12.4. Recent Developments
- 12.2.12.5. Financials (Based on Availability)
- 12.2.13 Nikon Metrology NV (Nikon Corporation)
- 12.2.13.1. Overview
- 12.2.13.2. Products
- 12.2.13.3. SWOT Analysis
- 12.2.13.4. Recent Developments
- 12.2.13.5. Financials (Based on Availability)
- 12.2.1 Perkinelmer Inc
List of Figures
- Figure 1: Global Optical Imaging Industry Revenue Breakdown (Million, %) by Region 2025 & 2033
- Figure 2: North America Optical Imaging Industry Revenue (Million), by Product 2025 & 2033
- Figure 3: North America Optical Imaging Industry Revenue Share (%), by Product 2025 & 2033
- Figure 4: North America Optical Imaging Industry Revenue (Million), by Application 2025 & 2033
- Figure 5: North America Optical Imaging Industry Revenue Share (%), by Application 2025 & 2033
- Figure 6: North America Optical Imaging Industry Revenue (Million), by Technique 2025 & 2033
- Figure 7: North America Optical Imaging Industry Revenue Share (%), by Technique 2025 & 2033
- Figure 8: North America Optical Imaging Industry Revenue (Million), by End User 2025 & 2033
- Figure 9: North America Optical Imaging Industry Revenue Share (%), by End User 2025 & 2033
- Figure 10: North America Optical Imaging Industry Revenue (Million), by Country 2025 & 2033
- Figure 11: North America Optical Imaging Industry Revenue Share (%), by Country 2025 & 2033
- Figure 12: Europe Optical Imaging Industry Revenue (Million), by Product 2025 & 2033
- Figure 13: Europe Optical Imaging Industry Revenue Share (%), by Product 2025 & 2033
- Figure 14: Europe Optical Imaging Industry Revenue (Million), by Application 2025 & 2033
- Figure 15: Europe Optical Imaging Industry Revenue Share (%), by Application 2025 & 2033
- Figure 16: Europe Optical Imaging Industry Revenue (Million), by Technique 2025 & 2033
- Figure 17: Europe Optical Imaging Industry Revenue Share (%), by Technique 2025 & 2033
- Figure 18: Europe Optical Imaging Industry Revenue (Million), by End User 2025 & 2033
- Figure 19: Europe Optical Imaging Industry Revenue Share (%), by End User 2025 & 2033
- Figure 20: Europe Optical Imaging Industry Revenue (Million), by Country 2025 & 2033
- Figure 21: Europe Optical Imaging Industry Revenue Share (%), by Country 2025 & 2033
- Figure 22: Asia Optical Imaging Industry Revenue (Million), by Product 2025 & 2033
- Figure 23: Asia Optical Imaging Industry Revenue Share (%), by Product 2025 & 2033
- Figure 24: Asia Optical Imaging Industry Revenue (Million), by Application 2025 & 2033
- Figure 25: Asia Optical Imaging Industry Revenue Share (%), by Application 2025 & 2033
- Figure 26: Asia Optical Imaging Industry Revenue (Million), by Technique 2025 & 2033
- Figure 27: Asia Optical Imaging Industry Revenue Share (%), by Technique 2025 & 2033
- Figure 28: Asia Optical Imaging Industry Revenue (Million), by End User 2025 & 2033
- Figure 29: Asia Optical Imaging Industry Revenue Share (%), by End User 2025 & 2033
- Figure 30: Asia Optical Imaging Industry Revenue (Million), by Country 2025 & 2033
- Figure 31: Asia Optical Imaging Industry Revenue Share (%), by Country 2025 & 2033
- Figure 32: Australia and New Zealand Optical Imaging Industry Revenue (Million), by Product 2025 & 2033
- Figure 33: Australia and New Zealand Optical Imaging Industry Revenue Share (%), by Product 2025 & 2033
- Figure 34: Australia and New Zealand Optical Imaging Industry Revenue (Million), by Application 2025 & 2033
- Figure 35: Australia and New Zealand Optical Imaging Industry Revenue Share (%), by Application 2025 & 2033
- Figure 36: Australia and New Zealand Optical Imaging Industry Revenue (Million), by Technique 2025 & 2033
- Figure 37: Australia and New Zealand Optical Imaging Industry Revenue Share (%), by Technique 2025 & 2033
- Figure 38: Australia and New Zealand Optical Imaging Industry Revenue (Million), by End User 2025 & 2033
- Figure 39: Australia and New Zealand Optical Imaging Industry Revenue Share (%), by End User 2025 & 2033
- Figure 40: Australia and New Zealand Optical Imaging Industry Revenue (Million), by Country 2025 & 2033
- Figure 41: Australia and New Zealand Optical Imaging Industry Revenue Share (%), by Country 2025 & 2033
- Figure 42: Latin America Optical Imaging Industry Revenue (Million), by Product 2025 & 2033
- Figure 43: Latin America Optical Imaging Industry Revenue Share (%), by Product 2025 & 2033
- Figure 44: Latin America Optical Imaging Industry Revenue (Million), by Application 2025 & 2033
- Figure 45: Latin America Optical Imaging Industry Revenue Share (%), by Application 2025 & 2033
- Figure 46: Latin America Optical Imaging Industry Revenue (Million), by Technique 2025 & 2033
- Figure 47: Latin America Optical Imaging Industry Revenue Share (%), by Technique 2025 & 2033
- Figure 48: Latin America Optical Imaging Industry Revenue (Million), by End User 2025 & 2033
- Figure 49: Latin America Optical Imaging Industry Revenue Share (%), by End User 2025 & 2033
- Figure 50: Latin America Optical Imaging Industry Revenue (Million), by Country 2025 & 2033
- Figure 51: Latin America Optical Imaging Industry Revenue Share (%), by Country 2025 & 2033
- Figure 52: Middle East and Africa Optical Imaging Industry Revenue (Million), by Product 2025 & 2033
- Figure 53: Middle East and Africa Optical Imaging Industry Revenue Share (%), by Product 2025 & 2033
- Figure 54: Middle East and Africa Optical Imaging Industry Revenue (Million), by Application 2025 & 2033
- Figure 55: Middle East and Africa Optical Imaging Industry Revenue Share (%), by Application 2025 & 2033
- Figure 56: Middle East and Africa Optical Imaging Industry Revenue (Million), by Technique 2025 & 2033
- Figure 57: Middle East and Africa Optical Imaging Industry Revenue Share (%), by Technique 2025 & 2033
- Figure 58: Middle East and Africa Optical Imaging Industry Revenue (Million), by End User 2025 & 2033
- Figure 59: Middle East and Africa Optical Imaging Industry Revenue Share (%), by End User 2025 & 2033
- Figure 60: Middle East and Africa Optical Imaging Industry Revenue (Million), by Country 2025 & 2033
- Figure 61: Middle East and Africa Optical Imaging Industry Revenue Share (%), by Country 2025 & 2033
List of Tables
- Table 1: Global Optical Imaging Industry Revenue Million Forecast, by Product 2020 & 2033
- Table 2: Global Optical Imaging Industry Revenue Million Forecast, by Application 2020 & 2033
- Table 3: Global Optical Imaging Industry Revenue Million Forecast, by Technique 2020 & 2033
- Table 4: Global Optical Imaging Industry Revenue Million Forecast, by End User 2020 & 2033
- Table 5: Global Optical Imaging Industry Revenue Million Forecast, by Region 2020 & 2033
- Table 6: Global Optical Imaging Industry Revenue Million Forecast, by Product 2020 & 2033
- Table 7: Global Optical Imaging Industry Revenue Million Forecast, by Application 2020 & 2033
- Table 8: Global Optical Imaging Industry Revenue Million Forecast, by Technique 2020 & 2033
- Table 9: Global Optical Imaging Industry Revenue Million Forecast, by End User 2020 & 2033
- Table 10: Global Optical Imaging Industry Revenue Million Forecast, by Country 2020 & 2033
- Table 11: United States Optical Imaging Industry Revenue (Million) Forecast, by Application 2020 & 2033
- Table 12: Canada Optical Imaging Industry Revenue (Million) Forecast, by Application 2020 & 2033
- Table 13: Global Optical Imaging Industry Revenue Million Forecast, by Product 2020 & 2033
- Table 14: Global Optical Imaging Industry Revenue Million Forecast, by Application 2020 & 2033
- Table 15: Global Optical Imaging Industry Revenue Million Forecast, by Technique 2020 & 2033
- Table 16: Global Optical Imaging Industry Revenue Million Forecast, by End User 2020 & 2033
- Table 17: Global Optical Imaging Industry Revenue Million Forecast, by Country 2020 & 2033
- Table 18: Germany Optical Imaging Industry Revenue (Million) Forecast, by Application 2020 & 2033
- Table 19: United Kingdom Optical Imaging Industry Revenue (Million) Forecast, by Application 2020 & 2033
- Table 20: France Optical Imaging Industry Revenue (Million) Forecast, by Application 2020 & 2033
- Table 21: Global Optical Imaging Industry Revenue Million Forecast, by Product 2020 & 2033
- Table 22: Global Optical Imaging Industry Revenue Million Forecast, by Application 2020 & 2033
- Table 23: Global Optical Imaging Industry Revenue Million Forecast, by Technique 2020 & 2033
- Table 24: Global Optical Imaging Industry Revenue Million Forecast, by End User 2020 & 2033
- Table 25: Global Optical Imaging Industry Revenue Million Forecast, by Country 2020 & 2033
- Table 26: China Optical Imaging Industry Revenue (Million) Forecast, by Application 2020 & 2033
- Table 27: Japan Optical Imaging Industry Revenue (Million) Forecast, by Application 2020 & 2033
- Table 28: India Optical Imaging Industry Revenue (Million) Forecast, by Application 2020 & 2033
- Table 29: Global Optical Imaging Industry Revenue Million Forecast, by Product 2020 & 2033
- Table 30: Global Optical Imaging Industry Revenue Million Forecast, by Application 2020 & 2033
- Table 31: Global Optical Imaging Industry Revenue Million Forecast, by Technique 2020 & 2033
- Table 32: Global Optical Imaging Industry Revenue Million Forecast, by End User 2020 & 2033
- Table 33: Global Optical Imaging Industry Revenue Million Forecast, by Country 2020 & 2033
- Table 34: Global Optical Imaging Industry Revenue Million Forecast, by Product 2020 & 2033
- Table 35: Global Optical Imaging Industry Revenue Million Forecast, by Application 2020 & 2033
- Table 36: Global Optical Imaging Industry Revenue Million Forecast, by Technique 2020 & 2033
- Table 37: Global Optical Imaging Industry Revenue Million Forecast, by End User 2020 & 2033
- Table 38: Global Optical Imaging Industry Revenue Million Forecast, by Country 2020 & 2033
- Table 39: Global Optical Imaging Industry Revenue Million Forecast, by Product 2020 & 2033
- Table 40: Global Optical Imaging Industry Revenue Million Forecast, by Application 2020 & 2033
- Table 41: Global Optical Imaging Industry Revenue Million Forecast, by Technique 2020 & 2033
- Table 42: Global Optical Imaging Industry Revenue Million Forecast, by End User 2020 & 2033
- Table 43: Global Optical Imaging Industry Revenue Million Forecast, by Country 2020 & 2033
Frequently Asked Questions
1. What is the projected Compound Annual Growth Rate (CAGR) of the Optical Imaging Industry?
The projected CAGR is approximately 11.30%.
2. Which companies are prominent players in the Optical Imaging Industry?
Key companies in the market include Perkinelmer Inc, Koninklijke Philips NV (Philips), Teledyne Princeton Instruments (Teledyne Technologies), Abbott Laboratories, Headwall Photonics Inc, Canon Medical Systems Corporation (Canon Inc ), Carl Zeiss AG, Thorlabs Inc, Topcon Corporation, Prior Scientific, Olympus Corporation, Leica Microsystems (Danaher Corporation), Nikon Metrology NV (Nikon Corporation).
3. What are the main segments of the Optical Imaging Industry?
The market segments include Product, Application, Technique, End User.
4. Can you provide details about the market size?
The market size is estimated to be USD 2.60 Million as of 2022.
5. What are some drivers contributing to market growth?
Technological Advancements; Ability to Give Enhanced Pictures to Medical Practitioners. for Diagnosing Complex Diseases.
6. What are the notable trends driving market growth?
Oncology Application Segment is Expected to Hold Significant Market Share.
7. Are there any restraints impacting market growth?
; Emergence of Digital Radiography and Flat Panel Detector Technology.
8. Can you provide examples of recent developments in the market?
September 2023 - Revvity released many advanced preclinical imaging technologies across multiple applications in preclinical research. These new innovations consist of the IVIS SpectrumCT 2 and next-generation IVIS Spectrum 2 imaging systems. This increases the sensitivity standards and versatility of in vivo optical imaging.
9. What pricing options are available for accessing the report?
Pricing options include single-user, multi-user, and enterprise licenses priced at USD 4750, USD 5250, and USD 8750 respectively.
10. Is the market size provided in terms of value or volume?
The market size is provided in terms of value, measured in Million.
11. Are there any specific market keywords associated with the report?
Yes, the market keyword associated with the report is "Optical Imaging Industry," which aids in identifying and referencing the specific market segment covered.
12. How do I determine which pricing option suits my needs best?
The pricing options vary based on user requirements and access needs. Individual users may opt for single-user licenses, while businesses requiring broader access may choose multi-user or enterprise licenses for cost-effective access to the report.
13. Are there any additional resources or data provided in the Optical Imaging Industry report?
While the report offers comprehensive insights, it's advisable to review the specific contents or supplementary materials provided to ascertain if additional resources or data are available.
14. How can I stay updated on further developments or reports in the Optical Imaging Industry?
To stay informed about further developments, trends, and reports in the Optical Imaging Industry, consider subscribing to industry newsletters, following relevant companies and organizations, or regularly checking reputable industry news sources and publications.
Methodology
Step 1 - Identification of Relevant Samples Size from Population Database


Step 2 - Approaches for Defining Global Market Size (Value, Volume* & Price*)

Note*: In applicable scenarios
Step 3 - Data Sources
Primary Research
- Web Analytics
- Survey Reports
- Research Institute
- Latest Research Reports
- Opinion Leaders
Secondary Research
- Annual Reports
- White Paper
- Latest Press Release
- Industry Association
- Paid Database
- Investor Presentations

Step 4 - Data Triangulation
Involves using different sources of information in order to increase the validity of a study
These sources are likely to be stakeholders in a program - participants, other researchers, program staff, other community members, and so on.
Then we put all data in single framework & apply various statistical tools to find out the dynamic on the market.
During the analysis stage, feedback from the stakeholder groups would be compared to determine areas of agreement as well as areas of divergence
