

Key Insights
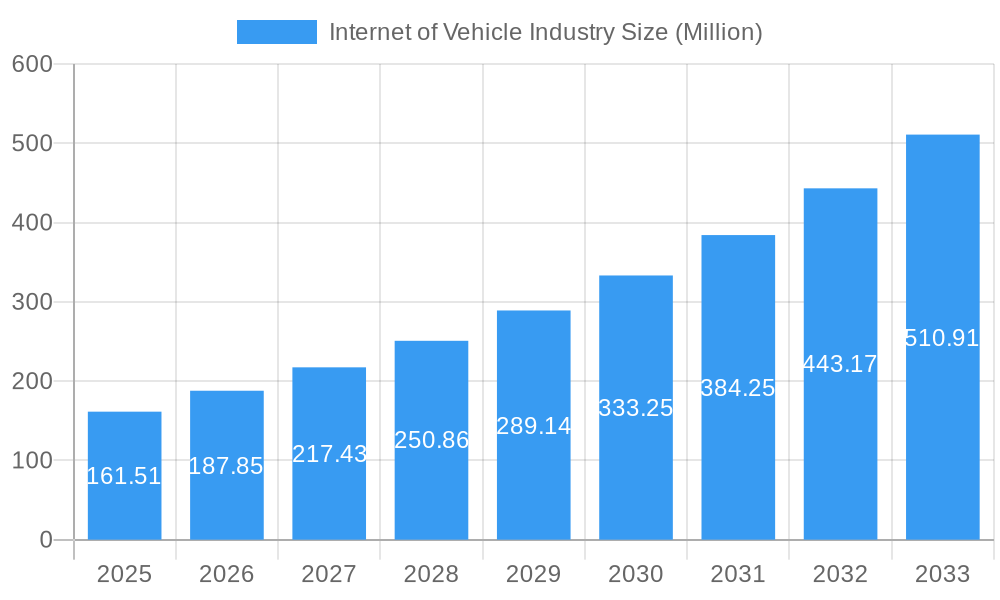
The Internet of Vehicles (IoV) market is poised for substantial growth, projected to reach $161.51 million with an impressive Compound Annual Growth Rate (CAGR) of 16.38% through 2033. This rapid expansion is fueled by a confluence of powerful drivers, including the increasing demand for real-time transit management systems that optimize logistics and improve efficiency, alongside the critical need for enhanced vehicle security solutions in an increasingly connected world. The proliferation of remote monitoring systems, coupled with advancements in network bandwidth management, further underpins this growth by enabling seamless data exchange and control. Key applications such as mobility management, sophisticated vehicle management platforms, and the integration of in-vehicle entertainment are revolutionizing the user experience and creating new revenue streams. The transportation and logistics sector, alongside the automotive industry, are the primary beneficiaries and adopters of IoV technologies, with a growing impact also seen in other end-user industries. Major players like Infineon Technologies, IBM, Symantec, Bosch, Cisco, Microsoft, Tesla, Waymo, Oracle, General Electric, and SAP are actively innovating and investing, shaping the competitive landscape and accelerating market penetration.
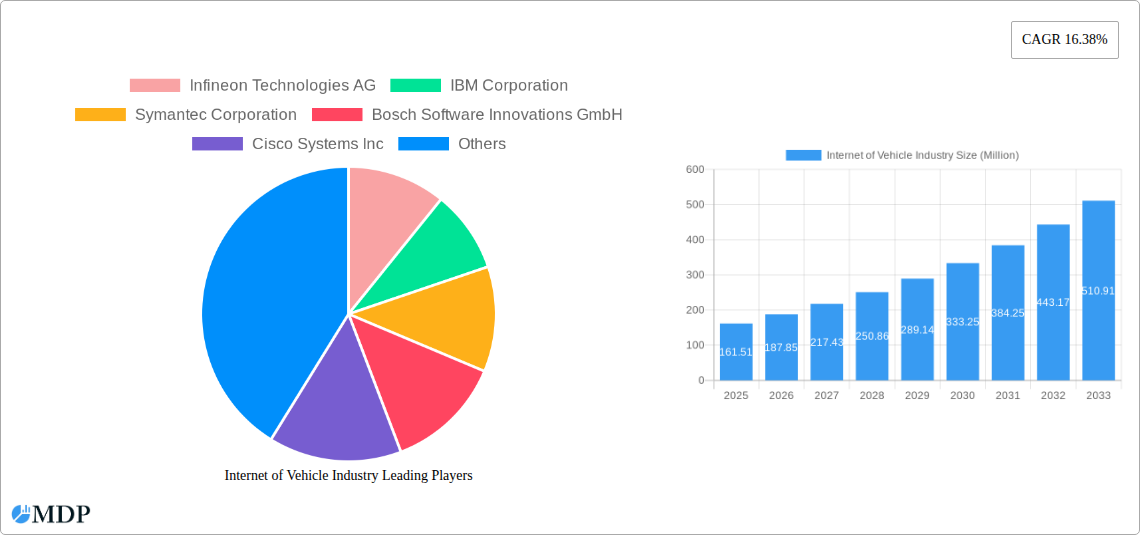
Internet of Vehicle Industry Market Size (In Million)
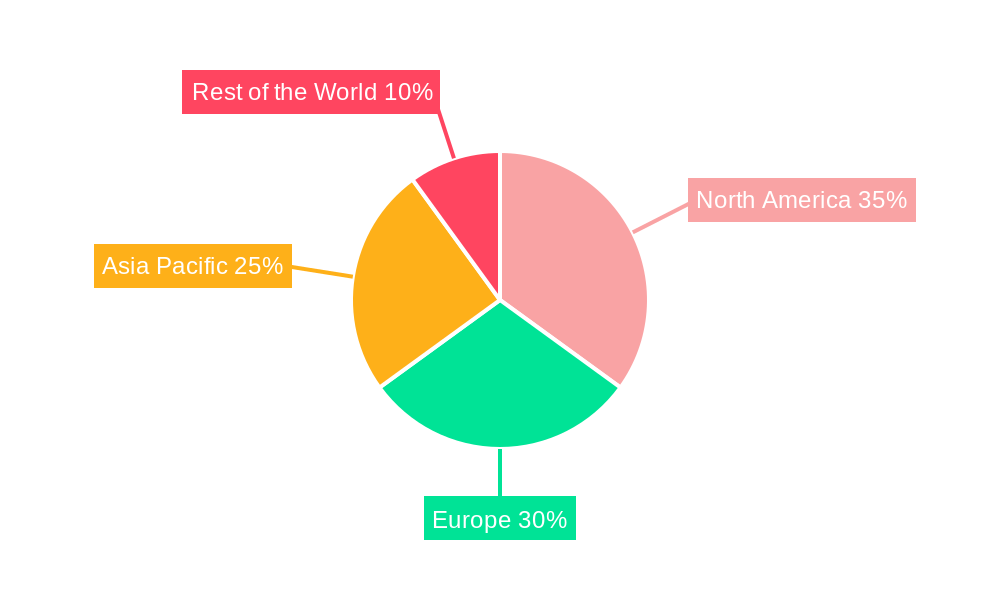
The IoV market's trajectory is further defined by emerging trends and strategic initiatives. The development of sophisticated fleet management solutions is paramount for optimizing operational costs and ensuring timely deliveries. Simultaneously, the evolution of connected car technologies, encompassing advanced driver-assistance systems (ADAS) and the eventual advent of autonomous driving, necessitates robust IoV infrastructure. While the market benefits from strong growth drivers, certain restraints, such as cybersecurity concerns and the need for standardized communication protocols, require continuous attention and resolution by industry stakeholders. Geographically, North America and Europe are expected to lead in adoption due to their established technological infrastructure and early embrace of connected mobility. However, the Asia Pacific region is anticipated to witness the fastest growth, driven by rapid urbanization, increasing vehicle ownership, and government initiatives promoting smart city development and connected transportation. As the IoV ecosystem matures, collaborative efforts between technology providers, automotive manufacturers, and regulatory bodies will be crucial to unlock its full potential and address evolving market demands.
Internet of Vehicle Industry Company Market Share
Internet of Vehicle Industry Market Dynamics & Concentration
The Internet of Vehicle (IoV) industry is characterized by a dynamic market landscape with a moderate to high level of concentration. Key players like Infineon Technologies AG, IBM Corporation, Symantec Corporation, Bosch Software Innovations GmbH, Cisco Systems Inc, Microsoft Corporation, Tesla Motors Inc, Waymo LLC (Alphabet Inc ), Oracle Corporation, General Electric Company, and SAP SE are actively shaping its trajectory. Innovation drivers are primarily technological advancements in AI, 5G connectivity, cybersecurity, and sensor technology, fueling the development of sophisticated Software Solutions such as Real-time Transit Management Systems, Security Solutions, Remote Monitoring Systems, Network Bandwidth Management, and Fleet Management. Regulatory frameworks, while evolving, are increasingly focused on data privacy, vehicle safety standards, and autonomous driving, influencing market entry and operational strategies. Product substitutes are emerging, particularly in areas like advanced driver-assistance systems (ADAS) and standalone telematics solutions, but the integrated nature of IoV solutions offers significant competitive advantages. End-user trends are shifting towards enhanced safety, improved user experience, predictive maintenance, and the creation of connected car ecosystems, driving demand for Applications like Mobility Management, Vehicle Management, and Integrated Entertainment. Mergers and acquisitions (M&A) activities are a significant feature of the IoV market, with an estimated xx M&A deals in the historical period (2019-2024) aimed at consolidating market share, acquiring new technologies, and expanding product portfolios. While specific market share data for individual companies is proprietary, the top 5 players collectively hold an estimated xx% of the market.
Internet of Vehicle Industry Industry Trends & Analysis
The Internet of Vehicle (IoV) industry is experiencing robust growth, projected to reach a market size of xx Million by 2025 and expand significantly through the 2025–2033 forecast period. This expansion is underpinned by a Compound Annual Growth Rate (CAGR) of approximately xx% during the 2019–2033 study period. A key trend is the accelerating adoption of connected car technologies, with market penetration expected to reach xx% by 2025. This surge is fueled by increasing consumer demand for advanced safety features, seamless connectivity, and personalized in-car experiences. Technological disruptions are at the forefront of this growth, with the widespread deployment of 5G networks enabling faster data transmission and supporting more complex IoV applications, including real-time diagnostics and over-the-air (OTA) updates. The integration of Artificial Intelligence (AI) and Machine Learning (ML) is revolutionizing vehicle management, predictive maintenance, and the development of autonomous driving capabilities. Consumer preferences are increasingly leaning towards integrated digital ecosystems within vehicles, mirroring their smartphone experiences. This includes sophisticated infotainment systems, advanced navigation, and personalized services that enhance both driving and passenger comfort. The competitive dynamics within the IoV market are intensifying, with traditional automotive manufacturers collaborating with technology giants like Microsoft Corporation, IBM Corporation, and Cisco Systems Inc to leverage their expertise in software, cloud computing, and cybersecurity. The rise of specialized IoV service providers and platform developers is also creating a more fragmented yet innovative competitive landscape. The Automotive and Transportation and Logistics end-user industries are the primary drivers of this market, with significant investments being made in IoV solutions to optimize operations, enhance safety, and improve efficiency. The broader adoption of smart city initiatives and the development of intelligent transportation systems are further augmenting market growth, creating a positive feedback loop for IoV technology.
Leading Markets & Segments in Internet of Vehicle Industry
The Internet of Vehicle (IoV) industry's dominance is currently concentrated in several key regions and segments, driven by distinct factors. North America and Europe represent the leading geographical markets due to advanced technological infrastructure, a high concentration of automotive manufacturers, and strong consumer adoption of connected services. Within these regions, the Automotive end-user industry holds the largest market share, driven by the increasing integration of IoV features in new vehicle models and the aftermarket segment.
Software Solutions are witnessing significant traction, with:
- Security Solutions leading the pack, due to escalating concerns over data breaches and cyber threats targeting connected vehicles. The estimated market size for security solutions is expected to reach xx Million by 2025.
- Remote Monitoring Systems are also experiencing substantial growth, driven by the need for real-time vehicle health checks, remote diagnostics, and predictive maintenance, particularly within the Transportation and Logistics sector.
- Fleet Management solutions are pivotal for commercial vehicle operators, offering enhanced efficiency, optimized routing, and improved driver safety, contributing significantly to the market's expansion. The market penetration of fleet management solutions is projected to reach xx% by 2025.
- Real-time Transit Management Systems and Network Bandwidth Management are crucial for public transportation and connected infrastructure, ensuring efficient operations and seamless data flow.
In terms of Applications:
- Vehicle Management encompasses a broad spectrum of functionalities, including diagnostics, maintenance scheduling, and performance optimization, making it a cornerstone of IoV adoption.
- Mobility Management platforms are gaining prominence, especially with the rise of shared mobility services and smart city initiatives, aiming to provide integrated and efficient transportation solutions.
- Integrated Entertainment systems are crucial for enhancing the end-user experience, driving demand for sophisticated infotainment and connectivity services within vehicles.
The Transportation and Logistics end-user industry is a major consumer of IoV solutions, leveraging them for supply chain visibility, route optimization, and fleet efficiency. The ongoing development of autonomous driving technology within the Automotive sector further amplifies the demand for robust IoV platforms. The "Others End User Industries" segment, encompassing areas like smart agriculture and connected construction equipment, is also showing promising growth potential as IoV technology finds new applications.
Internet of Vehicle Industry Product Developments
Recent product developments in the Internet of Vehicle (IoV) industry highlight a strong focus on enhancing connectivity, security, and intelligent functionalities. Companies are actively integrating advanced AI and 5G capabilities into vehicle systems to enable seamless data exchange and real-time processing. Innovations in cybersecurity solutions are crucial for protecting vehicles from cyber threats, ensuring the safety and privacy of users. Furthermore, the development of intuitive user interfaces and personalized in-car experiences is a key trend, making vehicles more of an extension of the digital lifestyle. These advancements offer significant competitive advantages by improving vehicle performance, reducing operational costs, and enhancing overall safety and convenience for end-users.
Key Drivers of Internet of Vehicle Industry Growth
Several key drivers are propelling the growth of the Internet of Vehicle (IoV) industry. Technologically, the proliferation of 5G networks is enabling faster and more reliable data transmission, crucial for advanced IoV applications. The increasing integration of AI and machine learning is enhancing vehicle intelligence, leading to improved safety and efficiency. Economically, the growing demand for connected car features and the potential for new revenue streams from data-driven services are motivating significant investments from both automotive manufacturers and technology companies. Regulatory factors, such as evolving autonomous driving mandates and data privacy regulations, are also shaping the market, creating opportunities for compliant and secure IoV solutions. The increasing adoption of smart city initiatives further supports IoV growth by creating an interconnected urban environment.
Challenges in the Internet of Vehicle Industry Market
Despite its promising growth, the Internet of Vehicle (IoV) market faces several challenges. Regulatory hurdles remain a significant concern, as inconsistent or evolving standards across different regions can impede widespread adoption and interoperability. Cybersecurity threats are a persistent challenge, with the increasing complexity of connected systems creating vulnerabilities that could compromise vehicle safety and user data. Supply chain issues, particularly concerning the availability of specialized semiconductors and components, can impact production timelines and costs. Intense competitive pressures among established players and emerging startups also necessitate continuous innovation and strategic differentiation. Furthermore, the high cost of implementing advanced IoV technologies can be a barrier for some market segments and consumers.
Emerging Opportunities in Internet of Vehicle Industry
Emerging opportunities in the Internet of Vehicle (IoV) industry are primarily driven by technological breakthroughs and strategic market expansion. The continued advancement in autonomous driving technology presents a significant growth catalyst, requiring sophisticated IoV infrastructure for navigation, communication, and safety. The development of vehicle-to-everything (V2X) communication technologies offers immense potential for enhanced traffic management, accident prevention, and the creation of smart cities. Strategic partnerships between automotive OEMs, technology providers, and telecommunication companies are crucial for fostering innovation and accelerating the deployment of new IoV services. Furthermore, the burgeoning market for connected services beyond traditional automotive applications, such as in-car commerce and personalized entertainment, represents a substantial avenue for future revenue generation and market growth.
Leading Players in the Internet of Vehicle Industry Sector
- Infineon Technologies AG
- IBM Corporation
- Symantec Corporation
- Bosch Software Innovations GmbH
- Cisco Systems Inc
- Microsoft Corporation
- Tesla Motors Inc
- Waymo LLC (Alphabet Inc )
- Oracle Corporation
- General Electric Company
- SAP SE
Key Milestones in Internet of Vehicle Industry Industry
- February 2023: Cisco Systems, Inc. announced its collaboration with Mercedes-Benz to deliver an optimized mobile office experience in new Mercedes-Benz E-Class vehicles, enhancing productivity and connectivity for drivers.
- September 2022: Bosch and Mercedes-Benz received approval for their driverless parking system for commercial use, a significant step towards broader adoption of automated driving technologies and freeing up driver time.
Strategic Outlook for Internet of Vehicle Industry Market
The strategic outlook for the Internet of Vehicle (IoV) market is exceptionally positive, characterized by accelerated growth and expanded opportunities. Key growth accelerators include the increasing demand for sophisticated in-vehicle digital experiences, the ongoing evolution of autonomous driving, and the imperative for enhanced vehicle cybersecurity. Strategic partnerships and mergers will continue to play a crucial role in consolidating market share and fostering innovation. The expansion of IoV applications into new sectors, such as smart logistics and connected public transportation, will unlock substantial market potential. The industry is poised for significant advancements in V2X communication and the integration of AI, promising to revolutionize mobility and create a more connected and efficient transportation ecosystem.
Internet of Vehicle Industry Segmentation
-
1. Software Solutions
- 1.1. Real time Transit Management System
- 1.2. Security Solution
- 1.3. Remote Monitoring System
- 1.4. Network Bandwidth Management
- 1.5. Fleet Management
-
2. Applications
- 2.1. Mobility Management
- 2.2. Vehicle Management
- 2.3. Integrated Entertainment
-
3. End-user Industry
- 3.1. Transportation and Logistics
- 3.2. Automotive
- 3.3. Others End User Industries
Internet of Vehicle Industry Segmentation By Geography
- 1. North America
- 2. Europe
- 3. Asia Pacific
- 4. Rest of the World
Internet of Vehicle Industry Regional Market Share
Geographic Coverage of Internet of Vehicle Industry
Internet of Vehicle Industry REPORT HIGHLIGHTS
| Aspects | Details |
|---|---|
| Study Period | 2020-2034 |
| Base Year | 2025 |
| Estimated Year | 2026 |
| Forecast Period | 2026-2034 |
| Historical Period | 2020-2025 |
| Growth Rate | CAGR of 16.38% from 2020-2034 |
| Segmentation |
|
Table of Contents
- 1. Introduction
- 1.1. Research Scope
- 1.2. Market Segmentation
- 1.3. Research Objective
- 1.4. Definitions and Assumptions
- 2. Executive Summary
- 2.1. Market Snapshot
- 3. Market Dynamics
- 3.1. Market Drivers
- 3.2. Market Restrains
- 3.3. Market Trends
- 3.4. Market Opportunities
- 4. Market Factor Analysis
- 4.1. Porters Five Forces
- 4.1.1. Bargaining Power of Suppliers
- 4.1.2. Bargaining Power of Buyers
- 4.1.3. Threat of New Entrants
- 4.1.4. Threat of Substitutes
- 4.1.5. Competitive Rivalry
- 4.2. PESTEL analysis
- 4.3. BCG Analysis
- 4.3.1. Stars (High Growth, High Market Share)
- 4.3.2. Cash Cows (Low Growth, High Market Share)
- 4.3.3. Question Mark (High Growth, Low Market Share)
- 4.3.4. Dogs (Low Growth, Low Market Share)
- 4.4. Ansoff Matrix Analysis
- 4.5. Supply Chain Analysis
- 4.6. Regulatory Landscape
- 4.7. Current Market Potential and Opportunity Assessment (TAM–SAM–SOM Framework)
- 4.8. MDP Analyst Note
- 4.1. Porters Five Forces
- 5. Market Analysis, Insights and Forecast 2021-2033
- 5.1. Market Analysis, Insights and Forecast - by Software Solutions
- 5.1.1. Real time Transit Management System
- 5.1.2. Security Solution
- 5.1.3. Remote Monitoring System
- 5.1.4. Network Bandwidth Management
- 5.1.5. Fleet Management
- 5.2. Market Analysis, Insights and Forecast - by Applications
- 5.2.1. Mobility Management
- 5.2.2. Vehicle Management
- 5.2.3. Integrated Entertainment
- 5.3. Market Analysis, Insights and Forecast - by End-user Industry
- 5.3.1. Transportation and Logistics
- 5.3.2. Automotive
- 5.3.3. Others End User Industries
- 5.4. Market Analysis, Insights and Forecast - by Region
- 5.4.1. North America
- 5.4.2. Europe
- 5.4.3. Asia Pacific
- 5.4.4. Rest of the World
- 5.1. Market Analysis, Insights and Forecast - by Software Solutions
- 6. Global Internet of Vehicle Industry Analysis, Insights and Forecast, 2021-2033
- 6.1. Market Analysis, Insights and Forecast - by Software Solutions
- 6.1.1. Real time Transit Management System
- 6.1.2. Security Solution
- 6.1.3. Remote Monitoring System
- 6.1.4. Network Bandwidth Management
- 6.1.5. Fleet Management
- 6.2. Market Analysis, Insights and Forecast - by Applications
- 6.2.1. Mobility Management
- 6.2.2. Vehicle Management
- 6.2.3. Integrated Entertainment
- 6.3. Market Analysis, Insights and Forecast - by End-user Industry
- 6.3.1. Transportation and Logistics
- 6.3.2. Automotive
- 6.3.3. Others End User Industries
- 6.1. Market Analysis, Insights and Forecast - by Software Solutions
- 7. North America Internet of Vehicle Industry Analysis, Insights and Forecast, 2020-2032
- 7.1. Market Analysis, Insights and Forecast - by Software Solutions
- 7.1.1. Real time Transit Management System
- 7.1.2. Security Solution
- 7.1.3. Remote Monitoring System
- 7.1.4. Network Bandwidth Management
- 7.1.5. Fleet Management
- 7.2. Market Analysis, Insights and Forecast - by Applications
- 7.2.1. Mobility Management
- 7.2.2. Vehicle Management
- 7.2.3. Integrated Entertainment
- 7.3. Market Analysis, Insights and Forecast - by End-user Industry
- 7.3.1. Transportation and Logistics
- 7.3.2. Automotive
- 7.3.3. Others End User Industries
- 7.1. Market Analysis, Insights and Forecast - by Software Solutions
- 8. Europe Internet of Vehicle Industry Analysis, Insights and Forecast, 2020-2032
- 8.1. Market Analysis, Insights and Forecast - by Software Solutions
- 8.1.1. Real time Transit Management System
- 8.1.2. Security Solution
- 8.1.3. Remote Monitoring System
- 8.1.4. Network Bandwidth Management
- 8.1.5. Fleet Management
- 8.2. Market Analysis, Insights and Forecast - by Applications
- 8.2.1. Mobility Management
- 8.2.2. Vehicle Management
- 8.2.3. Integrated Entertainment
- 8.3. Market Analysis, Insights and Forecast - by End-user Industry
- 8.3.1. Transportation and Logistics
- 8.3.2. Automotive
- 8.3.3. Others End User Industries
- 8.1. Market Analysis, Insights and Forecast - by Software Solutions
- 9. Asia Pacific Internet of Vehicle Industry Analysis, Insights and Forecast, 2020-2032
- 9.1. Market Analysis, Insights and Forecast - by Software Solutions
- 9.1.1. Real time Transit Management System
- 9.1.2. Security Solution
- 9.1.3. Remote Monitoring System
- 9.1.4. Network Bandwidth Management
- 9.1.5. Fleet Management
- 9.2. Market Analysis, Insights and Forecast - by Applications
- 9.2.1. Mobility Management
- 9.2.2. Vehicle Management
- 9.2.3. Integrated Entertainment
- 9.3. Market Analysis, Insights and Forecast - by End-user Industry
- 9.3.1. Transportation and Logistics
- 9.3.2. Automotive
- 9.3.3. Others End User Industries
- 9.1. Market Analysis, Insights and Forecast - by Software Solutions
- 10. Rest of the World Internet of Vehicle Industry Analysis, Insights and Forecast, 2020-2032
- 10.1. Market Analysis, Insights and Forecast - by Software Solutions
- 10.1.1. Real time Transit Management System
- 10.1.2. Security Solution
- 10.1.3. Remote Monitoring System
- 10.1.4. Network Bandwidth Management
- 10.1.5. Fleet Management
- 10.2. Market Analysis, Insights and Forecast - by Applications
- 10.2.1. Mobility Management
- 10.2.2. Vehicle Management
- 10.2.3. Integrated Entertainment
- 10.3. Market Analysis, Insights and Forecast - by End-user Industry
- 10.3.1. Transportation and Logistics
- 10.3.2. Automotive
- 10.3.3. Others End User Industries
- 10.1. Market Analysis, Insights and Forecast - by Software Solutions
- 11. Competitive Analysis
- 11.1. Company Profiles
- 11.1.1 Infineon Technologies AG
- 11.1.1.1. Company Overview
- 11.1.1.2. Products
- 11.1.1.3. Company Financials
- 11.1.1.4. SWOT Analysis
- 11.1.2 IBM Corporation
- 11.1.2.1. Company Overview
- 11.1.2.2. Products
- 11.1.2.3. Company Financials
- 11.1.2.4. SWOT Analysis
- 11.1.3 Symantec Corporation
- 11.1.3.1. Company Overview
- 11.1.3.2. Products
- 11.1.3.3. Company Financials
- 11.1.3.4. SWOT Analysis
- 11.1.4 Bosch Software Innovations GmbH
- 11.1.4.1. Company Overview
- 11.1.4.2. Products
- 11.1.4.3. Company Financials
- 11.1.4.4. SWOT Analysis
- 11.1.5 Cisco Systems Inc
- 11.1.5.1. Company Overview
- 11.1.5.2. Products
- 11.1.5.3. Company Financials
- 11.1.5.4. SWOT Analysis
- 11.1.6 Microsoft Corporation
- 11.1.6.1. Company Overview
- 11.1.6.2. Products
- 11.1.6.3. Company Financials
- 11.1.6.4. SWOT Analysis
- 11.1.7 Tesla Motors Inc
- 11.1.7.1. Company Overview
- 11.1.7.2. Products
- 11.1.7.3. Company Financials
- 11.1.7.4. SWOT Analysis
- 11.1.8 Waymo LLC (Alphabet Inc )
- 11.1.8.1. Company Overview
- 11.1.8.2. Products
- 11.1.8.3. Company Financials
- 11.1.8.4. SWOT Analysis
- 11.1.9 Oracle Corporation
- 11.1.9.1. Company Overview
- 11.1.9.2. Products
- 11.1.9.3. Company Financials
- 11.1.9.4. SWOT Analysis
- 11.1.10 General Electric Company
- 11.1.10.1. Company Overview
- 11.1.10.2. Products
- 11.1.10.3. Company Financials
- 11.1.10.4. SWOT Analysis
- 11.1.11 SAP SE
- 11.1.11.1. Company Overview
- 11.1.11.2. Products
- 11.1.11.3. Company Financials
- 11.1.11.4. SWOT Analysis
- 11.1.1 Infineon Technologies AG
- 11.2. Market Entropy
- 11.2.1 Company's Key Areas Served
- 11.2.2 Recent Developments
- 11.3. Company Market Share Analysis 2025
- 11.3.1 Top 5 Companies Market Share Analysis
- 11.3.2 Top 3 Companies Market Share Analysis
- 11.4. List of Potential Customers
- 12. Research Methodology
List of Figures
- Figure 1: Global Internet of Vehicle Industry Revenue Breakdown (Million, %) by Region 2025 & 2033
- Figure 2: North America Internet of Vehicle Industry Revenue (Million), by Software Solutions 2025 & 2033
- Figure 3: North America Internet of Vehicle Industry Revenue Share (%), by Software Solutions 2025 & 2033
- Figure 4: North America Internet of Vehicle Industry Revenue (Million), by Applications 2025 & 2033
- Figure 5: North America Internet of Vehicle Industry Revenue Share (%), by Applications 2025 & 2033
- Figure 6: North America Internet of Vehicle Industry Revenue (Million), by End-user Industry 2025 & 2033
- Figure 7: North America Internet of Vehicle Industry Revenue Share (%), by End-user Industry 2025 & 2033
- Figure 8: North America Internet of Vehicle Industry Revenue (Million), by Country 2025 & 2033
- Figure 9: North America Internet of Vehicle Industry Revenue Share (%), by Country 2025 & 2033
- Figure 10: Europe Internet of Vehicle Industry Revenue (Million), by Software Solutions 2025 & 2033
- Figure 11: Europe Internet of Vehicle Industry Revenue Share (%), by Software Solutions 2025 & 2033
- Figure 12: Europe Internet of Vehicle Industry Revenue (Million), by Applications 2025 & 2033
- Figure 13: Europe Internet of Vehicle Industry Revenue Share (%), by Applications 2025 & 2033
- Figure 14: Europe Internet of Vehicle Industry Revenue (Million), by End-user Industry 2025 & 2033
- Figure 15: Europe Internet of Vehicle Industry Revenue Share (%), by End-user Industry 2025 & 2033
- Figure 16: Europe Internet of Vehicle Industry Revenue (Million), by Country 2025 & 2033
- Figure 17: Europe Internet of Vehicle Industry Revenue Share (%), by Country 2025 & 2033
- Figure 18: Asia Pacific Internet of Vehicle Industry Revenue (Million), by Software Solutions 2025 & 2033
- Figure 19: Asia Pacific Internet of Vehicle Industry Revenue Share (%), by Software Solutions 2025 & 2033
- Figure 20: Asia Pacific Internet of Vehicle Industry Revenue (Million), by Applications 2025 & 2033
- Figure 21: Asia Pacific Internet of Vehicle Industry Revenue Share (%), by Applications 2025 & 2033
- Figure 22: Asia Pacific Internet of Vehicle Industry Revenue (Million), by End-user Industry 2025 & 2033
- Figure 23: Asia Pacific Internet of Vehicle Industry Revenue Share (%), by End-user Industry 2025 & 2033
- Figure 24: Asia Pacific Internet of Vehicle Industry Revenue (Million), by Country 2025 & 2033
- Figure 25: Asia Pacific Internet of Vehicle Industry Revenue Share (%), by Country 2025 & 2033
- Figure 26: Rest of the World Internet of Vehicle Industry Revenue (Million), by Software Solutions 2025 & 2033
- Figure 27: Rest of the World Internet of Vehicle Industry Revenue Share (%), by Software Solutions 2025 & 2033
- Figure 28: Rest of the World Internet of Vehicle Industry Revenue (Million), by Applications 2025 & 2033
- Figure 29: Rest of the World Internet of Vehicle Industry Revenue Share (%), by Applications 2025 & 2033
- Figure 30: Rest of the World Internet of Vehicle Industry Revenue (Million), by End-user Industry 2025 & 2033
- Figure 31: Rest of the World Internet of Vehicle Industry Revenue Share (%), by End-user Industry 2025 & 2033
- Figure 32: Rest of the World Internet of Vehicle Industry Revenue (Million), by Country 2025 & 2033
- Figure 33: Rest of the World Internet of Vehicle Industry Revenue Share (%), by Country 2025 & 2033
List of Tables
- Table 1: Global Internet of Vehicle Industry Revenue Million Forecast, by Software Solutions 2020 & 2033
- Table 2: Global Internet of Vehicle Industry Revenue Million Forecast, by Applications 2020 & 2033
- Table 3: Global Internet of Vehicle Industry Revenue Million Forecast, by End-user Industry 2020 & 2033
- Table 4: Global Internet of Vehicle Industry Revenue Million Forecast, by Region 2020 & 2033
- Table 5: Global Internet of Vehicle Industry Revenue Million Forecast, by Software Solutions 2020 & 2033
- Table 6: Global Internet of Vehicle Industry Revenue Million Forecast, by Applications 2020 & 2033
- Table 7: Global Internet of Vehicle Industry Revenue Million Forecast, by End-user Industry 2020 & 2033
- Table 8: Global Internet of Vehicle Industry Revenue Million Forecast, by Country 2020 & 2033
- Table 9: Global Internet of Vehicle Industry Revenue Million Forecast, by Software Solutions 2020 & 2033
- Table 10: Global Internet of Vehicle Industry Revenue Million Forecast, by Applications 2020 & 2033
- Table 11: Global Internet of Vehicle Industry Revenue Million Forecast, by End-user Industry 2020 & 2033
- Table 12: Global Internet of Vehicle Industry Revenue Million Forecast, by Country 2020 & 2033
- Table 13: Global Internet of Vehicle Industry Revenue Million Forecast, by Software Solutions 2020 & 2033
- Table 14: Global Internet of Vehicle Industry Revenue Million Forecast, by Applications 2020 & 2033
- Table 15: Global Internet of Vehicle Industry Revenue Million Forecast, by End-user Industry 2020 & 2033
- Table 16: Global Internet of Vehicle Industry Revenue Million Forecast, by Country 2020 & 2033
- Table 17: Global Internet of Vehicle Industry Revenue Million Forecast, by Software Solutions 2020 & 2033
- Table 18: Global Internet of Vehicle Industry Revenue Million Forecast, by Applications 2020 & 2033
- Table 19: Global Internet of Vehicle Industry Revenue Million Forecast, by End-user Industry 2020 & 2033
- Table 20: Global Internet of Vehicle Industry Revenue Million Forecast, by Country 2020 & 2033
Frequently Asked Questions
1. What is the projected Compound Annual Growth Rate (CAGR) of the Internet of Vehicle Industry?
The projected CAGR is approximately 16.38%.
2. Which companies are prominent players in the Internet of Vehicle Industry?
Key companies in the market include Infineon Technologies AG, IBM Corporation, Symantec Corporation, Bosch Software Innovations GmbH, Cisco Systems Inc, Microsoft Corporation, Tesla Motors Inc, Waymo LLC (Alphabet Inc ), Oracle Corporation, General Electric Company, SAP SE.
3. What are the main segments of the Internet of Vehicle Industry?
The market segments include Software Solutions, Applications, End-user Industry.
4. Can you provide details about the market size?
The market size is estimated to be USD 161.51 Million as of 2022.
5. What are some drivers contributing to market growth?
Increased Government Funding and Investments in Connected Transport System; Growing Demand for Smart Applications in Cars.
6. What are the notable trends driving market growth?
Automotive Sector to Witness the Growth.
7. Are there any restraints impacting market growth?
Slower Rate of Penetration of Connected Systems across the Developing Economies; High Initial Cost of Smart Transportation System.
8. Can you provide examples of recent developments in the market?
February 2023 - Cisco Systems, Inc has announced it is working with Mercedes-Benz to provide an optimal mobile office experience in its new Mercedes-Benz E Class vehicles. Where the partnership will help people get work done safely, securely, and comfortably in their cars, with the modern luxury and intuitive features that Mercedes-Benz and Webex customers are accustomed to
9. What pricing options are available for accessing the report?
Pricing options include single-user, multi-user, and enterprise licenses priced at USD 4750, USD 5250, and USD 8750 respectively.
10. Is the market size provided in terms of value or volume?
The market size is provided in terms of value, measured in Million.
11. Are there any specific market keywords associated with the report?
Yes, the market keyword associated with the report is "Internet of Vehicle Industry," which aids in identifying and referencing the specific market segment covered.
12. How do I determine which pricing option suits my needs best?
The pricing options vary based on user requirements and access needs. Individual users may opt for single-user licenses, while businesses requiring broader access may choose multi-user or enterprise licenses for cost-effective access to the report.
13. Are there any additional resources or data provided in the Internet of Vehicle Industry report?
While the report offers comprehensive insights, it's advisable to review the specific contents or supplementary materials provided to ascertain if additional resources or data are available.
14. How can I stay updated on further developments or reports in the Internet of Vehicle Industry?
To stay informed about further developments, trends, and reports in the Internet of Vehicle Industry, consider subscribing to industry newsletters, following relevant companies and organizations, or regularly checking reputable industry news sources and publications.
Methodology
Step 1 - Identification of Relevant Samples Size from Population Database


Step 2 - Approaches for Defining Global Market Size (Value, Volume* & Price*)

Note*: In applicable scenarios
Step 3 - Data Sources
Primary Research
- Web Analytics
- Survey Reports
- Research Institute
- Latest Research Reports
- Opinion Leaders
Secondary Research
- Annual Reports
- White Paper
- Latest Press Release
- Industry Association
- Paid Database
- Investor Presentations

Step 4 - Data Triangulation
Involves using different sources of information in order to increase the validity of a study
These sources are likely to be stakeholders in a program - participants, other researchers, program staff, other community members, and so on.
Then we put all data in single framework & apply various statistical tools to find out the dynamic on the market.
During the analysis stage, feedback from the stakeholder groups would be compared to determine areas of agreement as well as areas of divergence