

Key Insights
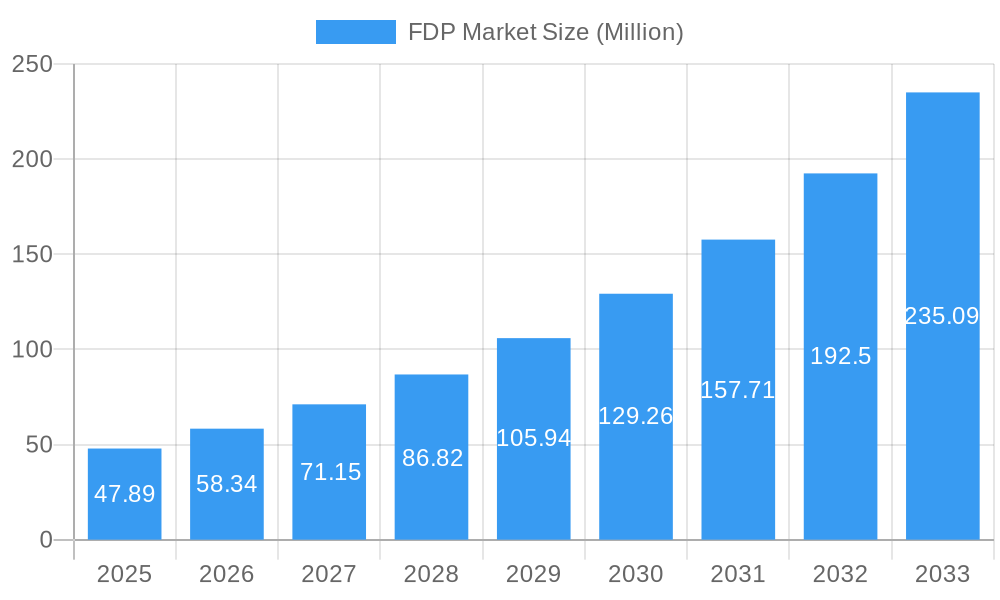
The Fraud Detection and Prevention (FDP) market is poised for substantial expansion, projected to reach a valuation of $47.89 million by 2025, with an impressive Compound Annual Growth Rate (CAGR) of 21.48% expected to propel it further through 2033. This robust growth is primarily fueled by the escalating sophistication and prevalence of fraudulent activities across various sectors. Key drivers include the increasing adoption of advanced analytics for real-time fraud detection, the critical need for robust authentication mechanisms to secure digital transactions, and the growing demand for comprehensive reporting and visualization tools to understand and combat fraud patterns. Furthermore, the imperative for strong Governance, Risk, and Compliance (GRC) solutions is a significant catalyst, as organizations strive to meet regulatory requirements and safeguard their reputation. The market is characterized by a dynamic landscape, with technological advancements and evolving fraud tactics constantly shaping its trajectory.
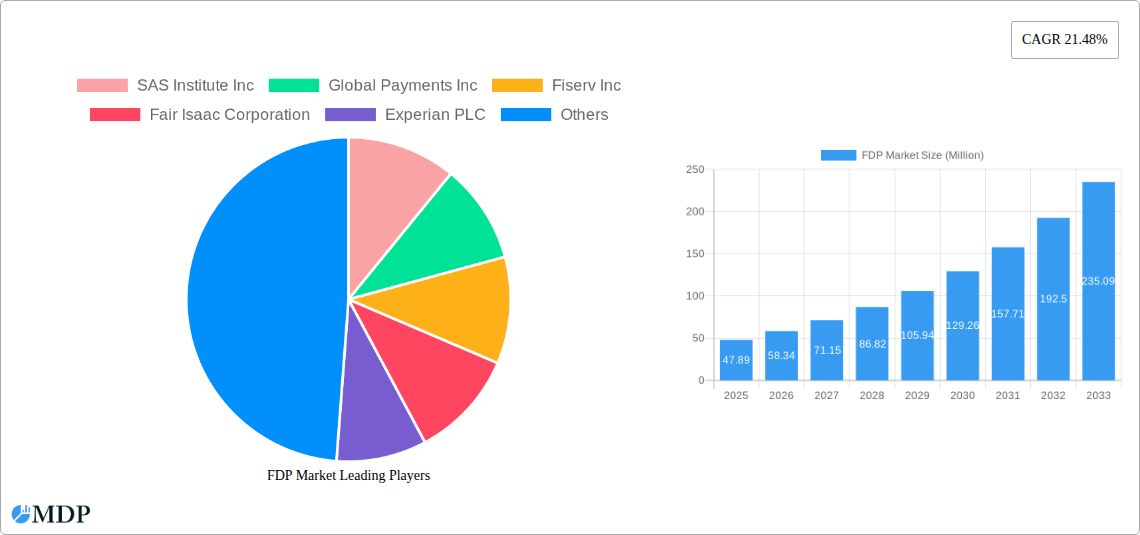
FDP Market Market Size (In Million)
The FDP market encompasses a diverse range of solutions tailored to address both internal and external fraud threats. Fraud Analytics, Authentication, Reporting, Visualization, and GRC Solutions are prominent segments. The adoption of these solutions spans across small, medium, and large-scale enterprises, indicating a broad market penetration. Key end-user industries driving this demand include the BFSI sector, which is continuously targeted by financial fraud, followed closely by Retail, IT and Telecom, Healthcare, Energy and Power, and Manufacturing. Emerging economies are expected to contribute significantly to market growth, driven by increasing digitalization and a corresponding rise in cyber threats. While the market presents immense opportunities, potential restraints such as high implementation costs and a shortage of skilled professionals in fraud analytics could pose challenges. However, the continuous innovation by leading companies like SAS Institute Inc., Fiserv Inc., Fair Isaac Corporation, and Experian PLC is expected to mitigate these challenges and sustain the market's upward momentum.
FDP Market Company Market Share
This comprehensive FDP Market report offers an in-depth analysis of the Fraud Detection and Prevention Market, a critical sector safeguarding financial transactions and digital assets. Covering the extensive period from 2019 to 2033, with a base year of 2025, this study provides invaluable insights for industry stakeholders, investors, and decision-makers navigating the evolving landscape of fraud management. The report dissects market dynamics, key industry trends, leading segments, product developments, growth drivers, challenges, and emerging opportunities, culminating in a strategic outlook for the FDP market. With an estimated market size of over 100 Million in 2025, this report delves into the strategies of key players and chronicles significant industry milestones.
FDP Market Market Dynamics & Concentration
The FDP Market is characterized by dynamic growth and a moderately concentrated competitive landscape. Innovation is the primary driver, fueled by the escalating sophistication of fraudulent activities and the continuous development of advanced analytics, machine learning, and AI-powered solutions. Regulatory frameworks, such as GDPR and various financial crime compliance mandates, are shaping market strategies, pushing for enhanced data privacy and security measures. Product substitutes, though evolving, primarily revolve around manual detection methods and basic security protocols, which are increasingly being outpaced by specialized FDP solutions. End-user trends indicate a growing demand for real-time fraud detection and seamless integration across diverse platforms. Mergers and acquisitions (M&A) activities, though not consistently high in deal counts, are strategically focused on consolidating market share and acquiring innovative technologies. For instance, a key M&A trend involves larger IT service providers acquiring specialized fraud analytics firms to bolster their cybersecurity offerings. The market share of leading vendors is significant, with the top five players estimated to hold over 60% of the market in 2025, while ongoing consolidation efforts indicate a trend towards further market maturation.
FDP Market Industry Trends & Analysis
The FDP Market is poised for substantial growth, driven by a confluence of escalating cyber threats, increased digitization of financial services, and the imperative for robust security across all industries. The projected Compound Annual Growth Rate (CAGR) for the FDP Market is robust, estimated at 15% between 2025 and 2033. This growth is underpinned by several key trends. Firstly, the widespread adoption of Artificial Intelligence (AI) and Machine Learning (ML) algorithms is revolutionizing fraud detection capabilities, enabling proactive identification of anomalies and predictive risk assessment. Secondly, the rise of real-time transaction monitoring and analytics is becoming a non-negotiable requirement for businesses, as delayed detection can lead to significant financial losses and reputational damage. Thirdly, the increasing complexity of fraud schemes, including sophisticated phishing, account takeover, and synthetic identity fraud, necessitates continuous innovation in FDP solutions. Consumer preferences are also shifting, with individuals expecting more secure and frictionless digital experiences, putting pressure on businesses to invest in advanced fraud prevention measures. Competitive dynamics are intense, with established players and emerging startups vying for market dominance through product differentiation, strategic partnerships, and enhanced customer support. The market penetration of advanced FDP solutions is expected to rise significantly, particularly within the BFSI and retail sectors, as these industries are prime targets for fraudulent activities. The development of interoperable FDP platforms that can seamlessly integrate with existing IT infrastructures is also a key trend, facilitating wider adoption and operational efficiency.
Leading Markets & Segments in FDP Market
The FDP Market is segmented across various dimensions, each exhibiting distinct growth trajectories and dominance. The BFSI (Banking, Financial Services, and Insurance) sector is the most dominant end-user industry, accounting for an estimated 45% of the market share in 2025, driven by the high volume of sensitive financial transactions and the severe consequences of financial fraud. Within the solution segment, Fraud Analytics leads, with an estimated market share of 30% in 2025, due to its crucial role in identifying complex fraud patterns. Authentication solutions follow closely, essential for verifying user identities and preventing unauthorized access. The Large-scale end-user segment also commands a significant market share, estimated at 55% in 2025, owing to the substantial fraud volumes and sophisticated threat landscapes faced by large enterprises. External fraud is the primary type of fraud addressed by FDP solutions, representing an estimated 70% of the market focus. Geographically, North America is projected to be the leading market, driven by early adoption of advanced technologies and stringent regulatory environments. Key drivers for dominance in these segments include:
- BFSI Dominance:
- High volume of sensitive financial transactions.
- Severe financial and reputational repercussions of fraud.
- Stringent regulatory compliance requirements.
- Fraud Analytics Leadership:
- Increasing sophistication of fraud schemes.
- Need for advanced predictive and real-time analysis.
- Leveraging AI and machine learning for pattern recognition.
- Large-scale User Segment Growth:
- Greater exposure to diverse and complex fraud attacks.
- Higher financial capacity for investing in advanced FDP solutions.
- Demand for scalable and comprehensive fraud management systems.
- External Fraud Focus:
- Prevalence of cyberattacks, account takeovers, and payment fraud.
- Need to protect customer data and financial assets from external threats.
FDP Market Product Developments
Product development in the FDP market is characterized by a relentless pursuit of enhanced accuracy, real-time processing, and seamless integration. Innovations are heavily focused on leveraging advanced AI and ML algorithms for predictive fraud detection, anomaly identification, and behavioral biometrics to enhance authentication. Companies are developing sophisticated fraud analytics platforms that can process massive datasets in real-time, offering immediate insights and enabling swift intervention. The trend towards unified fraud management solutions that consolidate various detection and prevention tools under a single umbrella is gaining traction, simplifying operations and improving overall security posture. Furthermore, there is a growing emphasis on developing explainable AI (XAI) capabilities within FDP solutions, allowing businesses to understand the rationale behind fraud alerts, thereby improving trust and operational efficiency.
Key Drivers of FDP Market Growth
The FDP Market is propelled by a powerful combination of factors. The ever-increasing volume and sophistication of cyber threats globally necessitate robust fraud detection and prevention mechanisms. Escalating digital transactions across various sectors, from e-commerce to mobile banking, present more opportunities for fraudsters, thus driving demand for advanced FDP solutions. Furthermore, stringent regulatory compliance mandates worldwide, such as those related to anti-money laundering (AML) and Know Your Customer (KYC) regulations, compel organizations to invest in comprehensive fraud management systems. The proactive adoption of AI and Machine Learning technologies by businesses to enhance fraud detection accuracy and efficiency is also a significant growth driver. Finally, the growing awareness among consumers and businesses about the financial and reputational risks associated with fraud is fostering a proactive approach to security.
Challenges in the FDP Market Market
Despite robust growth, the FDP Market faces several challenges. The rapidly evolving nature of fraud tactics necessitates continuous adaptation and innovation, which can be resource-intensive for FDP vendors. The sheer volume of data that needs to be processed and analyzed in real-time to detect sophisticated fraud schemes poses significant technical and operational hurdles. Integrating new FDP solutions with legacy IT systems within organizations can be complex and costly, leading to implementation delays. Furthermore, the scarcity of skilled professionals with expertise in data science, cybersecurity, and fraud analytics can hinder the effective deployment and management of these solutions. Lastly, concerns around data privacy and compliance with various global regulations add another layer of complexity for FDP providers.
Emerging Opportunities in FDP Market
The FDP Market is ripe with emerging opportunities, primarily driven by technological advancements and evolving market demands. The expansion of cloud-based FDP solutions offers scalability, flexibility, and cost-effectiveness, particularly for small and medium-sized businesses. The growing adoption of IoT devices and the increasing volume of data generated by them present a new frontier for fraud detection, requiring specialized FDP strategies. Strategic partnerships between FDP providers and cybersecurity firms, as well as financial institutions, are creating opportunities for integrated and comprehensive security offerings. Furthermore, the untapped potential in emerging economies, where digital transformation is rapidly accelerating, presents a significant market expansion opportunity for FDP solutions. The development of specialized FDP solutions for niche industries and specific fraud types will also drive future growth.
Leading Players in the FDP Market Sector
- SAS Institute Inc
- Global Payments Inc
- Fiserv Inc
- Fair Isaac Corporation
- Experian PLC
- IBM Corporation
- RSA Security LLC (Dell Technologies Inc)
- BAE Systems PLC
- Feedzai Inc
- NICE Ltd
- DXC Technology Company
- Oracle Corporation
- Equifax Inc
- ACI Worldwide Inc
- LexisNexis Group
- Cybersource Corporation
- SAP SE
Key Milestones in FDP Market Industry
- October 2023: Nymcard, a prominent card issuer in the MENA region, partnered with ACI Worldwide to enhance its fraud platform and bolster protection against escalating financial fraud.
- September 2023: Mastercard and Oracle collaborated to automate B2B payments, addressing challenges in commercial payments through disparate systems. This partnership leverages Mastercard's virtual card technology to securely connect trading parties, simplifying transactions and increasing fraud protection for corporate customers.
Strategic Outlook for FDP Market Market
The strategic outlook for the FDP Market remains exceptionally positive, driven by the persistent and evolving nature of fraud. Future growth will be accelerated by the continued integration of AI and ML for more proactive and predictive fraud detection, alongside advancements in real-time analytics. The increasing demand for integrated security platforms that offer end-to-end fraud management will spur innovation and strategic partnerships. The market will also witness a greater focus on cloud-native FDP solutions, catering to the growing need for scalability and agility. Furthermore, as emerging economies embrace digital transformation, the expansion of FDP services into these regions represents a significant long-term opportunity, promising sustained growth and market evolution.
FDP Market Segmentation
-
1. Solution
- 1.1. Fraud Analytics
- 1.2. Authentication
- 1.3. Reporting
- 1.4. Visualization
- 1.5. Governance, Risk, and Compliance (GRC) Solutions
-
2. Scale of End User
- 2.1. Small-scale
- 2.2. Medium-scale
- 2.3. Large-scale
-
3. Type of Fraud
- 3.1. Internal
- 3.2. External
-
4. End-user Industry
- 4.1. BFSI
- 4.2. Retail
- 4.3. IT and Telecom
- 4.4. Healthcare
- 4.5. Energy and Power
- 4.6. Manufacturing
- 4.7. Other End-user Industries
FDP Market Segmentation By Geography
- 1. North America
- 2. Europe
- 3. Asia
- 4. Australia and New Zealand
- 5. Latin America
- 6. Middle East and Africa
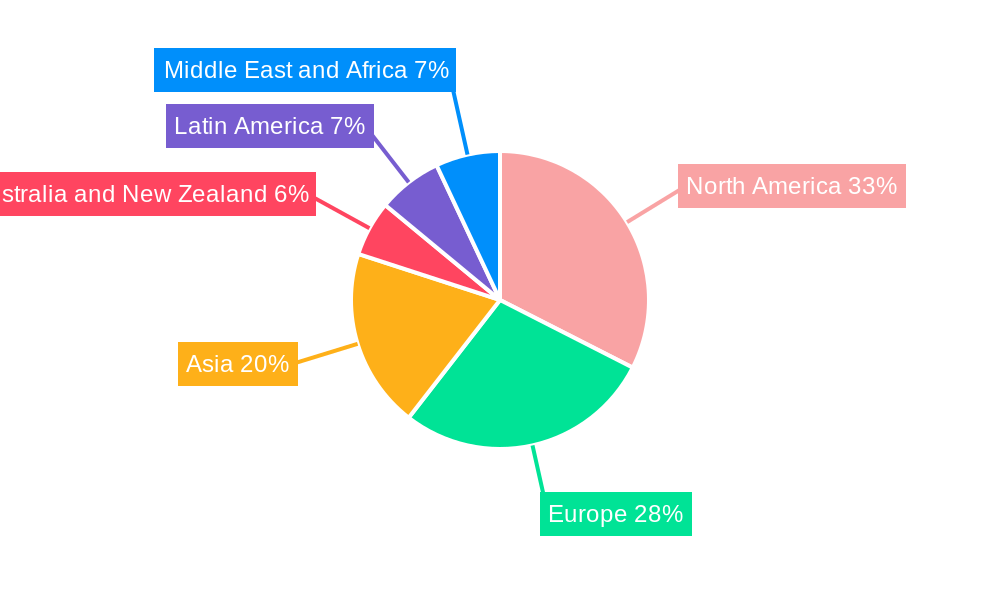
FDP Market Regional Market Share
Geographic Coverage of FDP Market
FDP Market REPORT HIGHLIGHTS
| Aspects | Details |
|---|---|
| Study Period | 2020-2034 |
| Base Year | 2025 |
| Estimated Year | 2026 |
| Forecast Period | 2026-2034 |
| Historical Period | 2020-2025 |
| Growth Rate | CAGR of 21.48% from 2020-2034 |
| Segmentation |
|
Table of Contents
- 1. Introduction
- 1.1. Research Scope
- 1.2. Market Segmentation
- 1.3. Research Methodology
- 1.4. Definitions and Assumptions
- 2. Executive Summary
- 2.1. Introduction
- 3. Market Dynamics
- 3.1. Introduction
- 3.2. Market Drivers
- 3.2.1. Increasing Volume of Non-cash Payment/transaction; Increasing Frauds in BFSI Sector
- 3.3. Market Restrains
- 3.3.1. Lack of Integration Capability with All Verticals
- 3.4. Market Trends
- 3.4.1. BFSI Sector to be the Largest End-user Industry
- 4. Market Factor Analysis
- 4.1. Porters Five Forces
- 4.2. Supply/Value Chain
- 4.3. PESTEL analysis
- 4.4. Market Entropy
- 4.5. Patent/Trademark Analysis
- 5. Global FDP Market Analysis, Insights and Forecast, 2020-2032
- 5.1. Market Analysis, Insights and Forecast - by Solution
- 5.1.1. Fraud Analytics
- 5.1.2. Authentication
- 5.1.3. Reporting
- 5.1.4. Visualization
- 5.1.5. Governance, Risk, and Compliance (GRC) Solutions
- 5.2. Market Analysis, Insights and Forecast - by Scale of End User
- 5.2.1. Small-scale
- 5.2.2. Medium-scale
- 5.2.3. Large-scale
- 5.3. Market Analysis, Insights and Forecast - by Type of Fraud
- 5.3.1. Internal
- 5.3.2. External
- 5.4. Market Analysis, Insights and Forecast - by End-user Industry
- 5.4.1. BFSI
- 5.4.2. Retail
- 5.4.3. IT and Telecom
- 5.4.4. Healthcare
- 5.4.5. Energy and Power
- 5.4.6. Manufacturing
- 5.4.7. Other End-user Industries
- 5.5. Market Analysis, Insights and Forecast - by Region
- 5.5.1. North America
- 5.5.2. Europe
- 5.5.3. Asia
- 5.5.4. Australia and New Zealand
- 5.5.5. Latin America
- 5.5.6. Middle East and Africa
- 5.1. Market Analysis, Insights and Forecast - by Solution
- 6. North America FDP Market Analysis, Insights and Forecast, 2020-2032
- 6.1. Market Analysis, Insights and Forecast - by Solution
- 6.1.1. Fraud Analytics
- 6.1.2. Authentication
- 6.1.3. Reporting
- 6.1.4. Visualization
- 6.1.5. Governance, Risk, and Compliance (GRC) Solutions
- 6.2. Market Analysis, Insights and Forecast - by Scale of End User
- 6.2.1. Small-scale
- 6.2.2. Medium-scale
- 6.2.3. Large-scale
- 6.3. Market Analysis, Insights and Forecast - by Type of Fraud
- 6.3.1. Internal
- 6.3.2. External
- 6.4. Market Analysis, Insights and Forecast - by End-user Industry
- 6.4.1. BFSI
- 6.4.2. Retail
- 6.4.3. IT and Telecom
- 6.4.4. Healthcare
- 6.4.5. Energy and Power
- 6.4.6. Manufacturing
- 6.4.7. Other End-user Industries
- 6.1. Market Analysis, Insights and Forecast - by Solution
- 7. Europe FDP Market Analysis, Insights and Forecast, 2020-2032
- 7.1. Market Analysis, Insights and Forecast - by Solution
- 7.1.1. Fraud Analytics
- 7.1.2. Authentication
- 7.1.3. Reporting
- 7.1.4. Visualization
- 7.1.5. Governance, Risk, and Compliance (GRC) Solutions
- 7.2. Market Analysis, Insights and Forecast - by Scale of End User
- 7.2.1. Small-scale
- 7.2.2. Medium-scale
- 7.2.3. Large-scale
- 7.3. Market Analysis, Insights and Forecast - by Type of Fraud
- 7.3.1. Internal
- 7.3.2. External
- 7.4. Market Analysis, Insights and Forecast - by End-user Industry
- 7.4.1. BFSI
- 7.4.2. Retail
- 7.4.3. IT and Telecom
- 7.4.4. Healthcare
- 7.4.5. Energy and Power
- 7.4.6. Manufacturing
- 7.4.7. Other End-user Industries
- 7.1. Market Analysis, Insights and Forecast - by Solution
- 8. Asia FDP Market Analysis, Insights and Forecast, 2020-2032
- 8.1. Market Analysis, Insights and Forecast - by Solution
- 8.1.1. Fraud Analytics
- 8.1.2. Authentication
- 8.1.3. Reporting
- 8.1.4. Visualization
- 8.1.5. Governance, Risk, and Compliance (GRC) Solutions
- 8.2. Market Analysis, Insights and Forecast - by Scale of End User
- 8.2.1. Small-scale
- 8.2.2. Medium-scale
- 8.2.3. Large-scale
- 8.3. Market Analysis, Insights and Forecast - by Type of Fraud
- 8.3.1. Internal
- 8.3.2. External
- 8.4. Market Analysis, Insights and Forecast - by End-user Industry
- 8.4.1. BFSI
- 8.4.2. Retail
- 8.4.3. IT and Telecom
- 8.4.4. Healthcare
- 8.4.5. Energy and Power
- 8.4.6. Manufacturing
- 8.4.7. Other End-user Industries
- 8.1. Market Analysis, Insights and Forecast - by Solution
- 9. Australia and New Zealand FDP Market Analysis, Insights and Forecast, 2020-2032
- 9.1. Market Analysis, Insights and Forecast - by Solution
- 9.1.1. Fraud Analytics
- 9.1.2. Authentication
- 9.1.3. Reporting
- 9.1.4. Visualization
- 9.1.5. Governance, Risk, and Compliance (GRC) Solutions
- 9.2. Market Analysis, Insights and Forecast - by Scale of End User
- 9.2.1. Small-scale
- 9.2.2. Medium-scale
- 9.2.3. Large-scale
- 9.3. Market Analysis, Insights and Forecast - by Type of Fraud
- 9.3.1. Internal
- 9.3.2. External
- 9.4. Market Analysis, Insights and Forecast - by End-user Industry
- 9.4.1. BFSI
- 9.4.2. Retail
- 9.4.3. IT and Telecom
- 9.4.4. Healthcare
- 9.4.5. Energy and Power
- 9.4.6. Manufacturing
- 9.4.7. Other End-user Industries
- 9.1. Market Analysis, Insights and Forecast - by Solution
- 10. Latin America FDP Market Analysis, Insights and Forecast, 2020-2032
- 10.1. Market Analysis, Insights and Forecast - by Solution
- 10.1.1. Fraud Analytics
- 10.1.2. Authentication
- 10.1.3. Reporting
- 10.1.4. Visualization
- 10.1.5. Governance, Risk, and Compliance (GRC) Solutions
- 10.2. Market Analysis, Insights and Forecast - by Scale of End User
- 10.2.1. Small-scale
- 10.2.2. Medium-scale
- 10.2.3. Large-scale
- 10.3. Market Analysis, Insights and Forecast - by Type of Fraud
- 10.3.1. Internal
- 10.3.2. External
- 10.4. Market Analysis, Insights and Forecast - by End-user Industry
- 10.4.1. BFSI
- 10.4.2. Retail
- 10.4.3. IT and Telecom
- 10.4.4. Healthcare
- 10.4.5. Energy and Power
- 10.4.6. Manufacturing
- 10.4.7. Other End-user Industries
- 10.1. Market Analysis, Insights and Forecast - by Solution
- 11. Middle East and Africa FDP Market Analysis, Insights and Forecast, 2020-2032
- 11.1. Market Analysis, Insights and Forecast - by Solution
- 11.1.1. Fraud Analytics
- 11.1.2. Authentication
- 11.1.3. Reporting
- 11.1.4. Visualization
- 11.1.5. Governance, Risk, and Compliance (GRC) Solutions
- 11.2. Market Analysis, Insights and Forecast - by Scale of End User
- 11.2.1. Small-scale
- 11.2.2. Medium-scale
- 11.2.3. Large-scale
- 11.3. Market Analysis, Insights and Forecast - by Type of Fraud
- 11.3.1. Internal
- 11.3.2. External
- 11.4. Market Analysis, Insights and Forecast - by End-user Industry
- 11.4.1. BFSI
- 11.4.2. Retail
- 11.4.3. IT and Telecom
- 11.4.4. Healthcare
- 11.4.5. Energy and Power
- 11.4.6. Manufacturing
- 11.4.7. Other End-user Industries
- 11.1. Market Analysis, Insights and Forecast - by Solution
- 12. Competitive Analysis
- 12.1. Global Market Share Analysis 2025
- 12.2. Company Profiles
- 12.2.1 SAS Institute Inc
- 12.2.1.1. Overview
- 12.2.1.2. Products
- 12.2.1.3. SWOT Analysis
- 12.2.1.4. Recent Developments
- 12.2.1.5. Financials (Based on Availability)
- 12.2.2 Global Payments Inc
- 12.2.2.1. Overview
- 12.2.2.2. Products
- 12.2.2.3. SWOT Analysis
- 12.2.2.4. Recent Developments
- 12.2.2.5. Financials (Based on Availability)
- 12.2.3 Fiserv Inc
- 12.2.3.1. Overview
- 12.2.3.2. Products
- 12.2.3.3. SWOT Analysis
- 12.2.3.4. Recent Developments
- 12.2.3.5. Financials (Based on Availability)
- 12.2.4 Fair Isaac Corporation
- 12.2.4.1. Overview
- 12.2.4.2. Products
- 12.2.4.3. SWOT Analysis
- 12.2.4.4. Recent Developments
- 12.2.4.5. Financials (Based on Availability)
- 12.2.5 Experian PLC
- 12.2.5.1. Overview
- 12.2.5.2. Products
- 12.2.5.3. SWOT Analysis
- 12.2.5.4. Recent Developments
- 12.2.5.5. Financials (Based on Availability)
- 12.2.6 IBM Corporation
- 12.2.6.1. Overview
- 12.2.6.2. Products
- 12.2.6.3. SWOT Analysis
- 12.2.6.4. Recent Developments
- 12.2.6.5. Financials (Based on Availability)
- 12.2.7 RSA Security LLC (Dell Technologies Inc )
- 12.2.7.1. Overview
- 12.2.7.2. Products
- 12.2.7.3. SWOT Analysis
- 12.2.7.4. Recent Developments
- 12.2.7.5. Financials (Based on Availability)
- 12.2.8 BAE Systems PLC
- 12.2.8.1. Overview
- 12.2.8.2. Products
- 12.2.8.3. SWOT Analysis
- 12.2.8.4. Recent Developments
- 12.2.8.5. Financials (Based on Availability)
- 12.2.9 Feedzai Inc
- 12.2.9.1. Overview
- 12.2.9.2. Products
- 12.2.9.3. SWOT Analysis
- 12.2.9.4. Recent Developments
- 12.2.9.5. Financials (Based on Availability)
- 12.2.10 NICE Ltd
- 12.2.10.1. Overview
- 12.2.10.2. Products
- 12.2.10.3. SWOT Analysis
- 12.2.10.4. Recent Developments
- 12.2.10.5. Financials (Based on Availability)
- 12.2.11 DXC Technology Company
- 12.2.11.1. Overview
- 12.2.11.2. Products
- 12.2.11.3. SWOT Analysis
- 12.2.11.4. Recent Developments
- 12.2.11.5. Financials (Based on Availability)
- 12.2.12 Oracle Corporation
- 12.2.12.1. Overview
- 12.2.12.2. Products
- 12.2.12.3. SWOT Analysis
- 12.2.12.4. Recent Developments
- 12.2.12.5. Financials (Based on Availability)
- 12.2.13 Equifax Inc
- 12.2.13.1. Overview
- 12.2.13.2. Products
- 12.2.13.3. SWOT Analysis
- 12.2.13.4. Recent Developments
- 12.2.13.5. Financials (Based on Availability)
- 12.2.14 ACI Worldwide Inc
- 12.2.14.1. Overview
- 12.2.14.2. Products
- 12.2.14.3. SWOT Analysis
- 12.2.14.4. Recent Developments
- 12.2.14.5. Financials (Based on Availability)
- 12.2.15 LexisNexis Group
- 12.2.15.1. Overview
- 12.2.15.2. Products
- 12.2.15.3. SWOT Analysis
- 12.2.15.4. Recent Developments
- 12.2.15.5. Financials (Based on Availability)
- 12.2.16 Cybersource Corporation
- 12.2.16.1. Overview
- 12.2.16.2. Products
- 12.2.16.3. SWOT Analysis
- 12.2.16.4. Recent Developments
- 12.2.16.5. Financials (Based on Availability)
- 12.2.17 SAP SE
- 12.2.17.1. Overview
- 12.2.17.2. Products
- 12.2.17.3. SWOT Analysis
- 12.2.17.4. Recent Developments
- 12.2.17.5. Financials (Based on Availability)
- 12.2.1 SAS Institute Inc
List of Figures
- Figure 1: Global FDP Market Revenue Breakdown (Million, %) by Region 2025 & 2033
- Figure 2: North America FDP Market Revenue (Million), by Solution 2025 & 2033
- Figure 3: North America FDP Market Revenue Share (%), by Solution 2025 & 2033
- Figure 4: North America FDP Market Revenue (Million), by Scale of End User 2025 & 2033
- Figure 5: North America FDP Market Revenue Share (%), by Scale of End User 2025 & 2033
- Figure 6: North America FDP Market Revenue (Million), by Type of Fraud 2025 & 2033
- Figure 7: North America FDP Market Revenue Share (%), by Type of Fraud 2025 & 2033
- Figure 8: North America FDP Market Revenue (Million), by End-user Industry 2025 & 2033
- Figure 9: North America FDP Market Revenue Share (%), by End-user Industry 2025 & 2033
- Figure 10: North America FDP Market Revenue (Million), by Country 2025 & 2033
- Figure 11: North America FDP Market Revenue Share (%), by Country 2025 & 2033
- Figure 12: Europe FDP Market Revenue (Million), by Solution 2025 & 2033
- Figure 13: Europe FDP Market Revenue Share (%), by Solution 2025 & 2033
- Figure 14: Europe FDP Market Revenue (Million), by Scale of End User 2025 & 2033
- Figure 15: Europe FDP Market Revenue Share (%), by Scale of End User 2025 & 2033
- Figure 16: Europe FDP Market Revenue (Million), by Type of Fraud 2025 & 2033
- Figure 17: Europe FDP Market Revenue Share (%), by Type of Fraud 2025 & 2033
- Figure 18: Europe FDP Market Revenue (Million), by End-user Industry 2025 & 2033
- Figure 19: Europe FDP Market Revenue Share (%), by End-user Industry 2025 & 2033
- Figure 20: Europe FDP Market Revenue (Million), by Country 2025 & 2033
- Figure 21: Europe FDP Market Revenue Share (%), by Country 2025 & 2033
- Figure 22: Asia FDP Market Revenue (Million), by Solution 2025 & 2033
- Figure 23: Asia FDP Market Revenue Share (%), by Solution 2025 & 2033
- Figure 24: Asia FDP Market Revenue (Million), by Scale of End User 2025 & 2033
- Figure 25: Asia FDP Market Revenue Share (%), by Scale of End User 2025 & 2033
- Figure 26: Asia FDP Market Revenue (Million), by Type of Fraud 2025 & 2033
- Figure 27: Asia FDP Market Revenue Share (%), by Type of Fraud 2025 & 2033
- Figure 28: Asia FDP Market Revenue (Million), by End-user Industry 2025 & 2033
- Figure 29: Asia FDP Market Revenue Share (%), by End-user Industry 2025 & 2033
- Figure 30: Asia FDP Market Revenue (Million), by Country 2025 & 2033
- Figure 31: Asia FDP Market Revenue Share (%), by Country 2025 & 2033
- Figure 32: Australia and New Zealand FDP Market Revenue (Million), by Solution 2025 & 2033
- Figure 33: Australia and New Zealand FDP Market Revenue Share (%), by Solution 2025 & 2033
- Figure 34: Australia and New Zealand FDP Market Revenue (Million), by Scale of End User 2025 & 2033
- Figure 35: Australia and New Zealand FDP Market Revenue Share (%), by Scale of End User 2025 & 2033
- Figure 36: Australia and New Zealand FDP Market Revenue (Million), by Type of Fraud 2025 & 2033
- Figure 37: Australia and New Zealand FDP Market Revenue Share (%), by Type of Fraud 2025 & 2033
- Figure 38: Australia and New Zealand FDP Market Revenue (Million), by End-user Industry 2025 & 2033
- Figure 39: Australia and New Zealand FDP Market Revenue Share (%), by End-user Industry 2025 & 2033
- Figure 40: Australia and New Zealand FDP Market Revenue (Million), by Country 2025 & 2033
- Figure 41: Australia and New Zealand FDP Market Revenue Share (%), by Country 2025 & 2033
- Figure 42: Latin America FDP Market Revenue (Million), by Solution 2025 & 2033
- Figure 43: Latin America FDP Market Revenue Share (%), by Solution 2025 & 2033
- Figure 44: Latin America FDP Market Revenue (Million), by Scale of End User 2025 & 2033
- Figure 45: Latin America FDP Market Revenue Share (%), by Scale of End User 2025 & 2033
- Figure 46: Latin America FDP Market Revenue (Million), by Type of Fraud 2025 & 2033
- Figure 47: Latin America FDP Market Revenue Share (%), by Type of Fraud 2025 & 2033
- Figure 48: Latin America FDP Market Revenue (Million), by End-user Industry 2025 & 2033
- Figure 49: Latin America FDP Market Revenue Share (%), by End-user Industry 2025 & 2033
- Figure 50: Latin America FDP Market Revenue (Million), by Country 2025 & 2033
- Figure 51: Latin America FDP Market Revenue Share (%), by Country 2025 & 2033
- Figure 52: Middle East and Africa FDP Market Revenue (Million), by Solution 2025 & 2033
- Figure 53: Middle East and Africa FDP Market Revenue Share (%), by Solution 2025 & 2033
- Figure 54: Middle East and Africa FDP Market Revenue (Million), by Scale of End User 2025 & 2033
- Figure 55: Middle East and Africa FDP Market Revenue Share (%), by Scale of End User 2025 & 2033
- Figure 56: Middle East and Africa FDP Market Revenue (Million), by Type of Fraud 2025 & 2033
- Figure 57: Middle East and Africa FDP Market Revenue Share (%), by Type of Fraud 2025 & 2033
- Figure 58: Middle East and Africa FDP Market Revenue (Million), by End-user Industry 2025 & 2033
- Figure 59: Middle East and Africa FDP Market Revenue Share (%), by End-user Industry 2025 & 2033
- Figure 60: Middle East and Africa FDP Market Revenue (Million), by Country 2025 & 2033
- Figure 61: Middle East and Africa FDP Market Revenue Share (%), by Country 2025 & 2033
List of Tables
- Table 1: Global FDP Market Revenue Million Forecast, by Solution 2020 & 2033
- Table 2: Global FDP Market Revenue Million Forecast, by Scale of End User 2020 & 2033
- Table 3: Global FDP Market Revenue Million Forecast, by Type of Fraud 2020 & 2033
- Table 4: Global FDP Market Revenue Million Forecast, by End-user Industry 2020 & 2033
- Table 5: Global FDP Market Revenue Million Forecast, by Region 2020 & 2033
- Table 6: Global FDP Market Revenue Million Forecast, by Solution 2020 & 2033
- Table 7: Global FDP Market Revenue Million Forecast, by Scale of End User 2020 & 2033
- Table 8: Global FDP Market Revenue Million Forecast, by Type of Fraud 2020 & 2033
- Table 9: Global FDP Market Revenue Million Forecast, by End-user Industry 2020 & 2033
- Table 10: Global FDP Market Revenue Million Forecast, by Country 2020 & 2033
- Table 11: Global FDP Market Revenue Million Forecast, by Solution 2020 & 2033
- Table 12: Global FDP Market Revenue Million Forecast, by Scale of End User 2020 & 2033
- Table 13: Global FDP Market Revenue Million Forecast, by Type of Fraud 2020 & 2033
- Table 14: Global FDP Market Revenue Million Forecast, by End-user Industry 2020 & 2033
- Table 15: Global FDP Market Revenue Million Forecast, by Country 2020 & 2033
- Table 16: Global FDP Market Revenue Million Forecast, by Solution 2020 & 2033
- Table 17: Global FDP Market Revenue Million Forecast, by Scale of End User 2020 & 2033
- Table 18: Global FDP Market Revenue Million Forecast, by Type of Fraud 2020 & 2033
- Table 19: Global FDP Market Revenue Million Forecast, by End-user Industry 2020 & 2033
- Table 20: Global FDP Market Revenue Million Forecast, by Country 2020 & 2033
- Table 21: Global FDP Market Revenue Million Forecast, by Solution 2020 & 2033
- Table 22: Global FDP Market Revenue Million Forecast, by Scale of End User 2020 & 2033
- Table 23: Global FDP Market Revenue Million Forecast, by Type of Fraud 2020 & 2033
- Table 24: Global FDP Market Revenue Million Forecast, by End-user Industry 2020 & 2033
- Table 25: Global FDP Market Revenue Million Forecast, by Country 2020 & 2033
- Table 26: Global FDP Market Revenue Million Forecast, by Solution 2020 & 2033
- Table 27: Global FDP Market Revenue Million Forecast, by Scale of End User 2020 & 2033
- Table 28: Global FDP Market Revenue Million Forecast, by Type of Fraud 2020 & 2033
- Table 29: Global FDP Market Revenue Million Forecast, by End-user Industry 2020 & 2033
- Table 30: Global FDP Market Revenue Million Forecast, by Country 2020 & 2033
- Table 31: Global FDP Market Revenue Million Forecast, by Solution 2020 & 2033
- Table 32: Global FDP Market Revenue Million Forecast, by Scale of End User 2020 & 2033
- Table 33: Global FDP Market Revenue Million Forecast, by Type of Fraud 2020 & 2033
- Table 34: Global FDP Market Revenue Million Forecast, by End-user Industry 2020 & 2033
- Table 35: Global FDP Market Revenue Million Forecast, by Country 2020 & 2033
Frequently Asked Questions
1. What is the projected Compound Annual Growth Rate (CAGR) of the FDP Market?
The projected CAGR is approximately 21.48%.
2. Which companies are prominent players in the FDP Market?
Key companies in the market include SAS Institute Inc, Global Payments Inc, Fiserv Inc, Fair Isaac Corporation, Experian PLC, IBM Corporation, RSA Security LLC (Dell Technologies Inc ), BAE Systems PLC, Feedzai Inc, NICE Ltd, DXC Technology Company, Oracle Corporation, Equifax Inc, ACI Worldwide Inc, LexisNexis Group, Cybersource Corporation, SAP SE.
3. What are the main segments of the FDP Market?
The market segments include Solution, Scale of End User, Type of Fraud, End-user Industry.
4. Can you provide details about the market size?
The market size is estimated to be USD 47.89 Million as of 2022.
5. What are some drivers contributing to market growth?
Increasing Volume of Non-cash Payment/transaction; Increasing Frauds in BFSI Sector.
6. What are the notable trends driving market growth?
BFSI Sector to be the Largest End-user Industry.
7. Are there any restraints impacting market growth?
Lack of Integration Capability with All Verticals.
8. Can you provide examples of recent developments in the market?
October 2023 - Nymcard, one of the largest card issuers in the MENA region, has partnered with ACI Worldwide, the world’s leading provider of mission-critical real-time point-of-sale (POS) payment solutions, to improve its fraud platform and protect its clients from the increasing incidence of financial fraud.
9. What pricing options are available for accessing the report?
Pricing options include single-user, multi-user, and enterprise licenses priced at USD 4750, USD 5250, and USD 8750 respectively.
10. Is the market size provided in terms of value or volume?
The market size is provided in terms of value, measured in Million.
11. Are there any specific market keywords associated with the report?
Yes, the market keyword associated with the report is "FDP Market," which aids in identifying and referencing the specific market segment covered.
12. How do I determine which pricing option suits my needs best?
The pricing options vary based on user requirements and access needs. Individual users may opt for single-user licenses, while businesses requiring broader access may choose multi-user or enterprise licenses for cost-effective access to the report.
13. Are there any additional resources or data provided in the FDP Market report?
While the report offers comprehensive insights, it's advisable to review the specific contents or supplementary materials provided to ascertain if additional resources or data are available.
14. How can I stay updated on further developments or reports in the FDP Market?
To stay informed about further developments, trends, and reports in the FDP Market, consider subscribing to industry newsletters, following relevant companies and organizations, or regularly checking reputable industry news sources and publications.
Methodology
Step 1 - Identification of Relevant Samples Size from Population Database


Step 2 - Approaches for Defining Global Market Size (Value, Volume* & Price*)

Note*: In applicable scenarios
Step 3 - Data Sources
Primary Research
- Web Analytics
- Survey Reports
- Research Institute
- Latest Research Reports
- Opinion Leaders
Secondary Research
- Annual Reports
- White Paper
- Latest Press Release
- Industry Association
- Paid Database
- Investor Presentations

Step 4 - Data Triangulation
Involves using different sources of information in order to increase the validity of a study
These sources are likely to be stakeholders in a program - participants, other researchers, program staff, other community members, and so on.
Then we put all data in single framework & apply various statistical tools to find out the dynamic on the market.
During the analysis stage, feedback from the stakeholder groups would be compared to determine areas of agreement as well as areas of divergence