

Key Insights
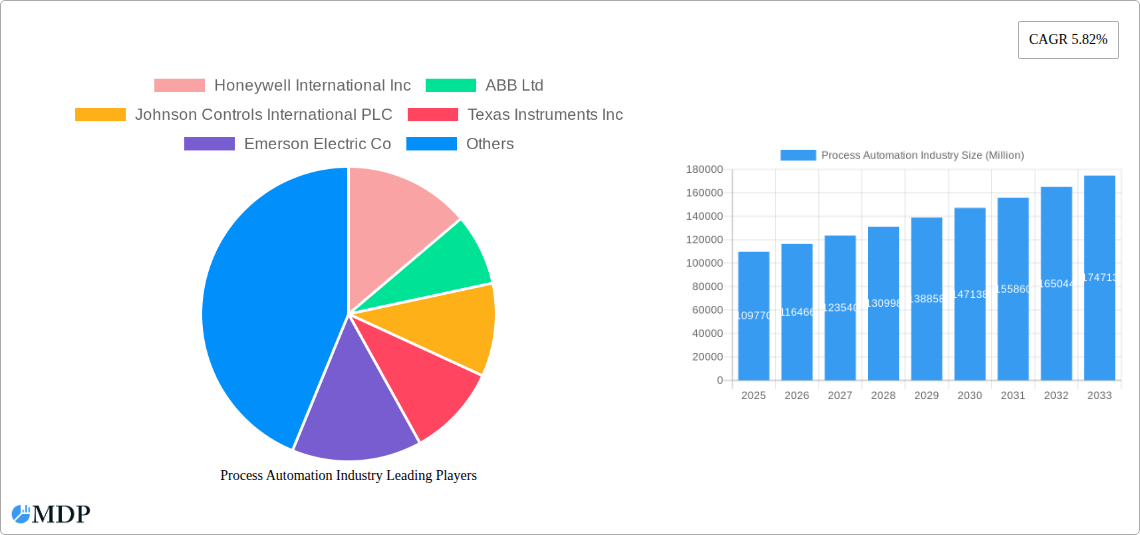
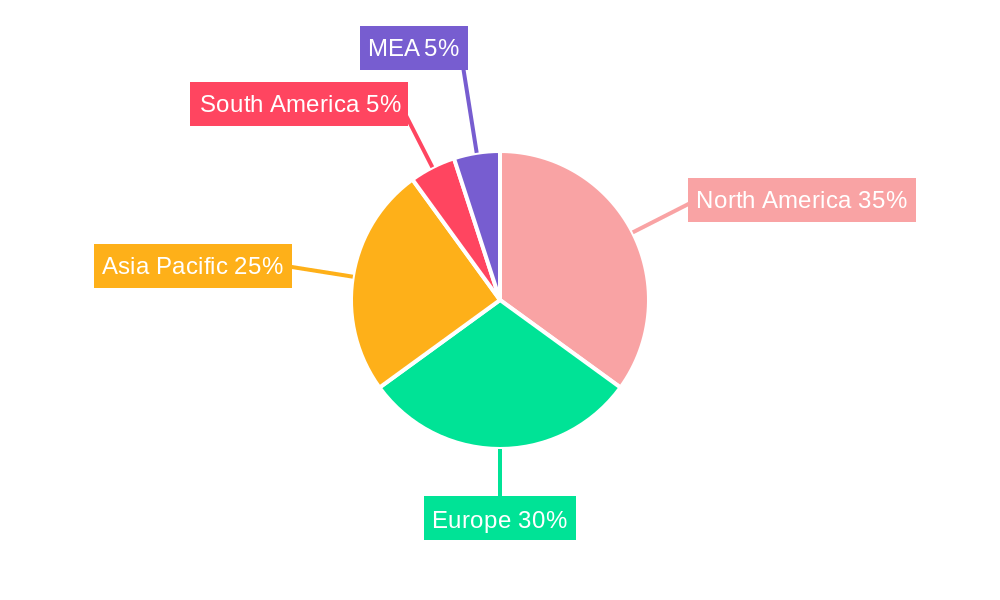
The global process automation market, valued at $109.77 billion in 2025, is projected to experience robust growth, driven by increasing industrial automation adoption across diverse sectors. A Compound Annual Growth Rate (CAGR) of 5.82% from 2025 to 2033 indicates a significant expansion, fueled by several key factors. The rising demand for enhanced operational efficiency, improved safety standards, and reduced operational costs in industries like oil and gas, chemicals, and pharmaceuticals is a major catalyst. Furthermore, the integration of advanced technologies such as Artificial Intelligence (AI), Machine Learning (ML), and the Industrial Internet of Things (IIoT) is revolutionizing process automation, enabling predictive maintenance, optimized resource allocation, and real-time process monitoring. The shift towards Industry 4.0 and the growing need for digital transformation are also contributing to market expansion. Specific segments like DCS, PLC, and SCADA systems are expected to witness high demand due to their reliability and scalability. Wireless communication protocols are gaining traction over wired protocols, driven by flexibility and ease of installation. Geographically, North America and Europe currently hold significant market share, but the Asia-Pacific region is poised for rapid growth due to increasing industrialization and infrastructure development.
However, the market's growth trajectory isn't without challenges. High initial investment costs associated with implementing process automation solutions can be a significant restraint, especially for small and medium-sized enterprises (SMEs). Furthermore, the complexity of integrating various systems and the need for skilled workforce to operate and maintain these systems present hurdles. Cybersecurity concerns related to interconnected systems and data security are also crucial factors that need to be addressed. Despite these challenges, the long-term outlook for the process automation market remains positive, with continuous technological advancements and increasing industry adoption expected to drive substantial market expansion in the coming years. The competitive landscape is populated by established players, fostering innovation and driving down costs. This creates a favorable environment for both established and emerging companies.
Unlocking the Potential of the $XX Million Process Automation Industry: A Comprehensive Market Report (2019-2033)
This comprehensive report provides an in-depth analysis of the global process automation industry, encompassing market dynamics, leading players, technological advancements, and future growth projections. Covering the period from 2019 to 2033, with a focus on 2025, this report is an indispensable resource for industry stakeholders, investors, and strategic decision-makers seeking to navigate the complexities and capitalize on the opportunities within this rapidly evolving sector.
Process Automation Industry Market Dynamics & Concentration
The process automation industry, valued at $XX million in 2025, exhibits a moderately consolidated market structure. Key players like Honeywell International Inc, ABB Ltd, and Siemens Corporation hold significant market share, driving innovation and shaping industry standards. However, the presence of numerous smaller, specialized firms fosters competition and encourages the development of niche solutions. Market concentration is further influenced by mergers and acquisitions (M&A) activity, with approximately XX M&A deals recorded between 2019 and 2024.
- Market Share: Honeywell International Inc. (XX%), ABB Ltd. (XX%), Siemens Corporation (XX%), Others (XX%)
- Innovation Drivers: Advancements in AI, IoT, and cloud computing are reshaping automation strategies, while increasing demand for enhanced efficiency and reduced operational costs are driving innovation.
- Regulatory Frameworks: Stringent environmental regulations and safety standards influence product development and adoption, particularly within sectors like oil and gas and chemical processing.
- Product Substitutes: While limited, alternative manual processes or simpler control systems serve as partial substitutes, their limitations in scalability and efficiency generally favor automated solutions.
- End-User Trends: The growing emphasis on digital transformation, predictive maintenance, and data-driven decision-making across diverse end-user industries fuels the demand for sophisticated automation solutions.
- M&A Activities: The increase in M&A activities signals a trend toward consolidation and the integration of complementary technologies and expertise within the sector.
Process Automation Industry Industry Trends & Analysis
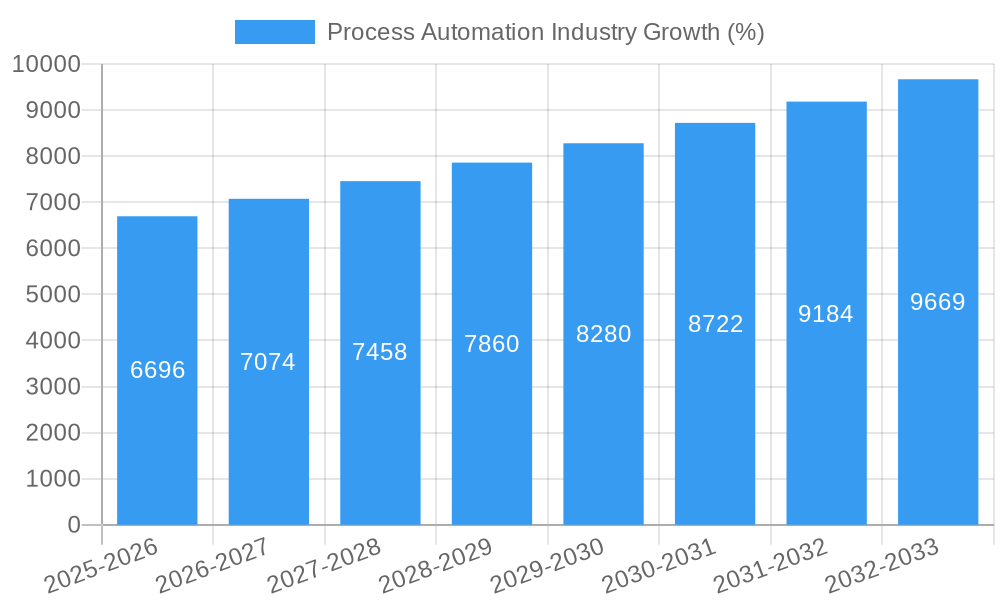
The process automation industry is experiencing robust growth, projected to reach $XX million by 2033, with a Compound Annual Growth Rate (CAGR) of XX% during the forecast period (2025-2033). This growth is primarily driven by increasing adoption of automation across diverse industries, the integration of advanced technologies like Artificial Intelligence (AI) and Machine Learning (ML), and the growing need for enhanced operational efficiency and reduced operational expenses. The market penetration of advanced automation systems is steadily increasing, particularly in developed economies. Competitive dynamics are characterized by both intense competition among established players and the emergence of innovative startups offering specialized solutions. Consumer preferences increasingly favor solutions with enhanced user-friendliness, seamless integration, and robust cybersecurity features.
Leading Markets & Segments in Process Automation Industry
The North American region dominates the process automation market, driven by substantial investments in infrastructure development, robust industrial activity, and a supportive regulatory environment. Within specific segments, the Programmable Logic Controller (PLC) segment currently holds the largest market share due to its versatility and cost-effectiveness across various industrial applications. However, the Distributed Control System (DCS) and Supervisory Control and Data Acquisition (SCADA) segments are experiencing rapid growth owing to their suitability for complex industrial processes.
Key Drivers in North America:
- Robust investments in infrastructure development, particularly in energy and manufacturing.
- High adoption rate of advanced automation technologies due to technological advancements.
- Favorable government policies and regulations.
Dominant Segments: PLC, DCS, and SCADA. The wired protocol currently holds a larger market share than wireless, although wireless adoption is rapidly increasing in applications that benefit from increased mobility and flexibility.
High-Growth End-User Industries: Chemical and Petrochemical, Oil and Gas, and Energy and Utilities are leading growth drivers due to their high capital expenditure and emphasis on operational efficiency.
Process Automation Industry Product Developments
Recent product innovations focus on enhancing connectivity, integrating AI/ML capabilities for predictive maintenance and real-time optimization, and improving cybersecurity features to mitigate vulnerabilities. These advancements are delivering improved operational efficiency, reduced downtime, enhanced safety, and optimized resource utilization, leading to better market fit and competitive advantage. The integration of cloud-based platforms for data analytics and remote monitoring further enhances the value proposition of these systems.
Key Drivers of Process Automation Industry Growth
Technological advancements, particularly in AI, IoT, and cloud computing, are pivotal growth drivers. Increased government regulations promoting automation to improve efficiency and reduce environmental impact also stimulate adoption. Furthermore, the rising demand for enhanced productivity and reduced operational costs across various industries is fueling investments in process automation solutions.
Challenges in the Process Automation Industry Market
High initial investment costs, the complexity of implementation, and the need for skilled labor can hinder adoption. Supply chain disruptions and the rising cost of raw materials can impact production and profitability. Intense competition among established players and emerging startups also poses a significant challenge.
Emerging Opportunities in Process Automation Industry
The integration of edge computing, advanced analytics, and digital twin technology presents exciting opportunities. Strategic partnerships and collaborations between automation providers and end-user industries are fostering innovation and expanding market reach. Expansion into new, emerging markets, particularly in developing economies, offers significant growth potential.
Leading Players in the Process Automation Industry Sector
- Honeywell International Inc
- ABB Ltd
- Johnson Controls International PLC
- Texas Instruments Inc
- Emerson Electric Co
- Mitsubishi Electric Corporation
- Schneider Electric SE
- Eaton Corporation PLC
- Siemens Corporation
- Rockwell Automation Inc
- Bosch Rexroth AG (Robert Bosch GmBH)
- Dassault Systemes SE
- Yokogawa Electric Corporation
Key Milestones in Process Automation Industry Industry
- 2020: Increased adoption of remote monitoring solutions due to the pandemic.
- 2021: Several significant M&A deals reshaped the competitive landscape.
- 2022: Launch of several AI-powered automation platforms.
- 2023: Growing emphasis on sustainability and green automation solutions.
- 2024: Introduction of advanced cybersecurity protocols for enhanced data protection.
Strategic Outlook for Process Automation Industry Market
The process automation market is poised for continued expansion, driven by technological advancements and increasing demand across diverse sectors. Strategic partnerships, investments in research and development, and expansion into new geographical markets will be crucial for success. The focus on integrating sustainable and environmentally friendly automation solutions will further shape the industry's trajectory.
Process Automation Industry Segmentation
-
1. System Type
- 1.1. Supervisory Control and Data Acquisition (SCADA)
- 1.2. Programmable Logic Controller (PLC)
- 1.3. Distributed Control System (DCS)
- 1.4. Machine Execution System (MES)
- 1.5. Valves and Actuators
- 1.6. Electric Motors
- 1.7. Human Machine Interface (HMI)
- 1.8. Process Safety Systems
- 1.9. Sensors and Transmitters
- 1.10. Other Systems
-
2. Communication Protocol
- 2.1. Wired Protocol
- 2.2. Wireless Protocol
-
3. End-user Industry
- 3.1. Chemical and Petrochemical
- 3.2. Paper and Pulp
- 3.3. Water and Wastewater Treatment
- 3.4. Energy and Utilities
- 3.5. Oil and Gas
- 3.6. Pharmaceutical
- 3.7. Food and Beverages
- 3.8. Other End-user Industries
Process Automation Industry Segmentation By Geography
-
1. North America
- 1.1. United States
- 1.2. Canada
-
2. Europe
- 2.1. United Kingdom
- 2.2. Germany
- 2.3. France
- 2.4. Rest of Europe
-
3. Asia Pacific
- 3.1. China
- 3.2. India
- 3.3. Japan
- 3.4. Rest of Asia Pacific
- 4. Latin America
- 5. Middle East and Africa
Process Automation Industry REPORT HIGHLIGHTS
| Aspects | Details |
|---|---|
| Study Period | 2019-2033 |
| Base Year | 2024 |
| Estimated Year | 2025 |
| Forecast Period | 2025-2033 |
| Historical Period | 2019-2024 |
| Growth Rate | CAGR of 5.82% from 2019-2033 |
| Segmentation |
|
Table of Contents
- 1. Introduction
- 1.1. Research Scope
- 1.2. Market Segmentation
- 1.3. Research Methodology
- 1.4. Definitions and Assumptions
- 2. Executive Summary
- 2.1. Introduction
- 3. Market Dynamics
- 3.1. Introduction
- 3.2. Market Drivers
- 3.2.1. ; Rising Adoption of Robotics; Growing Emphasis on Energy Efficiency and Cost Reduction; Emergence of IIoT; Demand for Safety Automation Systems
- 3.3. Market Restrains
- 3.3.1. High Up-front Installation Costs and Interoperability Issues; Unavailability for Skilled Workforce
- 3.4. Market Trends
- 3.4.1. Paper and Pulp Segment is Expected to Register a Significant Growth
- 4. Market Factor Analysis
- 4.1. Porters Five Forces
- 4.2. Supply/Value Chain
- 4.3. PESTEL analysis
- 4.4. Market Entropy
- 4.5. Patent/Trademark Analysis
- 5. Global Process Automation Industry Analysis, Insights and Forecast, 2019-2031
- 5.1. Market Analysis, Insights and Forecast - by System Type
- 5.1.1. Supervisory Control and Data Acquisition (SCADA)
- 5.1.2. Programmable Logic Controller (PLC)
- 5.1.3. Distributed Control System (DCS)
- 5.1.4. Machine Execution System (MES)
- 5.1.5. Valves and Actuators
- 5.1.6. Electric Motors
- 5.1.7. Human Machine Interface (HMI)
- 5.1.8. Process Safety Systems
- 5.1.9. Sensors and Transmitters
- 5.1.10. Other Systems
- 5.2. Market Analysis, Insights and Forecast - by Communication Protocol
- 5.2.1. Wired Protocol
- 5.2.2. Wireless Protocol
- 5.3. Market Analysis, Insights and Forecast - by End-user Industry
- 5.3.1. Chemical and Petrochemical
- 5.3.2. Paper and Pulp
- 5.3.3. Water and Wastewater Treatment
- 5.3.4. Energy and Utilities
- 5.3.5. Oil and Gas
- 5.3.6. Pharmaceutical
- 5.3.7. Food and Beverages
- 5.3.8. Other End-user Industries
- 5.4. Market Analysis, Insights and Forecast - by Region
- 5.4.1. North America
- 5.4.2. Europe
- 5.4.3. Asia Pacific
- 5.4.4. Latin America
- 5.4.5. Middle East and Africa
- 5.1. Market Analysis, Insights and Forecast - by System Type
- 6. North America Process Automation Industry Analysis, Insights and Forecast, 2019-2031
- 6.1. Market Analysis, Insights and Forecast - by System Type
- 6.1.1. Supervisory Control and Data Acquisition (SCADA)
- 6.1.2. Programmable Logic Controller (PLC)
- 6.1.3. Distributed Control System (DCS)
- 6.1.4. Machine Execution System (MES)
- 6.1.5. Valves and Actuators
- 6.1.6. Electric Motors
- 6.1.7. Human Machine Interface (HMI)
- 6.1.8. Process Safety Systems
- 6.1.9. Sensors and Transmitters
- 6.1.10. Other Systems
- 6.2. Market Analysis, Insights and Forecast - by Communication Protocol
- 6.2.1. Wired Protocol
- 6.2.2. Wireless Protocol
- 6.3. Market Analysis, Insights and Forecast - by End-user Industry
- 6.3.1. Chemical and Petrochemical
- 6.3.2. Paper and Pulp
- 6.3.3. Water and Wastewater Treatment
- 6.3.4. Energy and Utilities
- 6.3.5. Oil and Gas
- 6.3.6. Pharmaceutical
- 6.3.7. Food and Beverages
- 6.3.8. Other End-user Industries
- 6.1. Market Analysis, Insights and Forecast - by System Type
- 7. Europe Process Automation Industry Analysis, Insights and Forecast, 2019-2031
- 7.1. Market Analysis, Insights and Forecast - by System Type
- 7.1.1. Supervisory Control and Data Acquisition (SCADA)
- 7.1.2. Programmable Logic Controller (PLC)
- 7.1.3. Distributed Control System (DCS)
- 7.1.4. Machine Execution System (MES)
- 7.1.5. Valves and Actuators
- 7.1.6. Electric Motors
- 7.1.7. Human Machine Interface (HMI)
- 7.1.8. Process Safety Systems
- 7.1.9. Sensors and Transmitters
- 7.1.10. Other Systems
- 7.2. Market Analysis, Insights and Forecast - by Communication Protocol
- 7.2.1. Wired Protocol
- 7.2.2. Wireless Protocol
- 7.3. Market Analysis, Insights and Forecast - by End-user Industry
- 7.3.1. Chemical and Petrochemical
- 7.3.2. Paper and Pulp
- 7.3.3. Water and Wastewater Treatment
- 7.3.4. Energy and Utilities
- 7.3.5. Oil and Gas
- 7.3.6. Pharmaceutical
- 7.3.7. Food and Beverages
- 7.3.8. Other End-user Industries
- 7.1. Market Analysis, Insights and Forecast - by System Type
- 8. Asia Pacific Process Automation Industry Analysis, Insights and Forecast, 2019-2031
- 8.1. Market Analysis, Insights and Forecast - by System Type
- 8.1.1. Supervisory Control and Data Acquisition (SCADA)
- 8.1.2. Programmable Logic Controller (PLC)
- 8.1.3. Distributed Control System (DCS)
- 8.1.4. Machine Execution System (MES)
- 8.1.5. Valves and Actuators
- 8.1.6. Electric Motors
- 8.1.7. Human Machine Interface (HMI)
- 8.1.8. Process Safety Systems
- 8.1.9. Sensors and Transmitters
- 8.1.10. Other Systems
- 8.2. Market Analysis, Insights and Forecast - by Communication Protocol
- 8.2.1. Wired Protocol
- 8.2.2. Wireless Protocol
- 8.3. Market Analysis, Insights and Forecast - by End-user Industry
- 8.3.1. Chemical and Petrochemical
- 8.3.2. Paper and Pulp
- 8.3.3. Water and Wastewater Treatment
- 8.3.4. Energy and Utilities
- 8.3.5. Oil and Gas
- 8.3.6. Pharmaceutical
- 8.3.7. Food and Beverages
- 8.3.8. Other End-user Industries
- 8.1. Market Analysis, Insights and Forecast - by System Type
- 9. Latin America Process Automation Industry Analysis, Insights and Forecast, 2019-2031
- 9.1. Market Analysis, Insights and Forecast - by System Type
- 9.1.1. Supervisory Control and Data Acquisition (SCADA)
- 9.1.2. Programmable Logic Controller (PLC)
- 9.1.3. Distributed Control System (DCS)
- 9.1.4. Machine Execution System (MES)
- 9.1.5. Valves and Actuators
- 9.1.6. Electric Motors
- 9.1.7. Human Machine Interface (HMI)
- 9.1.8. Process Safety Systems
- 9.1.9. Sensors and Transmitters
- 9.1.10. Other Systems
- 9.2. Market Analysis, Insights and Forecast - by Communication Protocol
- 9.2.1. Wired Protocol
- 9.2.2. Wireless Protocol
- 9.3. Market Analysis, Insights and Forecast - by End-user Industry
- 9.3.1. Chemical and Petrochemical
- 9.3.2. Paper and Pulp
- 9.3.3. Water and Wastewater Treatment
- 9.3.4. Energy and Utilities
- 9.3.5. Oil and Gas
- 9.3.6. Pharmaceutical
- 9.3.7. Food and Beverages
- 9.3.8. Other End-user Industries
- 9.1. Market Analysis, Insights and Forecast - by System Type
- 10. Middle East and Africa Process Automation Industry Analysis, Insights and Forecast, 2019-2031
- 10.1. Market Analysis, Insights and Forecast - by System Type
- 10.1.1. Supervisory Control and Data Acquisition (SCADA)
- 10.1.2. Programmable Logic Controller (PLC)
- 10.1.3. Distributed Control System (DCS)
- 10.1.4. Machine Execution System (MES)
- 10.1.5. Valves and Actuators
- 10.1.6. Electric Motors
- 10.1.7. Human Machine Interface (HMI)
- 10.1.8. Process Safety Systems
- 10.1.9. Sensors and Transmitters
- 10.1.10. Other Systems
- 10.2. Market Analysis, Insights and Forecast - by Communication Protocol
- 10.2.1. Wired Protocol
- 10.2.2. Wireless Protocol
- 10.3. Market Analysis, Insights and Forecast - by End-user Industry
- 10.3.1. Chemical and Petrochemical
- 10.3.2. Paper and Pulp
- 10.3.3. Water and Wastewater Treatment
- 10.3.4. Energy and Utilities
- 10.3.5. Oil and Gas
- 10.3.6. Pharmaceutical
- 10.3.7. Food and Beverages
- 10.3.8. Other End-user Industries
- 10.1. Market Analysis, Insights and Forecast - by System Type
- 11. North America Process Automation Industry Analysis, Insights and Forecast, 2019-2031
- 11.1. Market Analysis, Insights and Forecast - By Country/Sub-region
- 11.1.1 United States
- 11.1.2 Canada
- 11.1.3 Mexico
- 12. Europe Process Automation Industry Analysis, Insights and Forecast, 2019-2031
- 12.1. Market Analysis, Insights and Forecast - By Country/Sub-region
- 12.1.1 Germany
- 12.1.2 United Kingdom
- 12.1.3 France
- 12.1.4 Spain
- 12.1.5 Italy
- 12.1.6 Spain
- 12.1.7 Belgium
- 12.1.8 Netherland
- 12.1.9 Nordics
- 12.1.10 Rest of Europe
- 13. Asia Pacific Process Automation Industry Analysis, Insights and Forecast, 2019-2031
- 13.1. Market Analysis, Insights and Forecast - By Country/Sub-region
- 13.1.1 China
- 13.1.2 Japan
- 13.1.3 India
- 13.1.4 South Korea
- 13.1.5 Southeast Asia
- 13.1.6 Australia
- 13.1.7 Indonesia
- 13.1.8 Phillipes
- 13.1.9 Singapore
- 13.1.10 Thailandc
- 13.1.11 Rest of Asia Pacific
- 14. South America Process Automation Industry Analysis, Insights and Forecast, 2019-2031
- 14.1. Market Analysis, Insights and Forecast - By Country/Sub-region
- 14.1.1 Brazil
- 14.1.2 Argentina
- 14.1.3 Peru
- 14.1.4 Chile
- 14.1.5 Colombia
- 14.1.6 Ecuador
- 14.1.7 Venezuela
- 14.1.8 Rest of South America
- 15. MEA Process Automation Industry Analysis, Insights and Forecast, 2019-2031
- 15.1. Market Analysis, Insights and Forecast - By Country/Sub-region
- 15.1.1 United Arab Emirates
- 15.1.2 Saudi Arabia
- 15.1.3 South Africa
- 15.1.4 Rest of Middle East and Africa
- 16. Competitive Analysis
- 16.1. Global Market Share Analysis 2024
- 16.2. Company Profiles
- 16.2.1 Honeywell International Inc
- 16.2.1.1. Overview
- 16.2.1.2. Products
- 16.2.1.3. SWOT Analysis
- 16.2.1.4. Recent Developments
- 16.2.1.5. Financials (Based on Availability)
- 16.2.2 ABB Ltd
- 16.2.2.1. Overview
- 16.2.2.2. Products
- 16.2.2.3. SWOT Analysis
- 16.2.2.4. Recent Developments
- 16.2.2.5. Financials (Based on Availability)
- 16.2.3 Johnson Controls International PLC
- 16.2.3.1. Overview
- 16.2.3.2. Products
- 16.2.3.3. SWOT Analysis
- 16.2.3.4. Recent Developments
- 16.2.3.5. Financials (Based on Availability)
- 16.2.4 Texas Instruments Inc
- 16.2.4.1. Overview
- 16.2.4.2. Products
- 16.2.4.3. SWOT Analysis
- 16.2.4.4. Recent Developments
- 16.2.4.5. Financials (Based on Availability)
- 16.2.5 Emerson Electric Co
- 16.2.5.1. Overview
- 16.2.5.2. Products
- 16.2.5.3. SWOT Analysis
- 16.2.5.4. Recent Developments
- 16.2.5.5. Financials (Based on Availability)
- 16.2.6 Mitsubishi Electric Corporation
- 16.2.6.1. Overview
- 16.2.6.2. Products
- 16.2.6.3. SWOT Analysis
- 16.2.6.4. Recent Developments
- 16.2.6.5. Financials (Based on Availability)
- 16.2.7 Schneider Electric SE
- 16.2.7.1. Overview
- 16.2.7.2. Products
- 16.2.7.3. SWOT Analysis
- 16.2.7.4. Recent Developments
- 16.2.7.5. Financials (Based on Availability)
- 16.2.8 Eaton Corporation PLC
- 16.2.8.1. Overview
- 16.2.8.2. Products
- 16.2.8.3. SWOT Analysis
- 16.2.8.4. Recent Developments
- 16.2.8.5. Financials (Based on Availability)
- 16.2.9 Siemens Corporation
- 16.2.9.1. Overview
- 16.2.9.2. Products
- 16.2.9.3. SWOT Analysis
- 16.2.9.4. Recent Developments
- 16.2.9.5. Financials (Based on Availability)
- 16.2.10 Rockwell Automation Inc
- 16.2.10.1. Overview
- 16.2.10.2. Products
- 16.2.10.3. SWOT Analysis
- 16.2.10.4. Recent Developments
- 16.2.10.5. Financials (Based on Availability)
- 16.2.11 Bosch Rexroth AG (Robert Bosch GmBH)
- 16.2.11.1. Overview
- 16.2.11.2. Products
- 16.2.11.3. SWOT Analysis
- 16.2.11.4. Recent Developments
- 16.2.11.5. Financials (Based on Availability)
- 16.2.12 Dassault Systemes SE
- 16.2.12.1. Overview
- 16.2.12.2. Products
- 16.2.12.3. SWOT Analysis
- 16.2.12.4. Recent Developments
- 16.2.12.5. Financials (Based on Availability)
- 16.2.13 Yokogawa Electric Corporation
- 16.2.13.1. Overview
- 16.2.13.2. Products
- 16.2.13.3. SWOT Analysis
- 16.2.13.4. Recent Developments
- 16.2.13.5. Financials (Based on Availability)
- 16.2.1 Honeywell International Inc
List of Figures
- Figure 1: Global Process Automation Industry Revenue Breakdown (Million, %) by Region 2024 & 2032
- Figure 2: North America Process Automation Industry Revenue (Million), by Country 2024 & 2032
- Figure 3: North America Process Automation Industry Revenue Share (%), by Country 2024 & 2032
- Figure 4: Europe Process Automation Industry Revenue (Million), by Country 2024 & 2032
- Figure 5: Europe Process Automation Industry Revenue Share (%), by Country 2024 & 2032
- Figure 6: Asia Pacific Process Automation Industry Revenue (Million), by Country 2024 & 2032
- Figure 7: Asia Pacific Process Automation Industry Revenue Share (%), by Country 2024 & 2032
- Figure 8: South America Process Automation Industry Revenue (Million), by Country 2024 & 2032
- Figure 9: South America Process Automation Industry Revenue Share (%), by Country 2024 & 2032
- Figure 10: MEA Process Automation Industry Revenue (Million), by Country 2024 & 2032
- Figure 11: MEA Process Automation Industry Revenue Share (%), by Country 2024 & 2032
- Figure 12: North America Process Automation Industry Revenue (Million), by System Type 2024 & 2032
- Figure 13: North America Process Automation Industry Revenue Share (%), by System Type 2024 & 2032
- Figure 14: North America Process Automation Industry Revenue (Million), by Communication Protocol 2024 & 2032
- Figure 15: North America Process Automation Industry Revenue Share (%), by Communication Protocol 2024 & 2032
- Figure 16: North America Process Automation Industry Revenue (Million), by End-user Industry 2024 & 2032
- Figure 17: North America Process Automation Industry Revenue Share (%), by End-user Industry 2024 & 2032
- Figure 18: North America Process Automation Industry Revenue (Million), by Country 2024 & 2032
- Figure 19: North America Process Automation Industry Revenue Share (%), by Country 2024 & 2032
- Figure 20: Europe Process Automation Industry Revenue (Million), by System Type 2024 & 2032
- Figure 21: Europe Process Automation Industry Revenue Share (%), by System Type 2024 & 2032
- Figure 22: Europe Process Automation Industry Revenue (Million), by Communication Protocol 2024 & 2032
- Figure 23: Europe Process Automation Industry Revenue Share (%), by Communication Protocol 2024 & 2032
- Figure 24: Europe Process Automation Industry Revenue (Million), by End-user Industry 2024 & 2032
- Figure 25: Europe Process Automation Industry Revenue Share (%), by End-user Industry 2024 & 2032
- Figure 26: Europe Process Automation Industry Revenue (Million), by Country 2024 & 2032
- Figure 27: Europe Process Automation Industry Revenue Share (%), by Country 2024 & 2032
- Figure 28: Asia Pacific Process Automation Industry Revenue (Million), by System Type 2024 & 2032
- Figure 29: Asia Pacific Process Automation Industry Revenue Share (%), by System Type 2024 & 2032
- Figure 30: Asia Pacific Process Automation Industry Revenue (Million), by Communication Protocol 2024 & 2032
- Figure 31: Asia Pacific Process Automation Industry Revenue Share (%), by Communication Protocol 2024 & 2032
- Figure 32: Asia Pacific Process Automation Industry Revenue (Million), by End-user Industry 2024 & 2032
- Figure 33: Asia Pacific Process Automation Industry Revenue Share (%), by End-user Industry 2024 & 2032
- Figure 34: Asia Pacific Process Automation Industry Revenue (Million), by Country 2024 & 2032
- Figure 35: Asia Pacific Process Automation Industry Revenue Share (%), by Country 2024 & 2032
- Figure 36: Latin America Process Automation Industry Revenue (Million), by System Type 2024 & 2032
- Figure 37: Latin America Process Automation Industry Revenue Share (%), by System Type 2024 & 2032
- Figure 38: Latin America Process Automation Industry Revenue (Million), by Communication Protocol 2024 & 2032
- Figure 39: Latin America Process Automation Industry Revenue Share (%), by Communication Protocol 2024 & 2032
- Figure 40: Latin America Process Automation Industry Revenue (Million), by End-user Industry 2024 & 2032
- Figure 41: Latin America Process Automation Industry Revenue Share (%), by End-user Industry 2024 & 2032
- Figure 42: Latin America Process Automation Industry Revenue (Million), by Country 2024 & 2032
- Figure 43: Latin America Process Automation Industry Revenue Share (%), by Country 2024 & 2032
- Figure 44: Middle East and Africa Process Automation Industry Revenue (Million), by System Type 2024 & 2032
- Figure 45: Middle East and Africa Process Automation Industry Revenue Share (%), by System Type 2024 & 2032
- Figure 46: Middle East and Africa Process Automation Industry Revenue (Million), by Communication Protocol 2024 & 2032
- Figure 47: Middle East and Africa Process Automation Industry Revenue Share (%), by Communication Protocol 2024 & 2032
- Figure 48: Middle East and Africa Process Automation Industry Revenue (Million), by End-user Industry 2024 & 2032
- Figure 49: Middle East and Africa Process Automation Industry Revenue Share (%), by End-user Industry 2024 & 2032
- Figure 50: Middle East and Africa Process Automation Industry Revenue (Million), by Country 2024 & 2032
- Figure 51: Middle East and Africa Process Automation Industry Revenue Share (%), by Country 2024 & 2032
List of Tables
- Table 1: Global Process Automation Industry Revenue Million Forecast, by Region 2019 & 2032
- Table 2: Global Process Automation Industry Revenue Million Forecast, by System Type 2019 & 2032
- Table 3: Global Process Automation Industry Revenue Million Forecast, by Communication Protocol 2019 & 2032
- Table 4: Global Process Automation Industry Revenue Million Forecast, by End-user Industry 2019 & 2032
- Table 5: Global Process Automation Industry Revenue Million Forecast, by Region 2019 & 2032
- Table 6: Global Process Automation Industry Revenue Million Forecast, by Country 2019 & 2032
- Table 7: United States Process Automation Industry Revenue (Million) Forecast, by Application 2019 & 2032
- Table 8: Canada Process Automation Industry Revenue (Million) Forecast, by Application 2019 & 2032
- Table 9: Mexico Process Automation Industry Revenue (Million) Forecast, by Application 2019 & 2032
- Table 10: Global Process Automation Industry Revenue Million Forecast, by Country 2019 & 2032
- Table 11: Germany Process Automation Industry Revenue (Million) Forecast, by Application 2019 & 2032
- Table 12: United Kingdom Process Automation Industry Revenue (Million) Forecast, by Application 2019 & 2032
- Table 13: France Process Automation Industry Revenue (Million) Forecast, by Application 2019 & 2032
- Table 14: Spain Process Automation Industry Revenue (Million) Forecast, by Application 2019 & 2032
- Table 15: Italy Process Automation Industry Revenue (Million) Forecast, by Application 2019 & 2032
- Table 16: Spain Process Automation Industry Revenue (Million) Forecast, by Application 2019 & 2032
- Table 17: Belgium Process Automation Industry Revenue (Million) Forecast, by Application 2019 & 2032
- Table 18: Netherland Process Automation Industry Revenue (Million) Forecast, by Application 2019 & 2032
- Table 19: Nordics Process Automation Industry Revenue (Million) Forecast, by Application 2019 & 2032
- Table 20: Rest of Europe Process Automation Industry Revenue (Million) Forecast, by Application 2019 & 2032
- Table 21: Global Process Automation Industry Revenue Million Forecast, by Country 2019 & 2032
- Table 22: China Process Automation Industry Revenue (Million) Forecast, by Application 2019 & 2032
- Table 23: Japan Process Automation Industry Revenue (Million) Forecast, by Application 2019 & 2032
- Table 24: India Process Automation Industry Revenue (Million) Forecast, by Application 2019 & 2032
- Table 25: South Korea Process Automation Industry Revenue (Million) Forecast, by Application 2019 & 2032
- Table 26: Southeast Asia Process Automation Industry Revenue (Million) Forecast, by Application 2019 & 2032
- Table 27: Australia Process Automation Industry Revenue (Million) Forecast, by Application 2019 & 2032
- Table 28: Indonesia Process Automation Industry Revenue (Million) Forecast, by Application 2019 & 2032
- Table 29: Phillipes Process Automation Industry Revenue (Million) Forecast, by Application 2019 & 2032
- Table 30: Singapore Process Automation Industry Revenue (Million) Forecast, by Application 2019 & 2032
- Table 31: Thailandc Process Automation Industry Revenue (Million) Forecast, by Application 2019 & 2032
- Table 32: Rest of Asia Pacific Process Automation Industry Revenue (Million) Forecast, by Application 2019 & 2032
- Table 33: Global Process Automation Industry Revenue Million Forecast, by Country 2019 & 2032
- Table 34: Brazil Process Automation Industry Revenue (Million) Forecast, by Application 2019 & 2032
- Table 35: Argentina Process Automation Industry Revenue (Million) Forecast, by Application 2019 & 2032
- Table 36: Peru Process Automation Industry Revenue (Million) Forecast, by Application 2019 & 2032
- Table 37: Chile Process Automation Industry Revenue (Million) Forecast, by Application 2019 & 2032
- Table 38: Colombia Process Automation Industry Revenue (Million) Forecast, by Application 2019 & 2032
- Table 39: Ecuador Process Automation Industry Revenue (Million) Forecast, by Application 2019 & 2032
- Table 40: Venezuela Process Automation Industry Revenue (Million) Forecast, by Application 2019 & 2032
- Table 41: Rest of South America Process Automation Industry Revenue (Million) Forecast, by Application 2019 & 2032
- Table 42: Global Process Automation Industry Revenue Million Forecast, by Country 2019 & 2032
- Table 43: United Arab Emirates Process Automation Industry Revenue (Million) Forecast, by Application 2019 & 2032
- Table 44: Saudi Arabia Process Automation Industry Revenue (Million) Forecast, by Application 2019 & 2032
- Table 45: South Africa Process Automation Industry Revenue (Million) Forecast, by Application 2019 & 2032
- Table 46: Rest of Middle East and Africa Process Automation Industry Revenue (Million) Forecast, by Application 2019 & 2032
- Table 47: Global Process Automation Industry Revenue Million Forecast, by System Type 2019 & 2032
- Table 48: Global Process Automation Industry Revenue Million Forecast, by Communication Protocol 2019 & 2032
- Table 49: Global Process Automation Industry Revenue Million Forecast, by End-user Industry 2019 & 2032
- Table 50: Global Process Automation Industry Revenue Million Forecast, by Country 2019 & 2032
- Table 51: United States Process Automation Industry Revenue (Million) Forecast, by Application 2019 & 2032
- Table 52: Canada Process Automation Industry Revenue (Million) Forecast, by Application 2019 & 2032
- Table 53: Global Process Automation Industry Revenue Million Forecast, by System Type 2019 & 2032
- Table 54: Global Process Automation Industry Revenue Million Forecast, by Communication Protocol 2019 & 2032
- Table 55: Global Process Automation Industry Revenue Million Forecast, by End-user Industry 2019 & 2032
- Table 56: Global Process Automation Industry Revenue Million Forecast, by Country 2019 & 2032
- Table 57: United Kingdom Process Automation Industry Revenue (Million) Forecast, by Application 2019 & 2032
- Table 58: Germany Process Automation Industry Revenue (Million) Forecast, by Application 2019 & 2032
- Table 59: France Process Automation Industry Revenue (Million) Forecast, by Application 2019 & 2032
- Table 60: Rest of Europe Process Automation Industry Revenue (Million) Forecast, by Application 2019 & 2032
- Table 61: Global Process Automation Industry Revenue Million Forecast, by System Type 2019 & 2032
- Table 62: Global Process Automation Industry Revenue Million Forecast, by Communication Protocol 2019 & 2032
- Table 63: Global Process Automation Industry Revenue Million Forecast, by End-user Industry 2019 & 2032
- Table 64: Global Process Automation Industry Revenue Million Forecast, by Country 2019 & 2032
- Table 65: China Process Automation Industry Revenue (Million) Forecast, by Application 2019 & 2032
- Table 66: India Process Automation Industry Revenue (Million) Forecast, by Application 2019 & 2032
- Table 67: Japan Process Automation Industry Revenue (Million) Forecast, by Application 2019 & 2032
- Table 68: Rest of Asia Pacific Process Automation Industry Revenue (Million) Forecast, by Application 2019 & 2032
- Table 69: Global Process Automation Industry Revenue Million Forecast, by System Type 2019 & 2032
- Table 70: Global Process Automation Industry Revenue Million Forecast, by Communication Protocol 2019 & 2032
- Table 71: Global Process Automation Industry Revenue Million Forecast, by End-user Industry 2019 & 2032
- Table 72: Global Process Automation Industry Revenue Million Forecast, by Country 2019 & 2032
- Table 73: Global Process Automation Industry Revenue Million Forecast, by System Type 2019 & 2032
- Table 74: Global Process Automation Industry Revenue Million Forecast, by Communication Protocol 2019 & 2032
- Table 75: Global Process Automation Industry Revenue Million Forecast, by End-user Industry 2019 & 2032
- Table 76: Global Process Automation Industry Revenue Million Forecast, by Country 2019 & 2032
Frequently Asked Questions
1. What is the projected Compound Annual Growth Rate (CAGR) of the Process Automation Industry?
The projected CAGR is approximately 5.82%.
2. Which companies are prominent players in the Process Automation Industry?
Key companies in the market include Honeywell International Inc, ABB Ltd, Johnson Controls International PLC, Texas Instruments Inc, Emerson Electric Co, Mitsubishi Electric Corporation, Schneider Electric SE, Eaton Corporation PLC, Siemens Corporation, Rockwell Automation Inc, Bosch Rexroth AG (Robert Bosch GmBH), Dassault Systemes SE, Yokogawa Electric Corporation.
3. What are the main segments of the Process Automation Industry?
The market segments include System Type, Communication Protocol, End-user Industry.
4. Can you provide details about the market size?
The market size is estimated to be USD 109.77 Million as of 2022.
5. What are some drivers contributing to market growth?
; Rising Adoption of Robotics; Growing Emphasis on Energy Efficiency and Cost Reduction; Emergence of IIoT; Demand for Safety Automation Systems.
6. What are the notable trends driving market growth?
Paper and Pulp Segment is Expected to Register a Significant Growth.
7. Are there any restraints impacting market growth?
High Up-front Installation Costs and Interoperability Issues; Unavailability for Skilled Workforce.
8. Can you provide examples of recent developments in the market?
N/A
9. What pricing options are available for accessing the report?
Pricing options include single-user, multi-user, and enterprise licenses priced at USD 4750, USD 5250, and USD 8750 respectively.
10. Is the market size provided in terms of value or volume?
The market size is provided in terms of value, measured in Million.
11. Are there any specific market keywords associated with the report?
Yes, the market keyword associated with the report is "Process Automation Industry," which aids in identifying and referencing the specific market segment covered.
12. How do I determine which pricing option suits my needs best?
The pricing options vary based on user requirements and access needs. Individual users may opt for single-user licenses, while businesses requiring broader access may choose multi-user or enterprise licenses for cost-effective access to the report.
13. Are there any additional resources or data provided in the Process Automation Industry report?
While the report offers comprehensive insights, it's advisable to review the specific contents or supplementary materials provided to ascertain if additional resources or data are available.
14. How can I stay updated on further developments or reports in the Process Automation Industry?
To stay informed about further developments, trends, and reports in the Process Automation Industry, consider subscribing to industry newsletters, following relevant companies and organizations, or regularly checking reputable industry news sources and publications.
Methodology
Step 1 - Identification of Relevant Samples Size from Population Database


Step 2 - Approaches for Defining Global Market Size (Value, Volume* & Price*)

Note*: In applicable scenarios
Step 3 - Data Sources
Primary Research
- Web Analytics
- Survey Reports
- Research Institute
- Latest Research Reports
- Opinion Leaders
Secondary Research
- Annual Reports
- White Paper
- Latest Press Release
- Industry Association
- Paid Database
- Investor Presentations

Step 4 - Data Triangulation
Involves using different sources of information in order to increase the validity of a study
These sources are likely to be stakeholders in a program - participants, other researchers, program staff, other community members, and so on.
Then we put all data in single framework & apply various statistical tools to find out the dynamic on the market.
During the analysis stage, feedback from the stakeholder groups would be compared to determine areas of agreement as well as areas of divergence
