

Key Insights
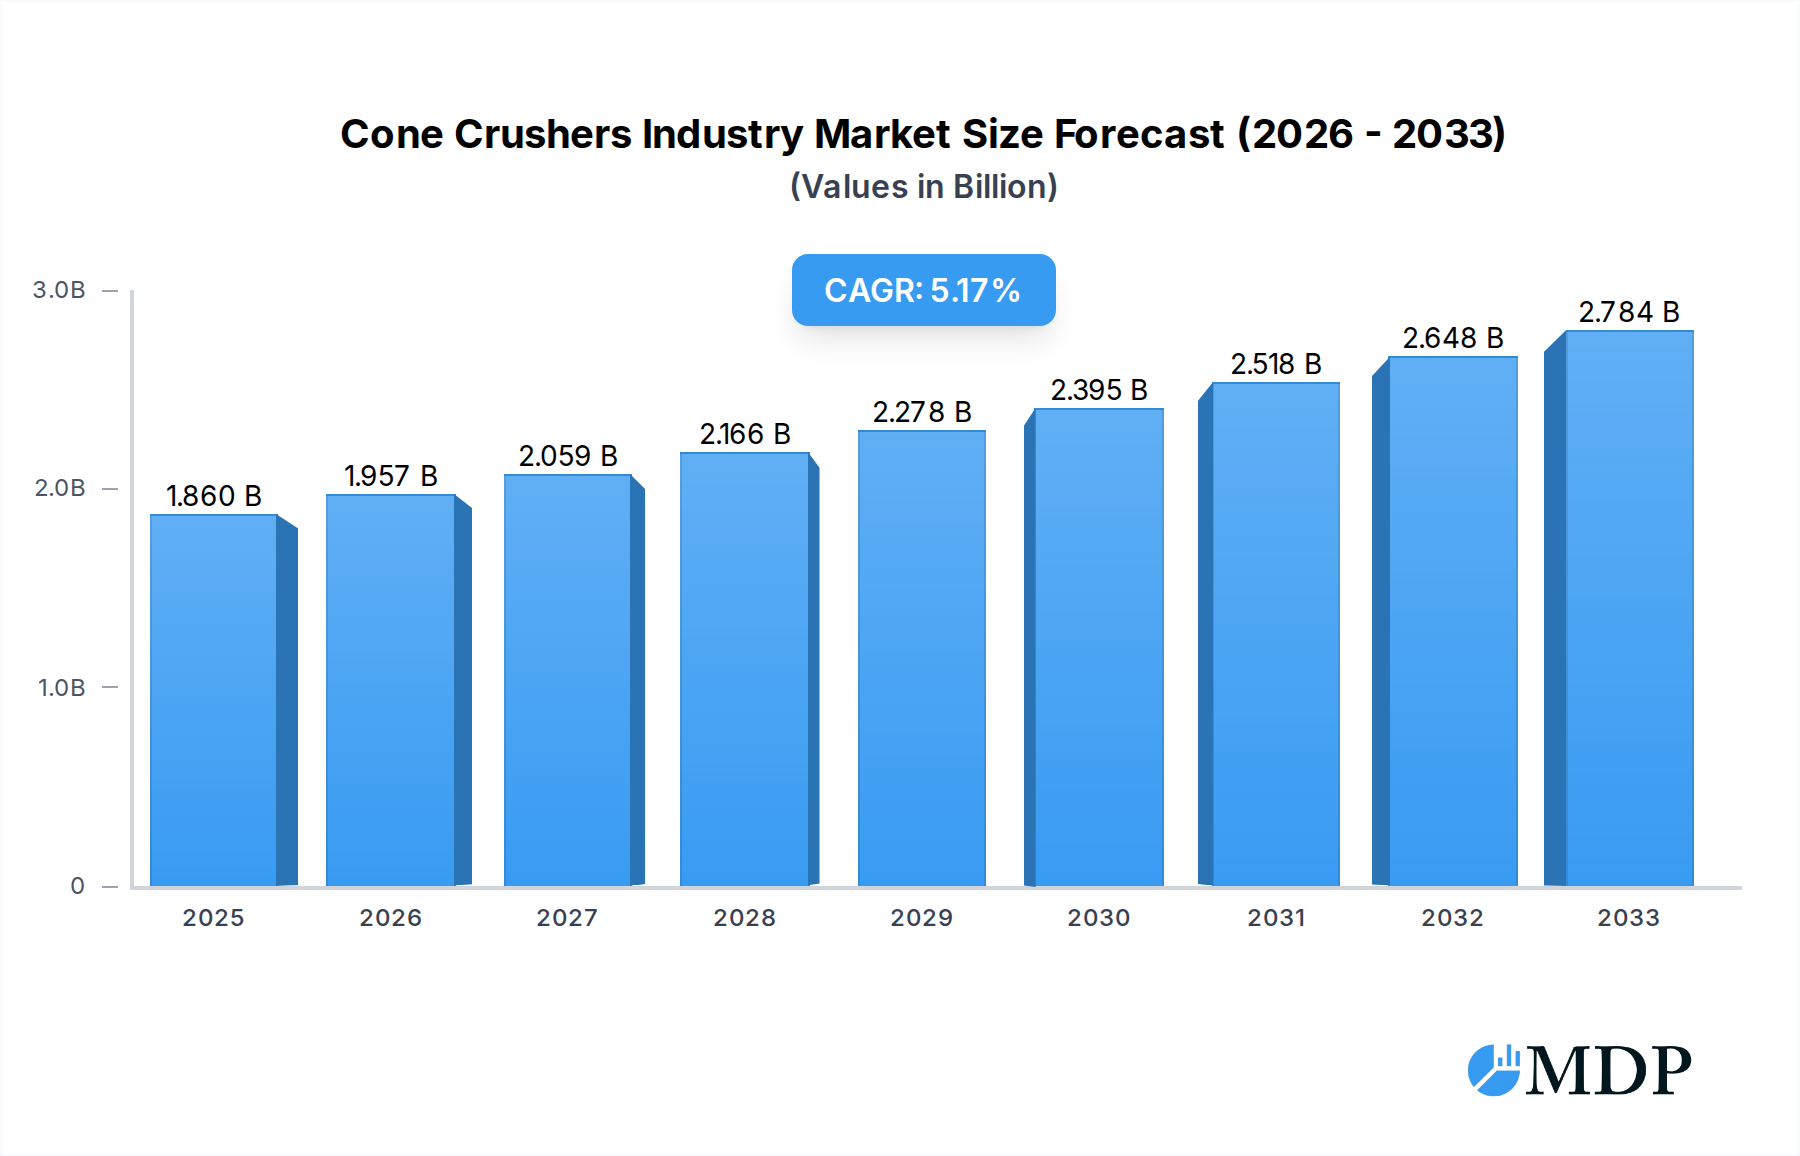
The global Cone Crushers Market is poised for significant expansion, projected to reach approximately USD 1.86 Billion by 2025, with a robust Compound Annual Growth Rate (CAGR) of 5.10% anticipated between 2025 and 2033. This impressive growth trajectory is primarily fueled by escalating demand from the construction and mining sectors, which are undergoing substantial development globally. Infrastructure projects, urban expansion, and the continuous need for raw material extraction are driving the adoption of cone crushers for efficient aggregate processing and material reduction. The increasing emphasis on modernizing mining operations and optimizing construction site efficiency further propels market expansion. Furthermore, technological advancements leading to more energy-efficient and powerful cone crusher models, coupled with an increasing focus on recycling and demolition applications, are contributing to the positive market outlook. The market's dynamism is also shaped by the growing adoption of mobile and portable crushing solutions, offering greater flexibility and reduced operational costs for various project sites.

Cone Crushers Industry Market Size (In Billion)
The market segmentation reveals a diverse landscape with key distinctions in crusher types, offering, power sources, and end-user applications. Symons, Hydraulics, and Gyratory crushers represent prominent types, catering to different crushing needs. The offering is broadly categorized into mobile, portable, and stationary crushers, reflecting the industry's adaptability to project requirements. Electric and diesel power sources remain dominant, with a growing trend towards dual-connection options for enhanced operational flexibility. The mining and metallurgy, construction, and aggregate processing industries are the leading end-user segments, highlighting the core demand drivers. Geographically, North America and Asia Pacific are expected to be key revenue-generating regions, driven by substantial infrastructure investments and a thriving mining industry. Emerging economies in Latin America and the Middle East and Africa are also presenting significant growth opportunities as they develop their industrial and construction capacities. Key players are actively engaged in strategic collaborations and product innovation to capture market share and address evolving customer demands in this dynamic industry.
Cone Crushers Industry Company Market Share
Unleash Your Business Potential: The Definitive Cone Crushers Industry Report (2019-2033)
Gain unparalleled insights into the global Cone Crushers Industry with this comprehensive, data-driven report. Covering the historical period of 2019-2024 and extending through an estimated 2025 to a forecast period of 2025-2033, this analysis is your essential guide to navigating market dynamics, identifying growth opportunities, and understanding the competitive landscape.
This report is meticulously structured to provide actionable intelligence for manufacturers, suppliers, investors, and end-users across the Mining and Metallurgy, Construction, Aggregate Processing, and Demolition sectors. Dive deep into market trends, technological advancements, and strategic imperatives shaping the future of cone crushers.
Key report features include:
- In-depth Market Analysis: Understand the intricate workings of the Cone Crushers Industry, including market concentration, innovation drivers, regulatory impacts, product substitutes, end-user trends, and strategic Mergers & Acquisitions (M&A).
- Future Growth Projections: Leverage our detailed forecast for 2025-2033, with a strong focus on the base year 2025, to anticipate market expansion and investment potential.
- Segment-Specific Insights: Explore dominant segments across Type (Symons, Hydraulics, Gyratory, Other Types), Offering (Mobile Crushers, Portable Crushers, Stationary Crushers), Power Source (Electric Connection, Diesel Connection, Dual Connection), and End-user Application (Mining and Metallurgy, Construction, Aggregate Processing, Demolition, Other End-user Applications).
- Leading Player Profiling: Identify key industry players and their strategic positioning.
- Crucial Developments & Innovations: Stay ahead with analyses of key industry milestones and product developments.
Don't miss this critical resource to solidify your market position and drive strategic growth in the dynamic Cone Crushers Industry.
Cone Crushers Industry Market Dynamics & Concentration
The Cone Crushers Industry exhibits a moderate to high market concentration, with a significant portion of the market share held by a few dominant global players. Innovation drivers are primarily fueled by the demand for higher efficiency, reduced energy consumption, and improved environmental performance. Regulatory frameworks, particularly concerning emissions and workplace safety, are increasingly influencing product design and operational standards. Product substitutes, while existing in the form of other crushing technologies, are less effective for specific high-volume, fine-aggregate applications where cone crushers excel. End-user trends indicate a growing preference for mobile and portable crushing solutions to cater to project flexibility and remote operational needs. M&A activities are moderate, with strategic acquisitions focused on expanding product portfolios, geographical reach, and technological capabilities. For instance, several key players have acquired smaller specialized firms to enhance their offerings in niche segments or integrated solutions. The average M&A deal count over the historical period has been approximately 3-5 significant transactions annually.
Cone Crushers Industry Industry Trends & Analysis
The global Cone Crushers Industry is poised for robust growth, driven by the insatiable demand for aggregates and construction materials, particularly in emerging economies undergoing rapid urbanization and infrastructure development. The projected Compound Annual Growth Rate (CAGR) for the forecast period 2025–2033 is estimated to be between 5.5% and 7.0%. This expansion is further fueled by technological disruptions such as the integration of IoT and AI for predictive maintenance, remote monitoring, and optimized performance, leading to increased uptime and reduced operational costs. Consumer preferences are leaning towards environmentally friendly and energy-efficient crushing solutions, pushing manufacturers to innovate with electric-powered models and advanced material handling systems that minimize dust and noise pollution. Competitive dynamics are characterized by a mix of large multinational corporations and agile regional manufacturers, all vying for market share through product differentiation, competitive pricing, and comprehensive after-sales support. The increasing adoption of advanced automation in mining operations and the growing emphasis on recycling construction and demolition waste are also significant market penetration accelerators, pushing the demand for versatile and efficient cone crushers. The market penetration for advanced cone crushing technologies is estimated to reach approximately 65% by the end of the forecast period.
Leading Markets & Segments in Cone Crushers Industry
The Mining and Metallurgy end-user application segment is the dominant market force within the Cone Crushers Industry, driven by the continuous global demand for essential minerals and metals. This sector's reliance on efficient, high-volume crushing for ore preparation, particularly for secondary and tertiary crushing stages, solidifies its leading position. Within the Type segment, Hydraulics cone crushers are experiencing significant growth due to their superior flexibility, adjustable crushing chambers, and ability to handle a wider range of materials with varying hardness, making them increasingly favored over traditional Symons types for complex applications. The Offering segment sees a clear trend towards Mobile Crushers and Portable Crushers, directly correlating with the demand for flexibility in construction and aggregate processing projects, allowing for on-site crushing and reduced transportation costs. The Power Source segment, while Diesel Connection remains prevalent in remote areas, is witnessing a substantial shift towards Electric Connection and Dual Connection models, driven by environmental regulations and the desire for lower operational costs and greater energy efficiency.
- Dominant End-User Application: Mining and Metallurgy
- Key Drivers: Growing global demand for commodities, exploration of new mineral reserves, expansion of existing mining operations, and the need for efficient ore processing.
- Dominance Analysis: This sector requires robust and high-capacity crushing solutions for various stages of mineral extraction and refinement. Cone crushers are indispensable for achieving desired particle sizes and preparing materials for further processing, such as smelting and refining.
- Growing Segment by Type: Hydraulics
- Key Drivers: Enhanced adaptability, finer control over crushing parameters, ability to handle varied feed materials, and reduced wear and tear on components.
- Dominance Analysis: Hydraulic cone crushers offer advanced features like automated tramp iron clearing and adjustable crushing gap, leading to higher productivity and lower maintenance.
- Dominant Offering: Mobile Crushers and Portable Crushers
- Key Drivers: Project mobility, reduced logistics costs, on-site processing capabilities, and flexibility in adapting to changing project locations.
- Dominance Analysis: The construction and aggregate industries increasingly favor mobile solutions for their ability to move directly to job sites, reducing downtime and transportation expenses.
- Emerging Power Source Trend: Electric Connection and Dual Connection
- Key Drivers: Environmental regulations, focus on sustainability, lower operational costs, and improved energy efficiency.
- Dominance Analysis: While diesel remains important, the shift towards electrified infrastructure and hybrid power solutions in many regions is driving the adoption of electric and dual-powered cone crushers.
Cone Crushers Industry Product Developments
Recent product developments in the Cone Crushers Industry are heavily focused on enhancing efficiency, sustainability, and automation. Manufacturers are introducing crushers with advanced hydraulic systems for finer control over crushing parameters and improved material processing capabilities. The integration of digital technologies, including IoT sensors and data analytics, is enabling predictive maintenance and remote monitoring, leading to reduced downtime and optimized operational performance. Furthermore, there's a growing emphasis on developing crushers that consume less energy and produce less waste, aligning with global sustainability initiatives. These innovations provide competitive advantages by offering higher throughput, lower operating costs, and a reduced environmental footprint, directly addressing the evolving needs of the mining, construction, and aggregate processing sectors.
Key Drivers of Cone Crushers Industry Growth
The Cone Crushers Industry's growth is propelled by several key factors. The continuous global demand for aggregates and construction materials, fueled by infrastructure development projects worldwide, is a primary driver. Technological advancements, such as the development of more energy-efficient and automated cone crushers, are enhancing productivity and reducing operational costs for end-users. Favorable economic policies and government investments in infrastructure, particularly in developing nations, further stimulate demand. The increasing adoption of recycling in construction and demolition waste also contributes significantly, as cone crushers are essential for processing these materials into usable aggregates. For instance, the global push for sustainable construction practices is directly boosting the demand for efficient recycling machinery.
Challenges in the Cone Crushers Industry Market
Despite robust growth, the Cone Crushers Industry faces several challenges. Stringent environmental regulations concerning noise and dust emissions necessitate continuous investment in advanced filtration and silencing technologies. Supply chain disruptions, particularly for critical components and raw materials, can impact production timelines and costs. Intense competition among global and regional players often leads to price pressures, impacting profit margins. Furthermore, the high initial capital investment required for advanced cone crushing equipment can be a barrier for smaller enterprises, especially in price-sensitive markets. The increasing complexity of newer models also demands a skilled workforce for operation and maintenance, posing a recruitment and training challenge.
Emerging Opportunities in Cone Crushers Industry
Emerging opportunities in the Cone Crushers Industry lie in the growing demand for specialized crushing solutions for recycling applications, including construction and demolition waste, and electronic waste. The development of smart cone crushers with advanced IoT integration for real-time performance monitoring, predictive maintenance, and remote diagnostics presents a significant avenue for growth and value creation. Strategic partnerships between equipment manufacturers and technology providers can lead to innovative integrated solutions that offer enhanced efficiency and automation. Furthermore, expansion into rapidly developing emerging markets with significant infrastructure development needs offers substantial untapped potential. The increasing global focus on a circular economy also creates opportunities for crushers designed specifically for processing secondary raw materials.
Leading Players in the Cone Crushers Industry Sector
- Metso Corporation
- Keestrack NV
- McCloskey International Limited
- Astec Industries Inc
- Thyssenkrupp AG
- Puzzolana Machinery Fabricators LLP
- Tesab Engineering Ltd
- SANDVIK AB
- WESTPRO Machinery Inc
- FLSmidth & Co A/S
- Terex Corporation
Key Milestones in Cone Crushers Industry Industry
- April 2022: FLSmidth was chosen to provide complete equipment and processing flowsheet, including ore leaching, for Sabina Gold & Silver Corp.'s Goose gold mine in Nunavut, Canada. The order is valued at DKK 270 million and was booked in Q2 2022. The equipment would be delivered in mid-2023, ahead of the mine start-up date in Q1 2025. FLSmidth would supply the jaw crusher, Raptor Cone Crushers, ball mill, VXP-Stirred Mill (secondary grinding), KREBS cyclones, pumps, screens, feeders, and Knelson gravity concentrators. The order also comprises equipment for pre-oxidation and leaching; carbon in pulp (CIP) extraction; absorption, desorption, and refining (ADR); and detoxification. This development highlights FLSmidth's advanced integrated solutions capabilities and strengthens their position in the mining sector.
- March 2022: Sandvik launched its UK373 wheeled cone crusher and surface drills rental fleet in the United States while at the same time displaying its CH440 cone crusher and rock tools display. Sandvik UK373 offers an electrically-driven, closed-circuit crushing solution assembled on a quad-axle trailer frame. Sandvik CH440 is intended for a high-capacity secondary application or a high-reduction tertiary or pebble-crushing application and can also be matched to changes in production through the selection of crushing chambers and an eccentric throw. This launch signifies Sandvik's commitment to providing versatile and adaptable crushing solutions for diverse applications and their expansion into the US rental market.
Strategic Outlook for Cone Crushers Industry Market
The strategic outlook for the Cone Crushers Industry remains highly positive, driven by persistent global demand for essential materials and ongoing infrastructure development. Future growth will be significantly accelerated by the continuous integration of digital technologies, focusing on smart automation, AI-driven analytics for predictive maintenance, and enhanced remote operational capabilities. The industry is poised to capitalize on the burgeoning recycling sector, with a growing emphasis on developing specialized crushers for processing construction and demolition waste. Strategic collaborations and potential mergers and acquisitions will continue to shape the competitive landscape, enabling companies to broaden their product portfolios and expand their geographical reach. Companies that invest in sustainable and energy-efficient solutions, alongside offering comprehensive after-sales services and integrated processing solutions, will likely gain a substantial competitive advantage and secure long-term market leadership.
Cone Crushers Industry Segmentation
-
1. Type
- 1.1. Symons
- 1.2. Hydraulics
- 1.3. Gyratory
- 1.4. Other Types
-
2. Offering
- 2.1. Mobile Crushers
- 2.2. Portable Crushers
- 2.3. Stationary Crushers
-
3. Power Source
- 3.1. Electric Connection
- 3.2. Diesel Connection
- 3.3. Dual Connection
-
4. End-user Application
- 4.1. Mining and Metallurgy
- 4.2. Construction
- 4.3. Aggregate Processing
- 4.4. Demolition
- 4.5. Other End-user Applications
Cone Crushers Industry Segmentation By Geography
-
1. North America
- 1.1. United States
- 1.2. Canada
-
2. Europe
- 2.1. United Kingdom
- 2.2. Germany
- 2.3. France
- 2.4. Rest of Europe
-
3. Asia Pacific
- 3.1. India
- 3.2. China
- 3.3. Japan
- 3.4. Rest of Asia Pacific
-
4. Latin America
- 4.1. Brazil
- 4.2. Argentina
- 4.3. Mexico
- 4.4. Rest of Latin America
-
5. Middle East and Africa
- 5.1. United Arab Emirates
- 5.2. Saudi Arabia
- 5.3. South Africa
- 5.4. Rest of Middle East and Africa
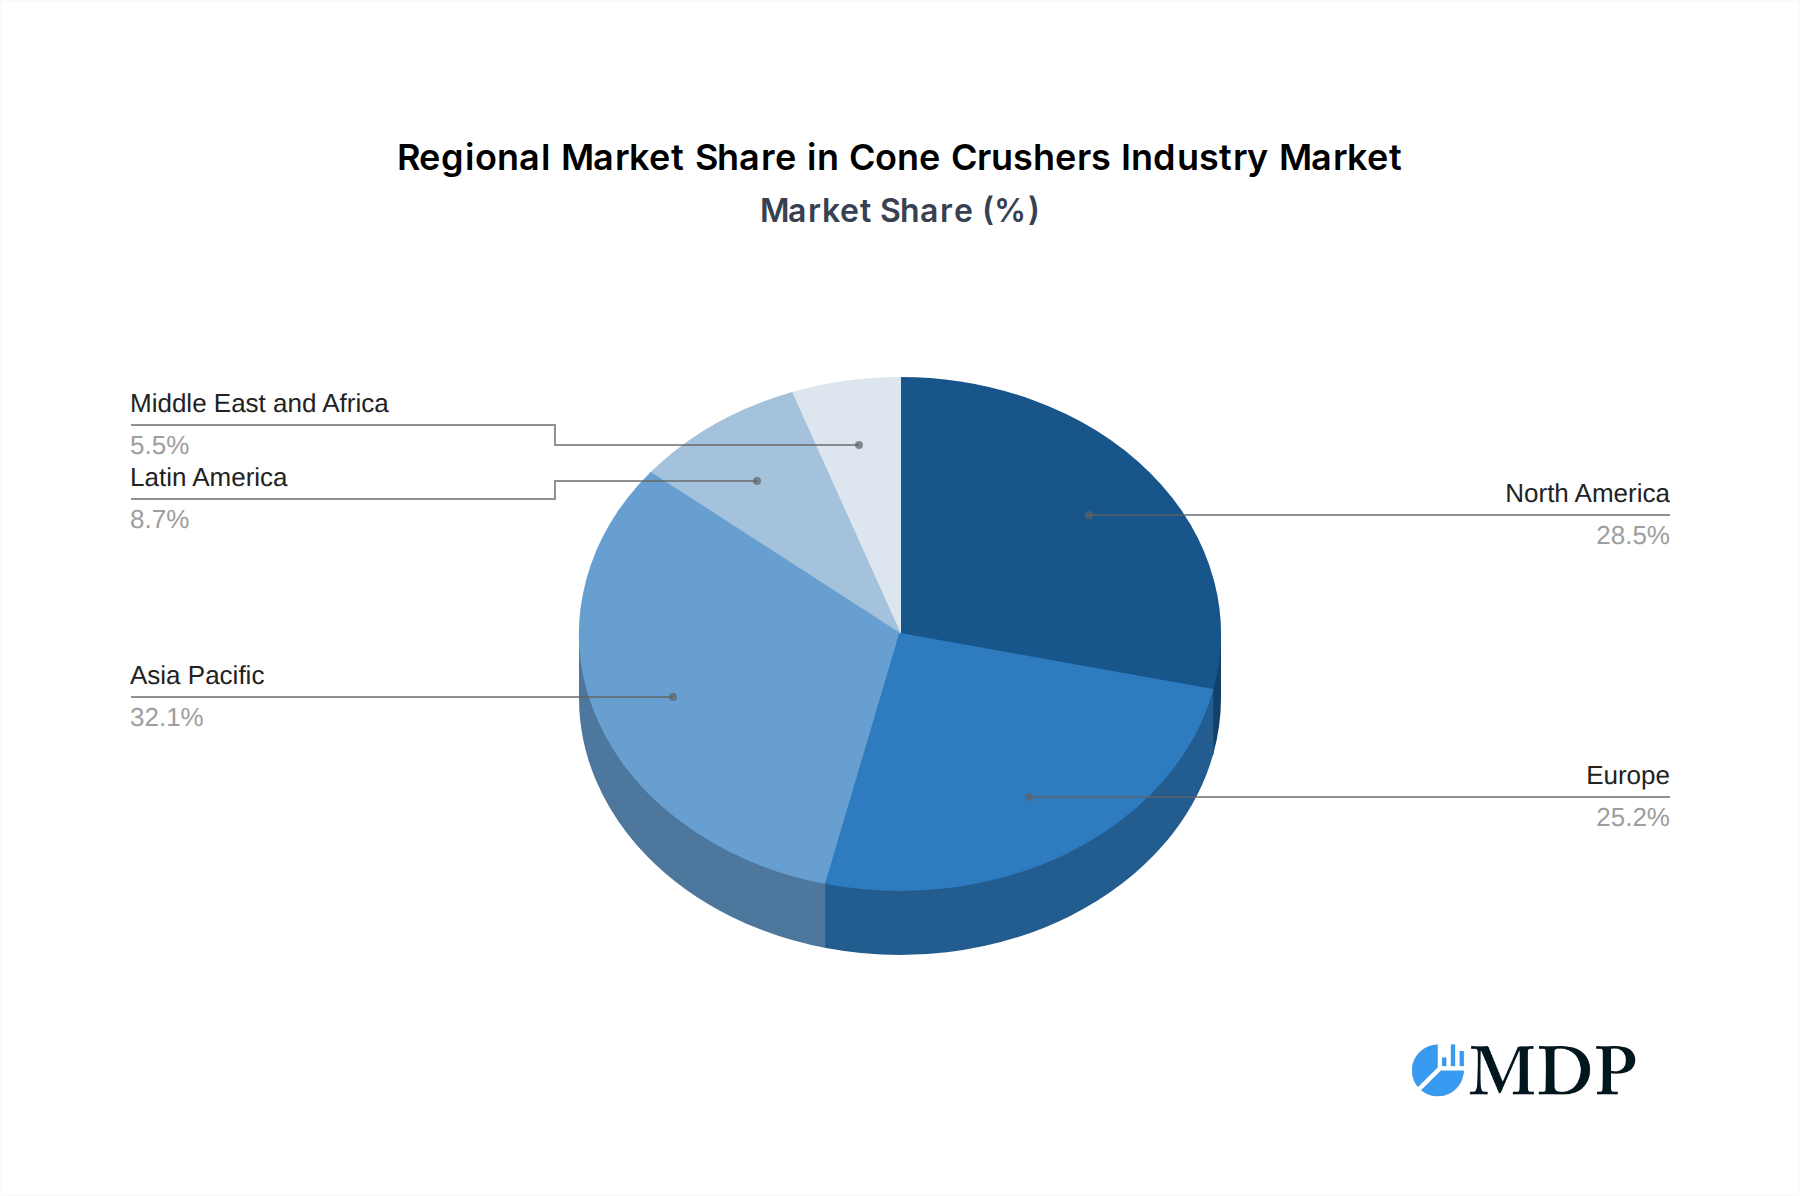
Cone Crushers Industry Regional Market Share
Geographic Coverage of Cone Crushers Industry
Cone Crushers Industry REPORT HIGHLIGHTS
| Aspects | Details |
|---|---|
| Study Period | 2020-2034 |
| Base Year | 2025 |
| Estimated Year | 2026 |
| Forecast Period | 2026-2034 |
| Historical Period | 2020-2025 |
| Growth Rate | CAGR of 5.10% from 2020-2034 |
| Segmentation |
|
Table of Contents
- 1. Introduction
- 1.1. Research Scope
- 1.2. Market Segmentation
- 1.3. Research Objective
- 1.4. Definitions and Assumptions
- 2. Executive Summary
- 2.1. Market Snapshot
- 3. Market Dynamics
- 3.1. Market Drivers
- 3.2. Market Restrains
- 3.3. Market Trends
- 3.4. Market Opportunities
- 4. Market Factor Analysis
- 4.1. Porters Five Forces
- 4.1.1. Bargaining Power of Suppliers
- 4.1.2. Bargaining Power of Buyers
- 4.1.3. Threat of New Entrants
- 4.1.4. Threat of Substitutes
- 4.1.5. Competitive Rivalry
- 4.2. PESTEL analysis
- 4.3. BCG Analysis
- 4.3.1. Stars (High Growth, High Market Share)
- 4.3.2. Cash Cows (Low Growth, High Market Share)
- 4.3.3. Question Mark (High Growth, Low Market Share)
- 4.3.4. Dogs (Low Growth, Low Market Share)
- 4.4. Ansoff Matrix Analysis
- 4.5. Supply Chain Analysis
- 4.6. Regulatory Landscape
- 4.7. Current Market Potential and Opportunity Assessment (TAM–SAM–SOM Framework)
- 4.8. MDP Analyst Note
- 4.1. Porters Five Forces
- 5. Market Analysis, Insights and Forecast 2021-2033
- 5.1. Market Analysis, Insights and Forecast - by Type
- 5.1.1. Symons
- 5.1.2. Hydraulics
- 5.1.3. Gyratory
- 5.1.4. Other Types
- 5.2. Market Analysis, Insights and Forecast - by Offering
- 5.2.1. Mobile Crushers
- 5.2.2. Portable Crushers
- 5.2.3. Stationary Crushers
- 5.3. Market Analysis, Insights and Forecast - by Power Source
- 5.3.1. Electric Connection
- 5.3.2. Diesel Connection
- 5.3.3. Dual Connection
- 5.4. Market Analysis, Insights and Forecast - by End-user Application
- 5.4.1. Mining and Metallurgy
- 5.4.2. Construction
- 5.4.3. Aggregate Processing
- 5.4.4. Demolition
- 5.4.5. Other End-user Applications
- 5.5. Market Analysis, Insights and Forecast - by Region
- 5.5.1. North America
- 5.5.2. Europe
- 5.5.3. Asia Pacific
- 5.5.4. Latin America
- 5.5.5. Middle East and Africa
- 5.1. Market Analysis, Insights and Forecast - by Type
- 6. Global Cone Crushers Industry Analysis, Insights and Forecast, 2021-2033
- 6.1. Market Analysis, Insights and Forecast - by Type
- 6.1.1. Symons
- 6.1.2. Hydraulics
- 6.1.3. Gyratory
- 6.1.4. Other Types
- 6.2. Market Analysis, Insights and Forecast - by Offering
- 6.2.1. Mobile Crushers
- 6.2.2. Portable Crushers
- 6.2.3. Stationary Crushers
- 6.3. Market Analysis, Insights and Forecast - by Power Source
- 6.3.1. Electric Connection
- 6.3.2. Diesel Connection
- 6.3.3. Dual Connection
- 6.4. Market Analysis, Insights and Forecast - by End-user Application
- 6.4.1. Mining and Metallurgy
- 6.4.2. Construction
- 6.4.3. Aggregate Processing
- 6.4.4. Demolition
- 6.4.5. Other End-user Applications
- 6.1. Market Analysis, Insights and Forecast - by Type
- 7. North America Cone Crushers Industry Analysis, Insights and Forecast, 2020-2032
- 7.1. Market Analysis, Insights and Forecast - by Type
- 7.1.1. Symons
- 7.1.2. Hydraulics
- 7.1.3. Gyratory
- 7.1.4. Other Types
- 7.2. Market Analysis, Insights and Forecast - by Offering
- 7.2.1. Mobile Crushers
- 7.2.2. Portable Crushers
- 7.2.3. Stationary Crushers
- 7.3. Market Analysis, Insights and Forecast - by Power Source
- 7.3.1. Electric Connection
- 7.3.2. Diesel Connection
- 7.3.3. Dual Connection
- 7.4. Market Analysis, Insights and Forecast - by End-user Application
- 7.4.1. Mining and Metallurgy
- 7.4.2. Construction
- 7.4.3. Aggregate Processing
- 7.4.4. Demolition
- 7.4.5. Other End-user Applications
- 7.1. Market Analysis, Insights and Forecast - by Type
- 8. Europe Cone Crushers Industry Analysis, Insights and Forecast, 2020-2032
- 8.1. Market Analysis, Insights and Forecast - by Type
- 8.1.1. Symons
- 8.1.2. Hydraulics
- 8.1.3. Gyratory
- 8.1.4. Other Types
- 8.2. Market Analysis, Insights and Forecast - by Offering
- 8.2.1. Mobile Crushers
- 8.2.2. Portable Crushers
- 8.2.3. Stationary Crushers
- 8.3. Market Analysis, Insights and Forecast - by Power Source
- 8.3.1. Electric Connection
- 8.3.2. Diesel Connection
- 8.3.3. Dual Connection
- 8.4. Market Analysis, Insights and Forecast - by End-user Application
- 8.4.1. Mining and Metallurgy
- 8.4.2. Construction
- 8.4.3. Aggregate Processing
- 8.4.4. Demolition
- 8.4.5. Other End-user Applications
- 8.1. Market Analysis, Insights and Forecast - by Type
- 9. Asia Pacific Cone Crushers Industry Analysis, Insights and Forecast, 2020-2032
- 9.1. Market Analysis, Insights and Forecast - by Type
- 9.1.1. Symons
- 9.1.2. Hydraulics
- 9.1.3. Gyratory
- 9.1.4. Other Types
- 9.2. Market Analysis, Insights and Forecast - by Offering
- 9.2.1. Mobile Crushers
- 9.2.2. Portable Crushers
- 9.2.3. Stationary Crushers
- 9.3. Market Analysis, Insights and Forecast - by Power Source
- 9.3.1. Electric Connection
- 9.3.2. Diesel Connection
- 9.3.3. Dual Connection
- 9.4. Market Analysis, Insights and Forecast - by End-user Application
- 9.4.1. Mining and Metallurgy
- 9.4.2. Construction
- 9.4.3. Aggregate Processing
- 9.4.4. Demolition
- 9.4.5. Other End-user Applications
- 9.1. Market Analysis, Insights and Forecast - by Type
- 10. Latin America Cone Crushers Industry Analysis, Insights and Forecast, 2020-2032
- 10.1. Market Analysis, Insights and Forecast - by Type
- 10.1.1. Symons
- 10.1.2. Hydraulics
- 10.1.3. Gyratory
- 10.1.4. Other Types
- 10.2. Market Analysis, Insights and Forecast - by Offering
- 10.2.1. Mobile Crushers
- 10.2.2. Portable Crushers
- 10.2.3. Stationary Crushers
- 10.3. Market Analysis, Insights and Forecast - by Power Source
- 10.3.1. Electric Connection
- 10.3.2. Diesel Connection
- 10.3.3. Dual Connection
- 10.4. Market Analysis, Insights and Forecast - by End-user Application
- 10.4.1. Mining and Metallurgy
- 10.4.2. Construction
- 10.4.3. Aggregate Processing
- 10.4.4. Demolition
- 10.4.5. Other End-user Applications
- 10.1. Market Analysis, Insights and Forecast - by Type
- 11. Middle East and Africa Cone Crushers Industry Analysis, Insights and Forecast, 2020-2032
- 11.1. Market Analysis, Insights and Forecast - by Type
- 11.1.1. Symons
- 11.1.2. Hydraulics
- 11.1.3. Gyratory
- 11.1.4. Other Types
- 11.2. Market Analysis, Insights and Forecast - by Offering
- 11.2.1. Mobile Crushers
- 11.2.2. Portable Crushers
- 11.2.3. Stationary Crushers
- 11.3. Market Analysis, Insights and Forecast - by Power Source
- 11.3.1. Electric Connection
- 11.3.2. Diesel Connection
- 11.3.3. Dual Connection
- 11.4. Market Analysis, Insights and Forecast - by End-user Application
- 11.4.1. Mining and Metallurgy
- 11.4.2. Construction
- 11.4.3. Aggregate Processing
- 11.4.4. Demolition
- 11.4.5. Other End-user Applications
- 11.1. Market Analysis, Insights and Forecast - by Type
- 12. Competitive Analysis
- 12.1. Company Profiles
- 12.1.1 Metso Corporation
- 12.1.1.1. Company Overview
- 12.1.1.2. Products
- 12.1.1.3. Company Financials
- 12.1.1.4. SWOT Analysis
- 12.1.2 Keestrack NV
- 12.1.2.1. Company Overview
- 12.1.2.2. Products
- 12.1.2.3. Company Financials
- 12.1.2.4. SWOT Analysis
- 12.1.3 McCloskey International Limited
- 12.1.3.1. Company Overview
- 12.1.3.2. Products
- 12.1.3.3. Company Financials
- 12.1.3.4. SWOT Analysis
- 12.1.4 Astec Industries Inc
- 12.1.4.1. Company Overview
- 12.1.4.2. Products
- 12.1.4.3. Company Financials
- 12.1.4.4. SWOT Analysis
- 12.1.5 Thyssenkrupp AG
- 12.1.5.1. Company Overview
- 12.1.5.2. Products
- 12.1.5.3. Company Financials
- 12.1.5.4. SWOT Analysis
- 12.1.6 Puzzolana Machinery Fabricators LLP
- 12.1.6.1. Company Overview
- 12.1.6.2. Products
- 12.1.6.3. Company Financials
- 12.1.6.4. SWOT Analysis
- 12.1.7 Tesab Engineering Ltd*List Not Exhaustive
- 12.1.7.1. Company Overview
- 12.1.7.2. Products
- 12.1.7.3. Company Financials
- 12.1.7.4. SWOT Analysis
- 12.1.8 SANDVIK AB
- 12.1.8.1. Company Overview
- 12.1.8.2. Products
- 12.1.8.3. Company Financials
- 12.1.8.4. SWOT Analysis
- 12.1.9 WESTPRO Machinery Inc
- 12.1.9.1. Company Overview
- 12.1.9.2. Products
- 12.1.9.3. Company Financials
- 12.1.9.4. SWOT Analysis
- 12.1.10 FLSmidth & Co A/S
- 12.1.10.1. Company Overview
- 12.1.10.2. Products
- 12.1.10.3. Company Financials
- 12.1.10.4. SWOT Analysis
- 12.1.11 Terex Corporation
- 12.1.11.1. Company Overview
- 12.1.11.2. Products
- 12.1.11.3. Company Financials
- 12.1.11.4. SWOT Analysis
- 12.1.1 Metso Corporation
- 12.2. Market Entropy
- 12.2.1 Company's Key Areas Served
- 12.2.2 Recent Developments
- 12.3. Company Market Share Analysis 2025
- 12.3.1 Top 5 Companies Market Share Analysis
- 12.3.2 Top 3 Companies Market Share Analysis
- 12.4. List of Potential Customers
- 13. Research Methodology
List of Figures
- Figure 1: Global Cone Crushers Industry Revenue Breakdown (Million, %) by Region 2025 & 2033
- Figure 2: North America Cone Crushers Industry Revenue (Million), by Type 2025 & 2033
- Figure 3: North America Cone Crushers Industry Revenue Share (%), by Type 2025 & 2033
- Figure 4: North America Cone Crushers Industry Revenue (Million), by Offering 2025 & 2033
- Figure 5: North America Cone Crushers Industry Revenue Share (%), by Offering 2025 & 2033
- Figure 6: North America Cone Crushers Industry Revenue (Million), by Power Source 2025 & 2033
- Figure 7: North America Cone Crushers Industry Revenue Share (%), by Power Source 2025 & 2033
- Figure 8: North America Cone Crushers Industry Revenue (Million), by End-user Application 2025 & 2033
- Figure 9: North America Cone Crushers Industry Revenue Share (%), by End-user Application 2025 & 2033
- Figure 10: North America Cone Crushers Industry Revenue (Million), by Country 2025 & 2033
- Figure 11: North America Cone Crushers Industry Revenue Share (%), by Country 2025 & 2033
- Figure 12: Europe Cone Crushers Industry Revenue (Million), by Type 2025 & 2033
- Figure 13: Europe Cone Crushers Industry Revenue Share (%), by Type 2025 & 2033
- Figure 14: Europe Cone Crushers Industry Revenue (Million), by Offering 2025 & 2033
- Figure 15: Europe Cone Crushers Industry Revenue Share (%), by Offering 2025 & 2033
- Figure 16: Europe Cone Crushers Industry Revenue (Million), by Power Source 2025 & 2033
- Figure 17: Europe Cone Crushers Industry Revenue Share (%), by Power Source 2025 & 2033
- Figure 18: Europe Cone Crushers Industry Revenue (Million), by End-user Application 2025 & 2033
- Figure 19: Europe Cone Crushers Industry Revenue Share (%), by End-user Application 2025 & 2033
- Figure 20: Europe Cone Crushers Industry Revenue (Million), by Country 2025 & 2033
- Figure 21: Europe Cone Crushers Industry Revenue Share (%), by Country 2025 & 2033
- Figure 22: Asia Pacific Cone Crushers Industry Revenue (Million), by Type 2025 & 2033
- Figure 23: Asia Pacific Cone Crushers Industry Revenue Share (%), by Type 2025 & 2033
- Figure 24: Asia Pacific Cone Crushers Industry Revenue (Million), by Offering 2025 & 2033
- Figure 25: Asia Pacific Cone Crushers Industry Revenue Share (%), by Offering 2025 & 2033
- Figure 26: Asia Pacific Cone Crushers Industry Revenue (Million), by Power Source 2025 & 2033
- Figure 27: Asia Pacific Cone Crushers Industry Revenue Share (%), by Power Source 2025 & 2033
- Figure 28: Asia Pacific Cone Crushers Industry Revenue (Million), by End-user Application 2025 & 2033
- Figure 29: Asia Pacific Cone Crushers Industry Revenue Share (%), by End-user Application 2025 & 2033
- Figure 30: Asia Pacific Cone Crushers Industry Revenue (Million), by Country 2025 & 2033
- Figure 31: Asia Pacific Cone Crushers Industry Revenue Share (%), by Country 2025 & 2033
- Figure 32: Latin America Cone Crushers Industry Revenue (Million), by Type 2025 & 2033
- Figure 33: Latin America Cone Crushers Industry Revenue Share (%), by Type 2025 & 2033
- Figure 34: Latin America Cone Crushers Industry Revenue (Million), by Offering 2025 & 2033
- Figure 35: Latin America Cone Crushers Industry Revenue Share (%), by Offering 2025 & 2033
- Figure 36: Latin America Cone Crushers Industry Revenue (Million), by Power Source 2025 & 2033
- Figure 37: Latin America Cone Crushers Industry Revenue Share (%), by Power Source 2025 & 2033
- Figure 38: Latin America Cone Crushers Industry Revenue (Million), by End-user Application 2025 & 2033
- Figure 39: Latin America Cone Crushers Industry Revenue Share (%), by End-user Application 2025 & 2033
- Figure 40: Latin America Cone Crushers Industry Revenue (Million), by Country 2025 & 2033
- Figure 41: Latin America Cone Crushers Industry Revenue Share (%), by Country 2025 & 2033
- Figure 42: Middle East and Africa Cone Crushers Industry Revenue (Million), by Type 2025 & 2033
- Figure 43: Middle East and Africa Cone Crushers Industry Revenue Share (%), by Type 2025 & 2033
- Figure 44: Middle East and Africa Cone Crushers Industry Revenue (Million), by Offering 2025 & 2033
- Figure 45: Middle East and Africa Cone Crushers Industry Revenue Share (%), by Offering 2025 & 2033
- Figure 46: Middle East and Africa Cone Crushers Industry Revenue (Million), by Power Source 2025 & 2033
- Figure 47: Middle East and Africa Cone Crushers Industry Revenue Share (%), by Power Source 2025 & 2033
- Figure 48: Middle East and Africa Cone Crushers Industry Revenue (Million), by End-user Application 2025 & 2033
- Figure 49: Middle East and Africa Cone Crushers Industry Revenue Share (%), by End-user Application 2025 & 2033
- Figure 50: Middle East and Africa Cone Crushers Industry Revenue (Million), by Country 2025 & 2033
- Figure 51: Middle East and Africa Cone Crushers Industry Revenue Share (%), by Country 2025 & 2033
List of Tables
- Table 1: Global Cone Crushers Industry Revenue Million Forecast, by Type 2020 & 2033
- Table 2: Global Cone Crushers Industry Revenue Million Forecast, by Offering 2020 & 2033
- Table 3: Global Cone Crushers Industry Revenue Million Forecast, by Power Source 2020 & 2033
- Table 4: Global Cone Crushers Industry Revenue Million Forecast, by End-user Application 2020 & 2033
- Table 5: Global Cone Crushers Industry Revenue Million Forecast, by Region 2020 & 2033
- Table 6: Global Cone Crushers Industry Revenue Million Forecast, by Type 2020 & 2033
- Table 7: Global Cone Crushers Industry Revenue Million Forecast, by Offering 2020 & 2033
- Table 8: Global Cone Crushers Industry Revenue Million Forecast, by Power Source 2020 & 2033
- Table 9: Global Cone Crushers Industry Revenue Million Forecast, by End-user Application 2020 & 2033
- Table 10: Global Cone Crushers Industry Revenue Million Forecast, by Country 2020 & 2033
- Table 11: United States Cone Crushers Industry Revenue (Million) Forecast, by Application 2020 & 2033
- Table 12: Canada Cone Crushers Industry Revenue (Million) Forecast, by Application 2020 & 2033
- Table 13: Global Cone Crushers Industry Revenue Million Forecast, by Type 2020 & 2033
- Table 14: Global Cone Crushers Industry Revenue Million Forecast, by Offering 2020 & 2033
- Table 15: Global Cone Crushers Industry Revenue Million Forecast, by Power Source 2020 & 2033
- Table 16: Global Cone Crushers Industry Revenue Million Forecast, by End-user Application 2020 & 2033
- Table 17: Global Cone Crushers Industry Revenue Million Forecast, by Country 2020 & 2033
- Table 18: United Kingdom Cone Crushers Industry Revenue (Million) Forecast, by Application 2020 & 2033
- Table 19: Germany Cone Crushers Industry Revenue (Million) Forecast, by Application 2020 & 2033
- Table 20: France Cone Crushers Industry Revenue (Million) Forecast, by Application 2020 & 2033
- Table 21: Rest of Europe Cone Crushers Industry Revenue (Million) Forecast, by Application 2020 & 2033
- Table 22: Global Cone Crushers Industry Revenue Million Forecast, by Type 2020 & 2033
- Table 23: Global Cone Crushers Industry Revenue Million Forecast, by Offering 2020 & 2033
- Table 24: Global Cone Crushers Industry Revenue Million Forecast, by Power Source 2020 & 2033
- Table 25: Global Cone Crushers Industry Revenue Million Forecast, by End-user Application 2020 & 2033
- Table 26: Global Cone Crushers Industry Revenue Million Forecast, by Country 2020 & 2033
- Table 27: India Cone Crushers Industry Revenue (Million) Forecast, by Application 2020 & 2033
- Table 28: China Cone Crushers Industry Revenue (Million) Forecast, by Application 2020 & 2033
- Table 29: Japan Cone Crushers Industry Revenue (Million) Forecast, by Application 2020 & 2033
- Table 30: Rest of Asia Pacific Cone Crushers Industry Revenue (Million) Forecast, by Application 2020 & 2033
- Table 31: Global Cone Crushers Industry Revenue Million Forecast, by Type 2020 & 2033
- Table 32: Global Cone Crushers Industry Revenue Million Forecast, by Offering 2020 & 2033
- Table 33: Global Cone Crushers Industry Revenue Million Forecast, by Power Source 2020 & 2033
- Table 34: Global Cone Crushers Industry Revenue Million Forecast, by End-user Application 2020 & 2033
- Table 35: Global Cone Crushers Industry Revenue Million Forecast, by Country 2020 & 2033
- Table 36: Brazil Cone Crushers Industry Revenue (Million) Forecast, by Application 2020 & 2033
- Table 37: Argentina Cone Crushers Industry Revenue (Million) Forecast, by Application 2020 & 2033
- Table 38: Mexico Cone Crushers Industry Revenue (Million) Forecast, by Application 2020 & 2033
- Table 39: Rest of Latin America Cone Crushers Industry Revenue (Million) Forecast, by Application 2020 & 2033
- Table 40: Global Cone Crushers Industry Revenue Million Forecast, by Type 2020 & 2033
- Table 41: Global Cone Crushers Industry Revenue Million Forecast, by Offering 2020 & 2033
- Table 42: Global Cone Crushers Industry Revenue Million Forecast, by Power Source 2020 & 2033
- Table 43: Global Cone Crushers Industry Revenue Million Forecast, by End-user Application 2020 & 2033
- Table 44: Global Cone Crushers Industry Revenue Million Forecast, by Country 2020 & 2033
- Table 45: United Arab Emirates Cone Crushers Industry Revenue (Million) Forecast, by Application 2020 & 2033
- Table 46: Saudi Arabia Cone Crushers Industry Revenue (Million) Forecast, by Application 2020 & 2033
- Table 47: South Africa Cone Crushers Industry Revenue (Million) Forecast, by Application 2020 & 2033
- Table 48: Rest of Middle East and Africa Cone Crushers Industry Revenue (Million) Forecast, by Application 2020 & 2033
Frequently Asked Questions
1. What is the projected Compound Annual Growth Rate (CAGR) of the Cone Crushers Industry?
The projected CAGR is approximately 5.10%.
2. Which companies are prominent players in the Cone Crushers Industry?
Key companies in the market include Metso Corporation, Keestrack NV, McCloskey International Limited, Astec Industries Inc, Thyssenkrupp AG, Puzzolana Machinery Fabricators LLP, Tesab Engineering Ltd*List Not Exhaustive, SANDVIK AB, WESTPRO Machinery Inc, FLSmidth & Co A/S, Terex Corporation.
3. What are the main segments of the Cone Crushers Industry?
The market segments include Type, Offering, Power Source, End-user Application.
4. Can you provide details about the market size?
The market size is estimated to be USD 1.86 Million as of 2022.
5. What are some drivers contributing to market growth?
Increased Demand in the Mining Sector in the Emerging Market; Growth of the Construction Industry.
6. What are the notable trends driving market growth?
The Construction Segment is Expected to Hold a Major Market Share.
7. Are there any restraints impacting market growth?
Effects of Carbon Emission from Machinery.
8. Can you provide examples of recent developments in the market?
April 2022 - FLSmidth was chosen to provide complete equipment and processing flowsheet, including ore leaching, for Sabina Gold & Silver Corp.'s Goose gold mine in Nunavut, Canada. The order is valued at DKK 270 million and was booked in Q2 2022. The equipment would be delivered in mid-2023, ahead of the mine start-up date in Q1 2025. FLSmidth would supply the jaw crusher, Raptor Cone Crushers, ball mill, VXP-Stirred Mill (secondary grinding), KREBS cyclones, pumps, screens, feeders, and Knelson gravity concentrators. The order also comprises equipment for pre-oxidation and leaching; carbon in pulp (CIP) extraction; absorption, desorption, and refining (ADR); and detoxification.
9. What pricing options are available for accessing the report?
Pricing options include single-user, multi-user, and enterprise licenses priced at USD 4750, USD 5250, and USD 8750 respectively.
10. Is the market size provided in terms of value or volume?
The market size is provided in terms of value, measured in Million.
11. Are there any specific market keywords associated with the report?
Yes, the market keyword associated with the report is "Cone Crushers Industry," which aids in identifying and referencing the specific market segment covered.
12. How do I determine which pricing option suits my needs best?
The pricing options vary based on user requirements and access needs. Individual users may opt for single-user licenses, while businesses requiring broader access may choose multi-user or enterprise licenses for cost-effective access to the report.
13. Are there any additional resources or data provided in the Cone Crushers Industry report?
While the report offers comprehensive insights, it's advisable to review the specific contents or supplementary materials provided to ascertain if additional resources or data are available.
14. How can I stay updated on further developments or reports in the Cone Crushers Industry?
To stay informed about further developments, trends, and reports in the Cone Crushers Industry, consider subscribing to industry newsletters, following relevant companies and organizations, or regularly checking reputable industry news sources and publications.
Methodology
Step 1 - Identification of Relevant Samples Size from Population Database


Step 2 - Approaches for Defining Global Market Size (Value, Volume* & Price*)

Note*: In applicable scenarios
Step 3 - Data Sources
Primary Research
- Web Analytics
- Survey Reports
- Research Institute
- Latest Research Reports
- Opinion Leaders
Secondary Research
- Annual Reports
- White Paper
- Latest Press Release
- Industry Association
- Paid Database
- Investor Presentations

Step 4 - Data Triangulation
Involves using different sources of information in order to increase the validity of a study
These sources are likely to be stakeholders in a program - participants, other researchers, program staff, other community members, and so on.
Then we put all data in single framework & apply various statistical tools to find out the dynamic on the market.
During the analysis stage, feedback from the stakeholder groups would be compared to determine areas of agreement as well as areas of divergence