

Key Insights
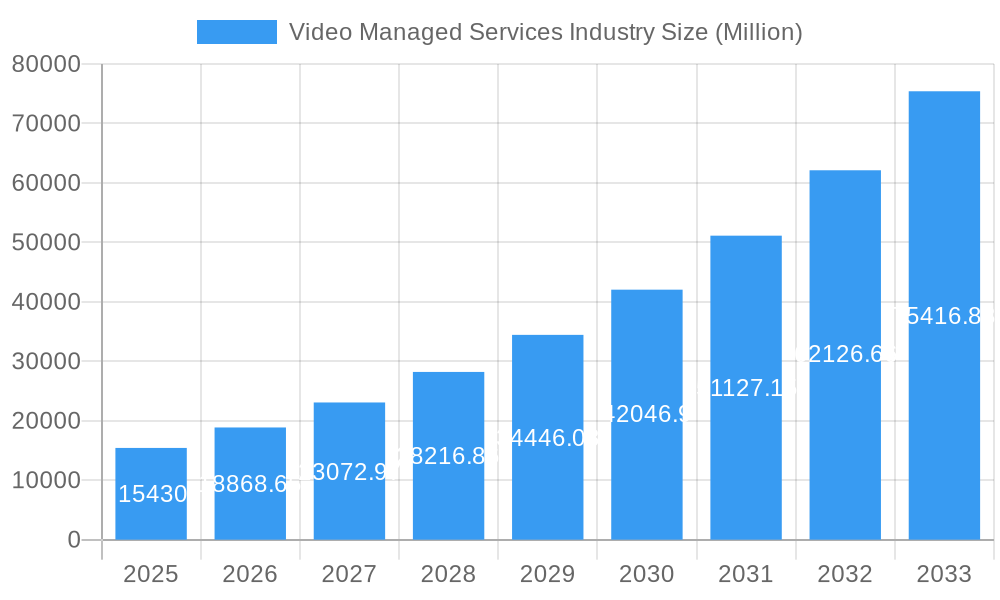
The Video Managed Services market is experiencing robust growth, projected to reach \$15.43 billion in 2025 and exhibiting a Compound Annual Growth Rate (CAGR) of 22.25% from 2025 to 2033. This expansion is driven by several key factors. The increasing adoption of cloud-based solutions for video conferencing and collaboration is a significant catalyst, offering businesses scalability, cost-effectiveness, and enhanced accessibility. Furthermore, the rising demand for high-quality video communication across various sectors, including education, healthcare, and finance, fuels market growth. The shift towards hybrid and remote work models further accelerates the need for reliable and secure video managed services. Technological advancements, such as improved bandwidth availability and the emergence of 5G networks, are also contributing to market expansion. Segmentation analysis reveals that the Business-to-Business (B2B) segment currently dominates the market, driven by large enterprises' need for sophisticated video conferencing solutions. However, the Business-to-Consumer (B2C) segment shows promising growth potential, particularly with the increasing use of video for personal communication and entertainment. Geographically, North America and Europe are currently leading the market, but the Asia-Pacific region is expected to demonstrate significant growth in the coming years due to increasing digitalization and economic development.
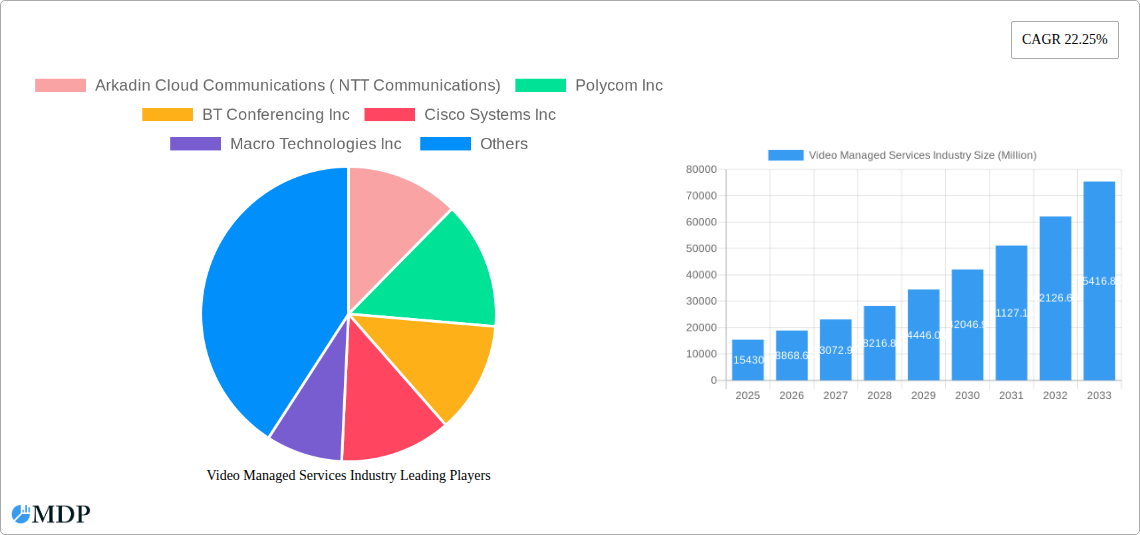
Video Managed Services Industry Market Size (In Billion)
Despite the positive outlook, certain restraints could impact market growth. These include concerns regarding data security and privacy, the need for robust cybersecurity measures, and the complexity associated with integrating video conferencing systems into existing IT infrastructure. Competition among established players and emerging vendors is also intensifying, requiring ongoing innovation and strategic partnerships to maintain a competitive edge. The software segment currently holds a larger share compared to the hardware segment, a trend projected to continue driven by increasing software-defined solutions. Smaller and medium-sized enterprises (SMEs) are a rapidly expanding segment of the market, attracted by the cost-effectiveness and ease of use offered by cloud-based video managed services. Companies such as Arkadin, Polycom, Cisco, and others are actively competing and innovating to capture market share within this dynamic and evolving landscape.
Video Managed Services Industry Company Market Share
Video Managed Services Market Report: 2019-2033 Forecast
This comprehensive report provides a detailed analysis of the Video Managed Services industry, offering invaluable insights for stakeholders seeking to navigate this dynamic market. With a study period spanning 2019-2033, a base year of 2025, and a forecast period of 2025-2033, this report unveils crucial trends, challenges, and opportunities shaping the future of video managed services. The market is expected to reach xx Million by 2033, exhibiting a robust CAGR of xx%.
Video Managed Services Industry Market Dynamics & Concentration
The Video Managed Services market exhibits a moderately concentrated landscape, with key players like Arkadin Cloud Communications (NTT Communications), Polycom Inc, BT Conferencing Inc, Cisco Systems Inc, Macro Technologies Inc, Applied Global Technologies, Dimension Data, AVI-SPL Inc, ZTE Enterprise, AT&T Business, Telus Communications, and Vega Global vying for market share. Market concentration is influenced by factors including technological advancements, regulatory landscapes, and strategic mergers and acquisitions (M&A).
- Market Share: The top 5 players collectively hold approximately xx% of the market share in 2025, indicating a competitive yet consolidated structure.
- Innovation Drivers: Continuous advancements in cloud technologies, AI-powered analytics, and enhanced security features are driving innovation and market expansion.
- Regulatory Frameworks: Government regulations concerning data privacy and security significantly influence market dynamics, particularly in sectors like healthcare and finance.
- Product Substitutes: While video conferencing is the primary application, substitute technologies like traditional telephony and email communication need to be considered in the analysis.
- End-User Trends: The increasing adoption of remote work models, coupled with the rising demand for seamless collaboration tools, significantly fuels market growth.
- M&A Activities: The industry has witnessed xx M&A deals in the historical period (2019-2024), indicating strategic consolidation among players seeking scale and enhanced capabilities.
Video Managed Services Industry Industry Trends & Analysis
The Video Managed Services market demonstrates significant growth potential, driven by the increasing adoption of cloud-based solutions, the growing demand for high-definition video conferencing, and the expanding use of video analytics across various industries. The market is witnessing a shift towards software-defined video solutions and an increased focus on security and interoperability.
The market is projected to reach xx Million by 2033, with a CAGR of xx% during the forecast period (2025-2033). Market penetration is increasing across various sectors, with significant growth observed in the BFSI, healthcare, and education industries. Technological advancements such as 5G network deployment and the adoption of AI-powered video analytics contribute to this growth. Consumer preferences are leaning towards user-friendly, secure, and scalable solutions that seamlessly integrate with existing IT infrastructure.
Leading Markets & Segments in Video Managed Services Industry
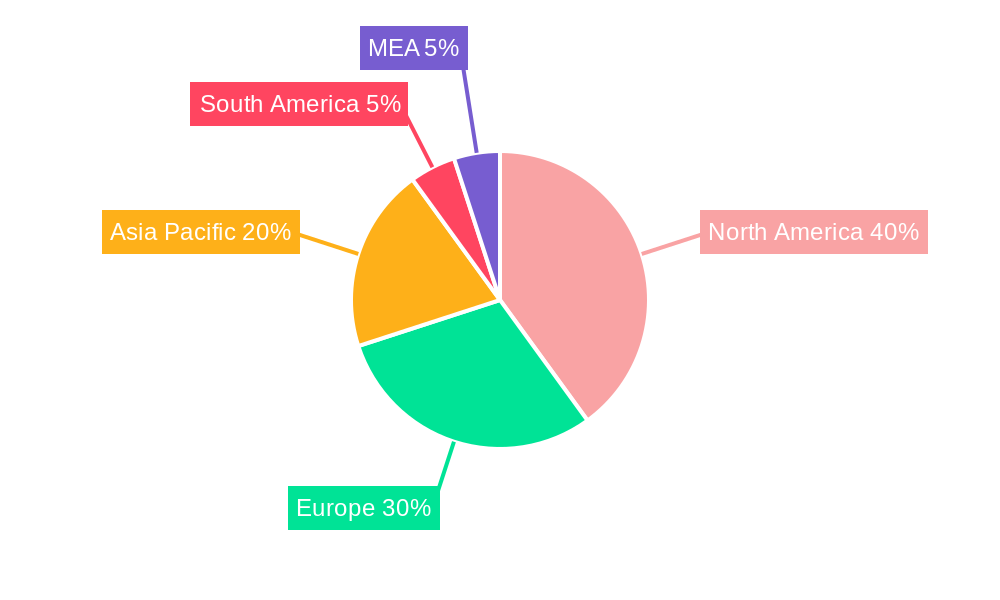
The Business-to-Business (B2B) segment dominates the Video Managed Services market, driven by the increased need for efficient and secure communication among enterprises. North America currently holds the largest market share.
Key Drivers:
- By Application:
- Business-to-Business (B2B): High demand for remote collaboration and communication within enterprises.
- Business-to-Consumer (B2C): Growth driven by increasing adoption of video streaming and video conferencing applications among consumers.
- By Type:
- Software: The increasing popularity of cloud-based video conferencing platforms is driving significant growth.
- Hardware: Demand for high-quality video conferencing equipment and infrastructure remains significant.
- By Enterprise Size:
- Large Enterprises: Larger organizations are readily adopting sophisticated solutions for enhanced collaboration and communication capabilities.
- Small & Medium Enterprises (SMEs): SMEs are increasingly adopting cost-effective and cloud-based solutions.
Dominance Analysis: North America’s dominance is attributed to higher technological adoption rates, robust IT infrastructure, and the presence of major players in the region. Economic policies promoting digital transformation further amplify market growth. Asia Pacific is expected to witness significant growth in the coming years due to increasing digitalization and investment in 5G infrastructure.
Video Managed Services Industry Product Developments
Recent product developments showcase a strong focus on enhanced security features, integration with AI-powered analytics, and improved user experience. The market is witnessing the emergence of integrated platforms that combine video conferencing with other collaboration tools, offering a comprehensive solution. This trend reflects the need for more streamlined and secure communication systems across organizations. These advancements are improving market fit by addressing the needs for enhanced security, scalability, and user-friendliness.
Key Drivers of Video Managed Services Industry Growth
The growth of the Video Managed Services industry is propelled by several factors:
- Technological Advancements: Improvements in video compression technology, AI-powered analytics, and the emergence of 5G are key drivers.
- Economic Factors: The rising adoption of remote work models and the increase in global business collaborations are fuelling market expansion.
- Regulatory Factors: Government initiatives promoting digitalization and improving cybersecurity infrastructure are creating favorable market conditions.
Challenges in the Video Managed Services Industry Market
The Video Managed Services industry faces challenges such as:
- Regulatory Hurdles: Strict data privacy regulations and compliance requirements can impact market growth. These can lead to xx Million in lost revenue annually.
- Supply Chain Issues: Disruptions in the global supply chain can affect the availability of hardware and software components.
- Competitive Pressures: Intense competition among established players and new entrants necessitates continuous innovation and differentiation.
Emerging Opportunities in Video Managed Services Industry
The Video Managed Services market presents several emerging opportunities, including:
- Technological Breakthroughs: Advances in AI, VR/AR, and edge computing are opening new avenues for innovation and market expansion.
- Strategic Partnerships: Collaborations between technology providers and communication service providers can unlock new market segments.
- Market Expansion Strategies: Targeting emerging economies and underserved sectors presents significant growth potential.
Leading Players in the Video Managed Services Industry Sector
- Arkadin Cloud Communications (NTT Communications)
- Polycom Inc
- BT Conferencing Inc
- Cisco Systems Inc
- Macro Technologies Inc
- Applied Global Technologies
- Dimension Data
- AVI-SPL Inc
- ZTE Enterprise
- AT&T Business
- Telus Communications
- Vega Global
Key Milestones in Video Managed Services Industry Industry
- August 2023: Quantum Corporation partnered with Tiger Surveillance to deliver end-to-end solutions for long-term video surveillance data archiving. This partnership expands the market for video data management and storage solutions.
- June 2023: Check Point Software Technologies Ltd. partnered with TELUS to launch the TELUS Cloud Security Posture Management (CSPM) service in Canada. This signifies the growing importance of cybersecurity in cloud-based video managed services.
Strategic Outlook for Video Managed Services Industry Market
The Video Managed Services market exhibits strong growth potential driven by technological advancements, increasing digitalization, and the growing demand for seamless collaboration tools. Strategic partnerships, focusing on innovation and expanding into emerging markets, will be crucial for success. The future of the market lies in delivering secure, scalable, and AI-powered solutions that meet the evolving needs of businesses and consumers.
Video Managed Services Industry Segmentation
-
1. Type
- 1.1. Software
- 1.2. Hardware
-
2. Enterprise Size
- 2.1. Large Enterprise
- 2.2. Small & Medium Enterprise
-
3. Applications
- 3.1. Business to Business
- 3.2. Business to Consumer
Video Managed Services Industry Segmentation By Geography
- 1. North America
- 2. Europe
- 3. Asia Pacific
- 4. Rest of the World
Video Managed Services Industry Regional Market Share
Geographic Coverage of Video Managed Services Industry
Video Managed Services Industry REPORT HIGHLIGHTS
| Aspects | Details |
|---|---|
| Study Period | 2020-2034 |
| Base Year | 2025 |
| Estimated Year | 2026 |
| Forecast Period | 2026-2034 |
| Historical Period | 2020-2025 |
| Growth Rate | CAGR of 22.25% from 2020-2034 |
| Segmentation |
|
Table of Contents
- 1. Introduction
- 1.1. Research Scope
- 1.2. Market Segmentation
- 1.3. Research Objective
- 1.4. Definitions and Assumptions
- 2. Executive Summary
- 2.1. Market Snapshot
- 3. Market Dynamics
- 3.1. Market Drivers
- 3.2. Market Restrains
- 3.3. Market Trends
- 3.4. Market Opportunities
- 4. Market Factor Analysis
- 4.1. Porters Five Forces
- 4.1.1. Bargaining Power of Suppliers
- 4.1.2. Bargaining Power of Buyers
- 4.1.3. Threat of New Entrants
- 4.1.4. Threat of Substitutes
- 4.1.5. Competitive Rivalry
- 4.2. PESTEL analysis
- 4.3. BCG Analysis
- 4.3.1. Stars (High Growth, High Market Share)
- 4.3.2. Cash Cows (Low Growth, High Market Share)
- 4.3.3. Question Mark (High Growth, Low Market Share)
- 4.3.4. Dogs (Low Growth, Low Market Share)
- 4.4. Ansoff Matrix Analysis
- 4.5. Supply Chain Analysis
- 4.6. Regulatory Landscape
- 4.7. Current Market Potential and Opportunity Assessment (TAM–SAM–SOM Framework)
- 4.8. MDP Analyst Note
- 4.1. Porters Five Forces
- 5. Market Analysis, Insights and Forecast 2021-2033
- 5.1. Market Analysis, Insights and Forecast - by Type
- 5.1.1. Software
- 5.1.2. Hardware
- 5.2. Market Analysis, Insights and Forecast - by Enterprise Size
- 5.2.1. Large Enterprise
- 5.2.2. Small & Medium Enterprise
- 5.3. Market Analysis, Insights and Forecast - by Applications
- 5.3.1. Business to Business
- 5.3.2. Business to Consumer
- 5.4. Market Analysis, Insights and Forecast - by Region
- 5.4.1. North America
- 5.4.2. Europe
- 5.4.3. Asia Pacific
- 5.4.4. Rest of the World
- 5.1. Market Analysis, Insights and Forecast - by Type
- 6. Global Video Managed Services Industry Analysis, Insights and Forecast, 2021-2033
- 6.1. Market Analysis, Insights and Forecast - by Type
- 6.1.1. Software
- 6.1.2. Hardware
- 6.2. Market Analysis, Insights and Forecast - by Enterprise Size
- 6.2.1. Large Enterprise
- 6.2.2. Small & Medium Enterprise
- 6.3. Market Analysis, Insights and Forecast - by Applications
- 6.3.1. Business to Business
- 6.3.2. Business to Consumer
- 6.1. Market Analysis, Insights and Forecast - by Type
- 7. North America Video Managed Services Industry Analysis, Insights and Forecast, 2020-2032
- 7.1. Market Analysis, Insights and Forecast - by Type
- 7.1.1. Software
- 7.1.2. Hardware
- 7.2. Market Analysis, Insights and Forecast - by Enterprise Size
- 7.2.1. Large Enterprise
- 7.2.2. Small & Medium Enterprise
- 7.3. Market Analysis, Insights and Forecast - by Applications
- 7.3.1. Business to Business
- 7.3.2. Business to Consumer
- 7.1. Market Analysis, Insights and Forecast - by Type
- 8. Europe Video Managed Services Industry Analysis, Insights and Forecast, 2020-2032
- 8.1. Market Analysis, Insights and Forecast - by Type
- 8.1.1. Software
- 8.1.2. Hardware
- 8.2. Market Analysis, Insights and Forecast - by Enterprise Size
- 8.2.1. Large Enterprise
- 8.2.2. Small & Medium Enterprise
- 8.3. Market Analysis, Insights and Forecast - by Applications
- 8.3.1. Business to Business
- 8.3.2. Business to Consumer
- 8.1. Market Analysis, Insights and Forecast - by Type
- 9. Asia Pacific Video Managed Services Industry Analysis, Insights and Forecast, 2020-2032
- 9.1. Market Analysis, Insights and Forecast - by Type
- 9.1.1. Software
- 9.1.2. Hardware
- 9.2. Market Analysis, Insights and Forecast - by Enterprise Size
- 9.2.1. Large Enterprise
- 9.2.2. Small & Medium Enterprise
- 9.3. Market Analysis, Insights and Forecast - by Applications
- 9.3.1. Business to Business
- 9.3.2. Business to Consumer
- 9.1. Market Analysis, Insights and Forecast - by Type
- 10. Rest of the World Video Managed Services Industry Analysis, Insights and Forecast, 2020-2032
- 10.1. Market Analysis, Insights and Forecast - by Type
- 10.1.1. Software
- 10.1.2. Hardware
- 10.2. Market Analysis, Insights and Forecast - by Enterprise Size
- 10.2.1. Large Enterprise
- 10.2.2. Small & Medium Enterprise
- 10.3. Market Analysis, Insights and Forecast - by Applications
- 10.3.1. Business to Business
- 10.3.2. Business to Consumer
- 10.1. Market Analysis, Insights and Forecast - by Type
- 11. Competitive Analysis
- 11.1. Company Profiles
- 11.1.1 Arkadin Cloud Communications ( NTT Communications)
- 11.1.1.1. Company Overview
- 11.1.1.2. Products
- 11.1.1.3. Company Financials
- 11.1.1.4. SWOT Analysis
- 11.1.2 Polycom Inc
- 11.1.2.1. Company Overview
- 11.1.2.2. Products
- 11.1.2.3. Company Financials
- 11.1.2.4. SWOT Analysis
- 11.1.3 BT Conferencing Inc
- 11.1.3.1. Company Overview
- 11.1.3.2. Products
- 11.1.3.3. Company Financials
- 11.1.3.4. SWOT Analysis
- 11.1.4 Cisco Systems Inc
- 11.1.4.1. Company Overview
- 11.1.4.2. Products
- 11.1.4.3. Company Financials
- 11.1.4.4. SWOT Analysis
- 11.1.5 Macro Technologies Inc
- 11.1.5.1. Company Overview
- 11.1.5.2. Products
- 11.1.5.3. Company Financials
- 11.1.5.4. SWOT Analysis
- 11.1.6 Applied Global Technologies
- 11.1.6.1. Company Overview
- 11.1.6.2. Products
- 11.1.6.3. Company Financials
- 11.1.6.4. SWOT Analysis
- 11.1.7 Dimension Data
- 11.1.7.1. Company Overview
- 11.1.7.2. Products
- 11.1.7.3. Company Financials
- 11.1.7.4. SWOT Analysis
- 11.1.8 AVI-SPL Inc
- 11.1.8.1. Company Overview
- 11.1.8.2. Products
- 11.1.8.3. Company Financials
- 11.1.8.4. SWOT Analysis
- 11.1.9 ZTE Enterprise
- 11.1.9.1. Company Overview
- 11.1.9.2. Products
- 11.1.9.3. Company Financials
- 11.1.9.4. SWOT Analysis
- 11.1.10 AT&T Business
- 11.1.10.1. Company Overview
- 11.1.10.2. Products
- 11.1.10.3. Company Financials
- 11.1.10.4. SWOT Analysis
- 11.1.11 Telus Communications
- 11.1.11.1. Company Overview
- 11.1.11.2. Products
- 11.1.11.3. Company Financials
- 11.1.11.4. SWOT Analysis
- 11.1.12 Vega Global
- 11.1.12.1. Company Overview
- 11.1.12.2. Products
- 11.1.12.3. Company Financials
- 11.1.12.4. SWOT Analysis
- 11.1.1 Arkadin Cloud Communications ( NTT Communications)
- 11.2. Market Entropy
- 11.2.1 Company's Key Areas Served
- 11.2.2 Recent Developments
- 11.3. Company Market Share Analysis 2025
- 11.3.1 Top 5 Companies Market Share Analysis
- 11.3.2 Top 3 Companies Market Share Analysis
- 11.4. List of Potential Customers
- 12. Research Methodology
List of Figures
- Figure 1: Global Video Managed Services Industry Revenue Breakdown (Million, %) by Region 2025 & 2033
- Figure 2: Global Video Managed Services Industry Volume Breakdown (K Unit, %) by Region 2025 & 2033
- Figure 3: North America Video Managed Services Industry Revenue (Million), by Type 2025 & 2033
- Figure 4: North America Video Managed Services Industry Volume (K Unit), by Type 2025 & 2033
- Figure 5: North America Video Managed Services Industry Revenue Share (%), by Type 2025 & 2033
- Figure 6: North America Video Managed Services Industry Volume Share (%), by Type 2025 & 2033
- Figure 7: North America Video Managed Services Industry Revenue (Million), by Enterprise Size 2025 & 2033
- Figure 8: North America Video Managed Services Industry Volume (K Unit), by Enterprise Size 2025 & 2033
- Figure 9: North America Video Managed Services Industry Revenue Share (%), by Enterprise Size 2025 & 2033
- Figure 10: North America Video Managed Services Industry Volume Share (%), by Enterprise Size 2025 & 2033
- Figure 11: North America Video Managed Services Industry Revenue (Million), by Applications 2025 & 2033
- Figure 12: North America Video Managed Services Industry Volume (K Unit), by Applications 2025 & 2033
- Figure 13: North America Video Managed Services Industry Revenue Share (%), by Applications 2025 & 2033
- Figure 14: North America Video Managed Services Industry Volume Share (%), by Applications 2025 & 2033
- Figure 15: North America Video Managed Services Industry Revenue (Million), by Country 2025 & 2033
- Figure 16: North America Video Managed Services Industry Volume (K Unit), by Country 2025 & 2033
- Figure 17: North America Video Managed Services Industry Revenue Share (%), by Country 2025 & 2033
- Figure 18: North America Video Managed Services Industry Volume Share (%), by Country 2025 & 2033
- Figure 19: Europe Video Managed Services Industry Revenue (Million), by Type 2025 & 2033
- Figure 20: Europe Video Managed Services Industry Volume (K Unit), by Type 2025 & 2033
- Figure 21: Europe Video Managed Services Industry Revenue Share (%), by Type 2025 & 2033
- Figure 22: Europe Video Managed Services Industry Volume Share (%), by Type 2025 & 2033
- Figure 23: Europe Video Managed Services Industry Revenue (Million), by Enterprise Size 2025 & 2033
- Figure 24: Europe Video Managed Services Industry Volume (K Unit), by Enterprise Size 2025 & 2033
- Figure 25: Europe Video Managed Services Industry Revenue Share (%), by Enterprise Size 2025 & 2033
- Figure 26: Europe Video Managed Services Industry Volume Share (%), by Enterprise Size 2025 & 2033
- Figure 27: Europe Video Managed Services Industry Revenue (Million), by Applications 2025 & 2033
- Figure 28: Europe Video Managed Services Industry Volume (K Unit), by Applications 2025 & 2033
- Figure 29: Europe Video Managed Services Industry Revenue Share (%), by Applications 2025 & 2033
- Figure 30: Europe Video Managed Services Industry Volume Share (%), by Applications 2025 & 2033
- Figure 31: Europe Video Managed Services Industry Revenue (Million), by Country 2025 & 2033
- Figure 32: Europe Video Managed Services Industry Volume (K Unit), by Country 2025 & 2033
- Figure 33: Europe Video Managed Services Industry Revenue Share (%), by Country 2025 & 2033
- Figure 34: Europe Video Managed Services Industry Volume Share (%), by Country 2025 & 2033
- Figure 35: Asia Pacific Video Managed Services Industry Revenue (Million), by Type 2025 & 2033
- Figure 36: Asia Pacific Video Managed Services Industry Volume (K Unit), by Type 2025 & 2033
- Figure 37: Asia Pacific Video Managed Services Industry Revenue Share (%), by Type 2025 & 2033
- Figure 38: Asia Pacific Video Managed Services Industry Volume Share (%), by Type 2025 & 2033
- Figure 39: Asia Pacific Video Managed Services Industry Revenue (Million), by Enterprise Size 2025 & 2033
- Figure 40: Asia Pacific Video Managed Services Industry Volume (K Unit), by Enterprise Size 2025 & 2033
- Figure 41: Asia Pacific Video Managed Services Industry Revenue Share (%), by Enterprise Size 2025 & 2033
- Figure 42: Asia Pacific Video Managed Services Industry Volume Share (%), by Enterprise Size 2025 & 2033
- Figure 43: Asia Pacific Video Managed Services Industry Revenue (Million), by Applications 2025 & 2033
- Figure 44: Asia Pacific Video Managed Services Industry Volume (K Unit), by Applications 2025 & 2033
- Figure 45: Asia Pacific Video Managed Services Industry Revenue Share (%), by Applications 2025 & 2033
- Figure 46: Asia Pacific Video Managed Services Industry Volume Share (%), by Applications 2025 & 2033
- Figure 47: Asia Pacific Video Managed Services Industry Revenue (Million), by Country 2025 & 2033
- Figure 48: Asia Pacific Video Managed Services Industry Volume (K Unit), by Country 2025 & 2033
- Figure 49: Asia Pacific Video Managed Services Industry Revenue Share (%), by Country 2025 & 2033
- Figure 50: Asia Pacific Video Managed Services Industry Volume Share (%), by Country 2025 & 2033
- Figure 51: Rest of the World Video Managed Services Industry Revenue (Million), by Type 2025 & 2033
- Figure 52: Rest of the World Video Managed Services Industry Volume (K Unit), by Type 2025 & 2033
- Figure 53: Rest of the World Video Managed Services Industry Revenue Share (%), by Type 2025 & 2033
- Figure 54: Rest of the World Video Managed Services Industry Volume Share (%), by Type 2025 & 2033
- Figure 55: Rest of the World Video Managed Services Industry Revenue (Million), by Enterprise Size 2025 & 2033
- Figure 56: Rest of the World Video Managed Services Industry Volume (K Unit), by Enterprise Size 2025 & 2033
- Figure 57: Rest of the World Video Managed Services Industry Revenue Share (%), by Enterprise Size 2025 & 2033
- Figure 58: Rest of the World Video Managed Services Industry Volume Share (%), by Enterprise Size 2025 & 2033
- Figure 59: Rest of the World Video Managed Services Industry Revenue (Million), by Applications 2025 & 2033
- Figure 60: Rest of the World Video Managed Services Industry Volume (K Unit), by Applications 2025 & 2033
- Figure 61: Rest of the World Video Managed Services Industry Revenue Share (%), by Applications 2025 & 2033
- Figure 62: Rest of the World Video Managed Services Industry Volume Share (%), by Applications 2025 & 2033
- Figure 63: Rest of the World Video Managed Services Industry Revenue (Million), by Country 2025 & 2033
- Figure 64: Rest of the World Video Managed Services Industry Volume (K Unit), by Country 2025 & 2033
- Figure 65: Rest of the World Video Managed Services Industry Revenue Share (%), by Country 2025 & 2033
- Figure 66: Rest of the World Video Managed Services Industry Volume Share (%), by Country 2025 & 2033
List of Tables
- Table 1: Global Video Managed Services Industry Revenue Million Forecast, by Type 2020 & 2033
- Table 2: Global Video Managed Services Industry Volume K Unit Forecast, by Type 2020 & 2033
- Table 3: Global Video Managed Services Industry Revenue Million Forecast, by Enterprise Size 2020 & 2033
- Table 4: Global Video Managed Services Industry Volume K Unit Forecast, by Enterprise Size 2020 & 2033
- Table 5: Global Video Managed Services Industry Revenue Million Forecast, by Applications 2020 & 2033
- Table 6: Global Video Managed Services Industry Volume K Unit Forecast, by Applications 2020 & 2033
- Table 7: Global Video Managed Services Industry Revenue Million Forecast, by Region 2020 & 2033
- Table 8: Global Video Managed Services Industry Volume K Unit Forecast, by Region 2020 & 2033
- Table 9: Global Video Managed Services Industry Revenue Million Forecast, by Type 2020 & 2033
- Table 10: Global Video Managed Services Industry Volume K Unit Forecast, by Type 2020 & 2033
- Table 11: Global Video Managed Services Industry Revenue Million Forecast, by Enterprise Size 2020 & 2033
- Table 12: Global Video Managed Services Industry Volume K Unit Forecast, by Enterprise Size 2020 & 2033
- Table 13: Global Video Managed Services Industry Revenue Million Forecast, by Applications 2020 & 2033
- Table 14: Global Video Managed Services Industry Volume K Unit Forecast, by Applications 2020 & 2033
- Table 15: Global Video Managed Services Industry Revenue Million Forecast, by Country 2020 & 2033
- Table 16: Global Video Managed Services Industry Volume K Unit Forecast, by Country 2020 & 2033
- Table 17: Global Video Managed Services Industry Revenue Million Forecast, by Type 2020 & 2033
- Table 18: Global Video Managed Services Industry Volume K Unit Forecast, by Type 2020 & 2033
- Table 19: Global Video Managed Services Industry Revenue Million Forecast, by Enterprise Size 2020 & 2033
- Table 20: Global Video Managed Services Industry Volume K Unit Forecast, by Enterprise Size 2020 & 2033
- Table 21: Global Video Managed Services Industry Revenue Million Forecast, by Applications 2020 & 2033
- Table 22: Global Video Managed Services Industry Volume K Unit Forecast, by Applications 2020 & 2033
- Table 23: Global Video Managed Services Industry Revenue Million Forecast, by Country 2020 & 2033
- Table 24: Global Video Managed Services Industry Volume K Unit Forecast, by Country 2020 & 2033
- Table 25: Global Video Managed Services Industry Revenue Million Forecast, by Type 2020 & 2033
- Table 26: Global Video Managed Services Industry Volume K Unit Forecast, by Type 2020 & 2033
- Table 27: Global Video Managed Services Industry Revenue Million Forecast, by Enterprise Size 2020 & 2033
- Table 28: Global Video Managed Services Industry Volume K Unit Forecast, by Enterprise Size 2020 & 2033
- Table 29: Global Video Managed Services Industry Revenue Million Forecast, by Applications 2020 & 2033
- Table 30: Global Video Managed Services Industry Volume K Unit Forecast, by Applications 2020 & 2033
- Table 31: Global Video Managed Services Industry Revenue Million Forecast, by Country 2020 & 2033
- Table 32: Global Video Managed Services Industry Volume K Unit Forecast, by Country 2020 & 2033
- Table 33: Global Video Managed Services Industry Revenue Million Forecast, by Type 2020 & 2033
- Table 34: Global Video Managed Services Industry Volume K Unit Forecast, by Type 2020 & 2033
- Table 35: Global Video Managed Services Industry Revenue Million Forecast, by Enterprise Size 2020 & 2033
- Table 36: Global Video Managed Services Industry Volume K Unit Forecast, by Enterprise Size 2020 & 2033
- Table 37: Global Video Managed Services Industry Revenue Million Forecast, by Applications 2020 & 2033
- Table 38: Global Video Managed Services Industry Volume K Unit Forecast, by Applications 2020 & 2033
- Table 39: Global Video Managed Services Industry Revenue Million Forecast, by Country 2020 & 2033
- Table 40: Global Video Managed Services Industry Volume K Unit Forecast, by Country 2020 & 2033
Frequently Asked Questions
1. What is the projected Compound Annual Growth Rate (CAGR) of the Video Managed Services Industry?
The projected CAGR is approximately 22.25%.
2. Which companies are prominent players in the Video Managed Services Industry?
Key companies in the market include Arkadin Cloud Communications ( NTT Communications), Polycom Inc, BT Conferencing Inc, Cisco Systems Inc, Macro Technologies Inc , Applied Global Technologies, Dimension Data, AVI-SPL Inc, ZTE Enterprise, AT&T Business, Telus Communications, Vega Global.
3. What are the main segments of the Video Managed Services Industry?
The market segments include Type, Enterprise Size, Applications.
4. Can you provide details about the market size?
The market size is estimated to be USD 15.43 Million as of 2022.
5. What are some drivers contributing to market growth?
Adoption of BYOD (Bring Your Own Device); Higher Productivity Rate by Reducing Unnecessary Hours.
6. What are the notable trends driving market growth?
Software Segment to Witness the Growth.
7. Are there any restraints impacting market growth?
High Initial Investments and Installation Costs.
8. Can you provide examples of recent developments in the market?
August 2023 - Quantum Corporation, the leader in solutions for video and unstructured data, announced a partnership with Tiger Surveillance, a leading provider of video surveillance data management and protection solutions, to deliver end-to-end solutions for long-term retention and archiving of video surveillance data.
9. What pricing options are available for accessing the report?
Pricing options include single-user, multi-user, and enterprise licenses priced at USD 4750, USD 5250, and USD 8750 respectively.
10. Is the market size provided in terms of value or volume?
The market size is provided in terms of value, measured in Million and volume, measured in K Unit.
11. Are there any specific market keywords associated with the report?
Yes, the market keyword associated with the report is "Video Managed Services Industry," which aids in identifying and referencing the specific market segment covered.
12. How do I determine which pricing option suits my needs best?
The pricing options vary based on user requirements and access needs. Individual users may opt for single-user licenses, while businesses requiring broader access may choose multi-user or enterprise licenses for cost-effective access to the report.
13. Are there any additional resources or data provided in the Video Managed Services Industry report?
While the report offers comprehensive insights, it's advisable to review the specific contents or supplementary materials provided to ascertain if additional resources or data are available.
14. How can I stay updated on further developments or reports in the Video Managed Services Industry?
To stay informed about further developments, trends, and reports in the Video Managed Services Industry, consider subscribing to industry newsletters, following relevant companies and organizations, or regularly checking reputable industry news sources and publications.
Methodology
Step 1 - Identification of Relevant Samples Size from Population Database


Step 2 - Approaches for Defining Global Market Size (Value, Volume* & Price*)

Note*: In applicable scenarios
Step 3 - Data Sources
Primary Research
- Web Analytics
- Survey Reports
- Research Institute
- Latest Research Reports
- Opinion Leaders
Secondary Research
- Annual Reports
- White Paper
- Latest Press Release
- Industry Association
- Paid Database
- Investor Presentations

Step 4 - Data Triangulation
Involves using different sources of information in order to increase the validity of a study
These sources are likely to be stakeholders in a program - participants, other researchers, program staff, other community members, and so on.
Then we put all data in single framework & apply various statistical tools to find out the dynamic on the market.
During the analysis stage, feedback from the stakeholder groups would be compared to determine areas of agreement as well as areas of divergence