

Key Insights
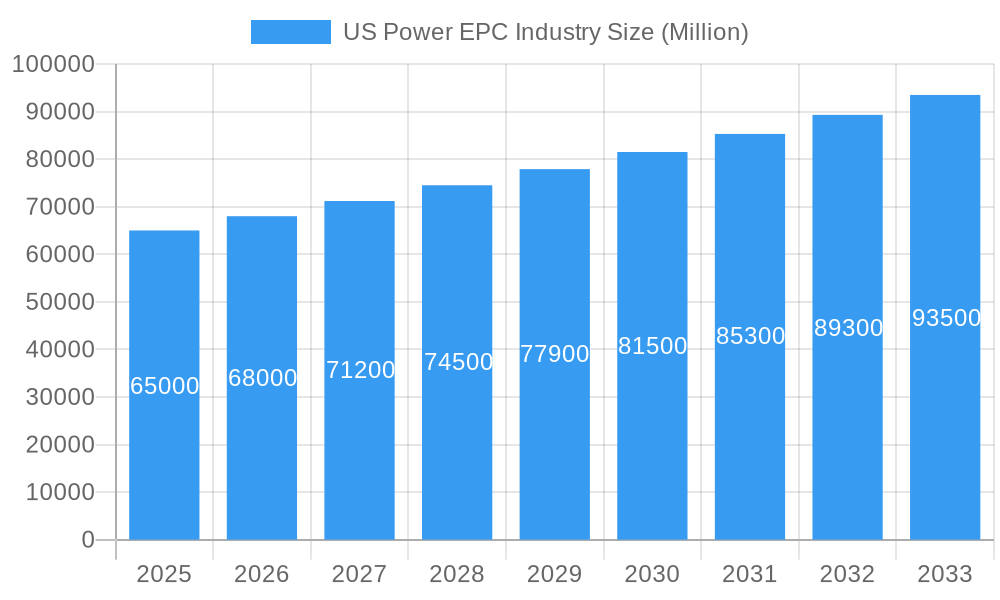
The US Power Engineering, Procurement, and Construction (EPC) market is projected to experience robust growth, driven by significant investments in modernizing aging infrastructure and the accelerating transition towards cleaner energy sources. With an estimated market size of approximately $65 billion in 2025, the sector is poised for a Compound Annual Growth Rate (CAGR) exceeding 4.50% through 2033. This expansion is primarily fueled by the escalating demand for renewable energy projects, including solar, wind, and battery storage solutions, which are receiving substantial policy support and private sector investment. Concurrently, the need to upgrade and maintain existing conventional power plants (thermal and nuclear) to meet stringent environmental regulations and ensure grid stability also presents a consistent stream of opportunities. Key players like Jacobs Engineering Group Inc., Bechtel Corporation, and Siemens AG are actively participating in large-scale projects, leveraging their expertise in managing complex infrastructure development.
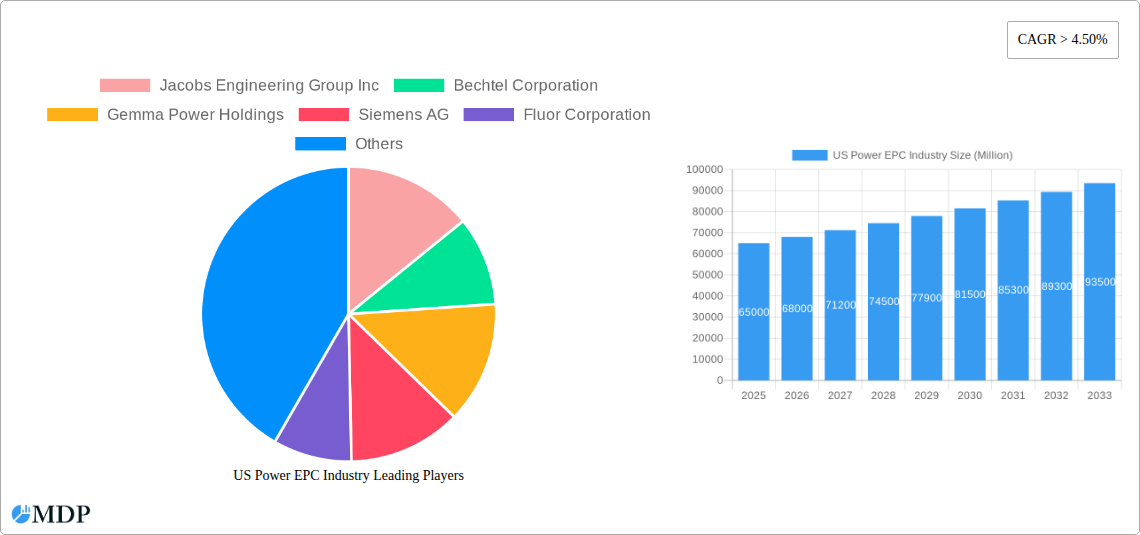
US Power EPC Industry Market Size (In Billion)
The market's dynamism is further shaped by evolving trends such as the integration of smart grid technologies for enhanced efficiency and reliability, and the increasing focus on distributed energy resources. While the sheer scale of projects and the technical expertise required are significant drivers, potential restraints include fluctuating commodity prices for construction materials, evolving regulatory landscapes, and challenges in securing skilled labor for specialized tasks. North America, particularly the United States, is expected to dominate the market due to substantial government incentives for renewable energy, federal infrastructure spending, and ongoing utility upgrades. The competitive landscape is characterized by a mix of established global giants and specialized regional firms, all vying to capitalize on the transformative phase of the US power sector.
US Power EPC Industry Company Market Share
Unlocking the Future of US Power: A Comprehensive Report on the US Power EPC Industry (2019-2033)
Gain unparalleled insights into the dynamic US Power Engineering, Procurement, and Construction (EPC) sector with this in-depth market analysis. Covering the historical period of 2019-2024 and projecting growth through 2033, this report is an essential resource for power developers, investors, technology providers, and industry stakeholders. Explore evolving market concentration, groundbreaking innovations, critical regulatory shifts, and the competitive landscape that is reshaping the American energy infrastructure. We delve into key segments like Thermal, Gas, Renewable, and Nuclear power, identifying dominant markets and strategic opportunities. With a focus on actionable data and forward-looking strategies, this report empowers you to navigate the complexities and capitalize on the immense growth potential within the US Power EPC industry.
US Power EPC Industry Market Dynamics & Concentration
The US Power EPC industry exhibits a moderate to high market concentration, with a few dominant players like Jacobs Engineering Group Inc., Bechtel Corporation, and Fluor Corporation holding significant market share. Innovation drivers are primarily fueled by the urgent need for decarbonization, grid modernization, and energy independence, leading to advancements in renewable energy technologies, advanced nuclear designs, and efficient gas-fired power plants. Regulatory frameworks, including federal and state policies on emissions, renewable energy mandates, and permitting processes, significantly influence project viability and market entry. Product substitutes are emerging, particularly in the realm of energy storage solutions and distributed generation, challenging traditional large-scale power plant models. End-user trends are shifting towards greater demand for reliable, sustainable, and cost-effective energy solutions, with a strong preference for renewable sources and flexible generation capacity. Mergers and acquisitions (M&A) activity is a notable aspect, driven by the desire for scale, diversification, and enhanced technological capabilities. For instance, in recent years, there have been xx M&A deals, with an estimated total deal value of $xx Million, as companies consolidate to better compete in an increasingly complex market.
US Power EPC Industry Industry Trends & Analysis
The US Power EPC industry is currently experiencing robust growth, driven by a confluence of factors including an aging power infrastructure requiring substantial upgrades and replacements, and a national imperative to transition towards cleaner energy sources. The market growth drivers are multifaceted, encompassing government incentives for renewable energy deployment, increasing demand for electricity from data centers and expanding industrial sectors, and the ongoing need for baseload power to ensure grid stability. The Compound Annual Growth Rate (CAGR) for the US Power EPC market is estimated to be around xx% during the forecast period of 2025–2033. Technological disruptions are rapidly transforming the sector. The integration of smart grid technologies, advancements in battery storage, and the development of more efficient and cost-effective renewable energy systems, such as offshore wind and advanced solar photovoltaic technologies, are creating new project opportunities and demanding specialized EPC expertise. Artificial intelligence and machine learning are also being adopted for project planning, optimization, and operational efficiency. Consumer preferences are increasingly leaning towards sustainability and reduced environmental impact, pushing utilities and developers to prioritize low-carbon and renewable energy projects. This shift is evident in the declining market penetration of new coal-fired power plants and the surging investment in solar, wind, and energy storage. Competitive dynamics are intense, with established global players vying for market share alongside emerging niche providers specializing in specific technologies. Companies are forming strategic alliances and partnerships to leverage complementary strengths and bid on larger, more complex projects. The estimated market penetration of renewable energy in the total power generation mix is projected to reach xx% by 2033, a significant increase from xx% in 2019, directly influencing the demand for renewable EPC services.
Leading Markets & Segments in US Power EPC Industry
The US Power EPC industry is characterized by several dominant segments and regional focuses, each with its own set of growth accelerators and underlying economic drivers.
Renewable Energy Segment Dominance
The Renewable energy segment is emerging as the leading force within the US Power EPC market. This dominance is propelled by a confluence of powerful factors:
- Economic Policies and Incentives: Federal tax credits, such as the Investment Tax Credit (ITC) and Production Tax Credit (PTC), coupled with state-level Renewable Portfolio Standards (RPS) and net metering policies, create a highly favorable economic environment for renewable energy project development. These policies directly reduce the upfront capital expenditure and improve the long-term profitability of solar, wind, and battery storage projects, making them attractive investments for developers and EPC firms.
- Technological Advancements and Cost Reductions: Significant strides in solar panel efficiency, wind turbine technology, and battery storage capacity have led to substantial cost reductions over the past decade. This has made renewables increasingly competitive with, and often cheaper than, traditional fossil fuel power generation. The ability of EPC companies to offer turnkey solutions for large-scale solar farms, onshore and offshore wind projects, and integrated battery storage systems is a key differentiator.
- Environmental Mandates and Corporate Sustainability Goals: Growing public and governmental pressure to reduce greenhouse gas emissions, coupled with ambitious corporate sustainability targets, is driving demand for renewable energy procurement. Many corporations are opting to power their operations with clean energy, creating a strong demand pipeline for renewable EPC services.
- Grid Integration and Modernization: The need to integrate intermittent renewable sources into the grid is driving significant investment in grid modernization, including transmission upgrades and energy storage solutions. EPC firms with expertise in these areas are well-positioned to capitalize on this trend.
The dominance of the renewable segment is underscored by the fact that a substantial proportion of new power generation capacity additions are from solar and wind. For example, in 2023, renewable energy accounted for an estimated xx% of new generating capacity, a trend projected to continue and accelerate. The market for utility-scale solar projects alone is expected to reach a valuation of $xx Million by 2028, with wind power not far behind.
Gas Segment Resilience and Transition Role
While renewables are leading the charge, the Gas segment continues to play a critical role, particularly in providing flexible and reliable baseload power and supporting the transition away from coal.
- Reliability and Grid Stability: Natural gas-fired power plants offer dispatchable power, meaning they can be ramped up or down quickly to meet fluctuating electricity demand and ensure grid stability, especially when renewable sources are not generating at peak capacity. This makes them essential for maintaining a reliable power supply.
- Lower Emissions Compared to Coal: As a transitional fuel, natural gas offers significantly lower carbon emissions compared to coal-fired power plants. The ongoing retirement of older, less efficient coal plants is leading to the construction of new, more efficient combined-cycle gas turbines (CCGTs) to replace this capacity.
- Existing Infrastructure and Supply Chains: The established infrastructure for natural gas transportation and the mature supply chains for gas turbine technology provide a degree of inherent advantage for projects in this segment.
- Combined Heat and Power (CHP) Applications: Gas-fired plants are often utilized in combined heat and power (CHP) systems for industrial facilities, offering high energy efficiency and cost savings.
Thermal Segment Evolution
The Thermal segment, traditionally dominated by coal, is undergoing a significant transformation. While new coal plant construction is largely stagnating due to environmental concerns and economic unviability, there is still activity related to the upgrade and repowering of existing thermal plants, and the construction of advanced supercritical and ultra-supercritical coal units in specific regions. However, the overall trend is a decline in the dominance of traditional coal-fired thermal power.
Nuclear Segment Future Potential
The Nuclear segment, while facing high upfront costs and complex regulatory hurdles, holds potential for significant low-carbon baseload power generation. The development of Small Modular Reactors (SMRs) is a key area of innovation within this segment, promising greater cost-effectiveness and scalability. Renewed interest in nuclear power as a carbon-free energy source could lead to increased EPC activity in the long term, although current market share remains relatively smaller compared to renewables and gas.
Other Types Segment and Emerging Technologies
The Other Types segment encompasses a range of emerging and niche power generation technologies, including biomass, geothermal, and waste-to-energy. While these segments represent smaller portions of the overall market, they can offer localized solutions and contribute to energy diversification.
In summary, the US Power EPC industry is experiencing a paradigm shift, with the Renewable segment leading the growth trajectory, supported by the continued, albeit evolving, importance of the Gas segment for grid stability and transition. The Thermal segment is contracting in its traditional form, while Nuclear and Other Types segments represent areas of future potential and niche applications.
US Power EPC Industry Product Developments
Recent product developments in the US Power EPC industry are focused on enhancing efficiency, sustainability, and integration. Innovations in solar photovoltaic (PV) technology include higher-efficiency bifacial modules and advanced perovskite solar cells, offering improved energy yield and a smaller physical footprint. In the wind sector, larger and more powerful offshore wind turbines are being developed, capable of harnessing stronger winds further from shore, alongside advancements in floating offshore wind platforms for deeper waters. For gas-fired power generation, the focus is on ultra-efficient combined-cycle gas turbines (CCGTs) with lower emissions and the development of systems capable of co-firing hydrogen. Energy storage solutions are seeing rapid advancements, with improvements in battery chemistry, lifespan, and charge/discharge rates, enabling more robust grid integration of renewables. Furthermore, the development of Small Modular Reactors (SMRs) represents a significant innovation in the nuclear segment, promising faster deployment and potentially lower costs. These product developments provide EPC companies with a competitive advantage by enabling them to offer state-of-the-art, cost-effective, and environmentally compliant solutions to meet evolving energy demands.
Key Drivers of US Power EPC Industry Growth
Several pivotal factors are accelerating growth within the US Power EPC industry. Technologically, the rapid advancements in renewable energy systems, including more efficient solar panels, larger wind turbines, and enhanced battery storage, are creating substantial project pipelines. Economically, favorable government incentives, such as federal and state tax credits for renewables, coupled with the increasing cost-competitiveness of clean energy, are driving significant investment. Regulatory drivers, including ambitious clean energy targets and the ongoing retirement of older, less efficient fossil fuel plants, further necessitate new power generation capacity. The growing demand for electricity, fueled by data centers, electrification of transportation, and industrial expansion, also plays a crucial role in stimulating EPC activity across various power generation technologies.
Challenges in the US Power EPC Industry Market
The US Power EPC industry faces several significant challenges that can impede growth and project execution. Regulatory hurdles, including lengthy permitting processes, environmental reviews, and evolving policy landscapes at federal and state levels, can cause project delays and increase costs. Supply chain disruptions, exacerbated by geopolitical events and material shortages, have led to increased component costs and extended lead times for critical equipment. Intense competitive pressures among EPC firms can compress profit margins, particularly for large-scale projects. Furthermore, workforce development and the availability of skilled labor for specialized construction and engineering roles remain a persistent concern. The integration of new, complex technologies into existing grid infrastructure also presents technical challenges that require careful planning and execution by EPC providers.
Emerging Opportunities in US Power EPC Industry
Emerging opportunities in the US Power EPC industry are largely driven by the accelerating clean energy transition and technological innovation. The widespread adoption of renewable energy sources, particularly solar, wind, and battery storage, presents a vast and growing market for EPC services. Strategic partnerships between traditional EPC firms and renewable technology developers are creating new avenues for integrated solutions. The push for grid modernization and resilience is opening up significant opportunities in areas like advanced transmission technologies, microgrids, and smart grid deployment. Furthermore, the development and commercialization of next-generation nuclear technologies, such as Small Modular Reactors (SMRs), represent a long-term growth catalyst. Market expansion into underserved regions and the development of innovative financing models for complex energy projects also offer substantial untapped potential for forward-thinking EPC companies.
Leading Players in the US Power EPC Industry Sector
- Jacobs Engineering Group Inc.
- Bechtel Corporation
- Gemma Power Holdings
- Siemens AG
- Fluor Corporation
- John Wood Group PLC
- JGC Corporation
Key Milestones in US Power EPC Industry Industry
- March 2021: Decade Corporation and Bechtel Oil & Gas and Chemicals Inc. (Bechtel) announced the completion of engineering, procurement, and construction agreements for the first three trains at NextDecade's Rio Grande LNG project, signifying significant progress in large-scale energy infrastructure development.
- January 2020: US-based Argan's wholly-owned subsidiary Gemma Power Systems secured an engineering, procurement, and construction (EPC) services contract with Harrison Power for a 1.085 GW power project in Ohio, United States, highlighting continued investment in gas-fired power generation capacity.
Strategic Outlook for US Power EPC Industry Market
The strategic outlook for the US Power EPC industry market is overwhelmingly positive, driven by robust demand for clean energy infrastructure and ongoing grid modernization efforts. Growth accelerators include continued government support for renewables through tax incentives and mandates, alongside a strong corporate push for sustainability. The industry is poised to benefit from significant investments in battery storage, offshore wind, and advanced grid technologies. EPC firms that can offer integrated, innovative, and cost-effective solutions, particularly those with expertise in renewable energy deployment and grid integration, will be best positioned for success. Strategic partnerships and acquisitions will likely continue to shape the competitive landscape, fostering greater collaboration and enhancing capabilities to meet the escalating demand for reliable and sustainable power generation. The long-term potential for growth remains substantial, as the US continues its energy transition journey.
US Power EPC Industry Segmentation
-
1. Type
- 1.1. Thermal
- 1.2. Gas
- 1.3. Renewable
- 1.4. Nuclear
- 1.5. Other Types
US Power EPC Industry Segmentation By Geography
-
1. North America
- 1.1. United States
- 1.2. Canada
- 1.3. Mexico
-
2. South America
- 2.1. Brazil
- 2.2. Argentina
- 2.3. Rest of South America
-
3. Europe
- 3.1. United Kingdom
- 3.2. Germany
- 3.3. France
- 3.4. Italy
- 3.5. Spain
- 3.6. Russia
- 3.7. Benelux
- 3.8. Nordics
- 3.9. Rest of Europe
-
4. Middle East & Africa
- 4.1. Turkey
- 4.2. Israel
- 4.3. GCC
- 4.4. North Africa
- 4.5. South Africa
- 4.6. Rest of Middle East & Africa
-
5. Asia Pacific
- 5.1. China
- 5.2. India
- 5.3. Japan
- 5.4. South Korea
- 5.5. ASEAN
- 5.6. Oceania
- 5.7. Rest of Asia Pacific
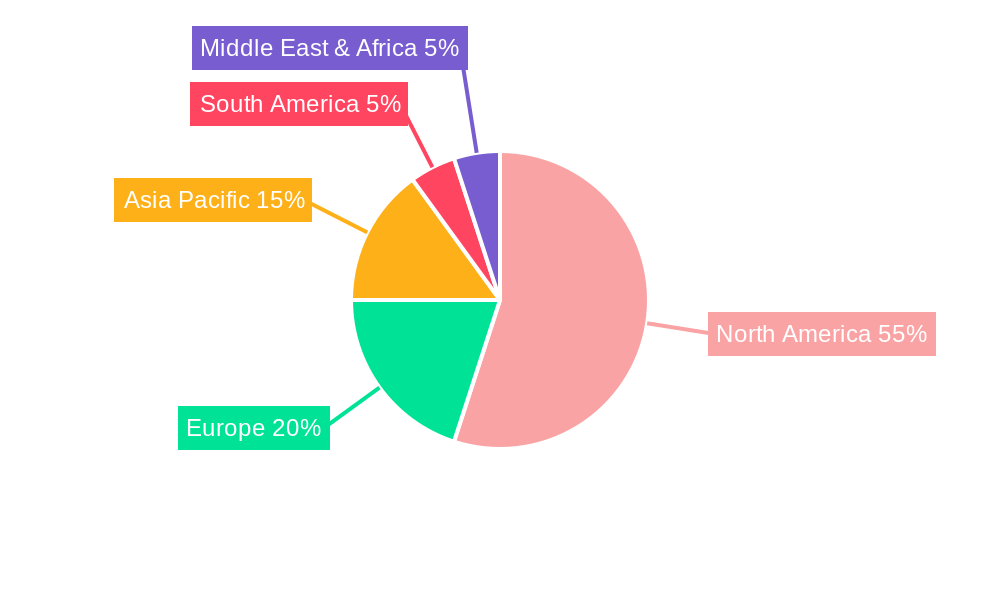
US Power EPC Industry Regional Market Share
Geographic Coverage of US Power EPC Industry
US Power EPC Industry REPORT HIGHLIGHTS
| Aspects | Details |
|---|---|
| Study Period | 2020-2034 |
| Base Year | 2025 |
| Estimated Year | 2026 |
| Forecast Period | 2026-2034 |
| Historical Period | 2020-2025 |
| Growth Rate | CAGR of 2.85% from 2020-2034 |
| Segmentation |
|
Table of Contents
- 1. Introduction
- 1.1. Research Scope
- 1.2. Market Segmentation
- 1.3. Research Objective
- 1.4. Definitions and Assumptions
- 2. Executive Summary
- 2.1. Market Snapshot
- 3. Market Dynamics
- 3.1. Market Drivers
- 3.2. Market Restrains
- 3.3. Market Trends
- 3.4. Market Opportunities
- 4. Market Factor Analysis
- 4.1. Porters Five Forces
- 4.1.1. Bargaining Power of Suppliers
- 4.1.2. Bargaining Power of Buyers
- 4.1.3. Threat of New Entrants
- 4.1.4. Threat of Substitutes
- 4.1.5. Competitive Rivalry
- 4.2. PESTEL analysis
- 4.3. BCG Analysis
- 4.3.1. Stars (High Growth, High Market Share)
- 4.3.2. Cash Cows (Low Growth, High Market Share)
- 4.3.3. Question Mark (High Growth, Low Market Share)
- 4.3.4. Dogs (Low Growth, Low Market Share)
- 4.4. Ansoff Matrix Analysis
- 4.5. Supply Chain Analysis
- 4.6. Regulatory Landscape
- 4.7. Current Market Potential and Opportunity Assessment (TAM–SAM–SOM Framework)
- 4.8. MDP Analyst Note
- 4.1. Porters Five Forces
- 5. Market Analysis, Insights and Forecast 2021-2033
- 5.1. Market Analysis, Insights and Forecast - by Type
- 5.1.1. Thermal
- 5.1.2. Gas
- 5.1.3. Renewable
- 5.1.4. Nuclear
- 5.1.5. Other Types
- 5.2. Market Analysis, Insights and Forecast - by Region
- 5.2.1. North America
- 5.2.2. South America
- 5.2.3. Europe
- 5.2.4. Middle East & Africa
- 5.2.5. Asia Pacific
- 5.1. Market Analysis, Insights and Forecast - by Type
- 6. Global US Power EPC Industry Analysis, Insights and Forecast, 2021-2033
- 6.1. Market Analysis, Insights and Forecast - by Type
- 6.1.1. Thermal
- 6.1.2. Gas
- 6.1.3. Renewable
- 6.1.4. Nuclear
- 6.1.5. Other Types
- 6.1. Market Analysis, Insights and Forecast - by Type
- 7. North America US Power EPC Industry Analysis, Insights and Forecast, 2020-2032
- 7.1. Market Analysis, Insights and Forecast - by Type
- 7.1.1. Thermal
- 7.1.2. Gas
- 7.1.3. Renewable
- 7.1.4. Nuclear
- 7.1.5. Other Types
- 7.1. Market Analysis, Insights and Forecast - by Type
- 8. South America US Power EPC Industry Analysis, Insights and Forecast, 2020-2032
- 8.1. Market Analysis, Insights and Forecast - by Type
- 8.1.1. Thermal
- 8.1.2. Gas
- 8.1.3. Renewable
- 8.1.4. Nuclear
- 8.1.5. Other Types
- 8.1. Market Analysis, Insights and Forecast - by Type
- 9. Europe US Power EPC Industry Analysis, Insights and Forecast, 2020-2032
- 9.1. Market Analysis, Insights and Forecast - by Type
- 9.1.1. Thermal
- 9.1.2. Gas
- 9.1.3. Renewable
- 9.1.4. Nuclear
- 9.1.5. Other Types
- 9.1. Market Analysis, Insights and Forecast - by Type
- 10. Middle East & Africa US Power EPC Industry Analysis, Insights and Forecast, 2020-2032
- 10.1. Market Analysis, Insights and Forecast - by Type
- 10.1.1. Thermal
- 10.1.2. Gas
- 10.1.3. Renewable
- 10.1.4. Nuclear
- 10.1.5. Other Types
- 10.1. Market Analysis, Insights and Forecast - by Type
- 11. Asia Pacific US Power EPC Industry Analysis, Insights and Forecast, 2020-2032
- 11.1. Market Analysis, Insights and Forecast - by Type
- 11.1.1. Thermal
- 11.1.2. Gas
- 11.1.3. Renewable
- 11.1.4. Nuclear
- 11.1.5. Other Types
- 11.1. Market Analysis, Insights and Forecast - by Type
- 12. Competitive Analysis
- 12.1. Company Profiles
- 12.1.1 Jacobs Engineering Group Inc
- 12.1.1.1. Company Overview
- 12.1.1.2. Products
- 12.1.1.3. Company Financials
- 12.1.1.4. SWOT Analysis
- 12.1.2 Bechtel Corporation
- 12.1.2.1. Company Overview
- 12.1.2.2. Products
- 12.1.2.3. Company Financials
- 12.1.2.4. SWOT Analysis
- 12.1.3 Gemma Power Holdings
- 12.1.3.1. Company Overview
- 12.1.3.2. Products
- 12.1.3.3. Company Financials
- 12.1.3.4. SWOT Analysis
- 12.1.4 Siemens AG
- 12.1.4.1. Company Overview
- 12.1.4.2. Products
- 12.1.4.3. Company Financials
- 12.1.4.4. SWOT Analysis
- 12.1.5 Fluor Corporation
- 12.1.5.1. Company Overview
- 12.1.5.2. Products
- 12.1.5.3. Company Financials
- 12.1.5.4. SWOT Analysis
- 12.1.6 John Wood Group PLC
- 12.1.6.1. Company Overview
- 12.1.6.2. Products
- 12.1.6.3. Company Financials
- 12.1.6.4. SWOT Analysis
- 12.1.7 JGC Corporation
- 12.1.7.1. Company Overview
- 12.1.7.2. Products
- 12.1.7.3. Company Financials
- 12.1.7.4. SWOT Analysis
- 12.1.1 Jacobs Engineering Group Inc
- 12.2. Market Entropy
- 12.2.1 Company's Key Areas Served
- 12.2.2 Recent Developments
- 12.3. Company Market Share Analysis 2025
- 12.3.1 Top 5 Companies Market Share Analysis
- 12.3.2 Top 3 Companies Market Share Analysis
- 12.4. List of Potential Customers
- 13. Research Methodology
List of Figures
- Figure 1: Global US Power EPC Industry Revenue Breakdown (billion, %) by Region 2025 & 2033
- Figure 2: North America US Power EPC Industry Revenue (billion), by Type 2025 & 2033
- Figure 3: North America US Power EPC Industry Revenue Share (%), by Type 2025 & 2033
- Figure 4: North America US Power EPC Industry Revenue (billion), by Country 2025 & 2033
- Figure 5: North America US Power EPC Industry Revenue Share (%), by Country 2025 & 2033
- Figure 6: South America US Power EPC Industry Revenue (billion), by Type 2025 & 2033
- Figure 7: South America US Power EPC Industry Revenue Share (%), by Type 2025 & 2033
- Figure 8: South America US Power EPC Industry Revenue (billion), by Country 2025 & 2033
- Figure 9: South America US Power EPC Industry Revenue Share (%), by Country 2025 & 2033
- Figure 10: Europe US Power EPC Industry Revenue (billion), by Type 2025 & 2033
- Figure 11: Europe US Power EPC Industry Revenue Share (%), by Type 2025 & 2033
- Figure 12: Europe US Power EPC Industry Revenue (billion), by Country 2025 & 2033
- Figure 13: Europe US Power EPC Industry Revenue Share (%), by Country 2025 & 2033
- Figure 14: Middle East & Africa US Power EPC Industry Revenue (billion), by Type 2025 & 2033
- Figure 15: Middle East & Africa US Power EPC Industry Revenue Share (%), by Type 2025 & 2033
- Figure 16: Middle East & Africa US Power EPC Industry Revenue (billion), by Country 2025 & 2033
- Figure 17: Middle East & Africa US Power EPC Industry Revenue Share (%), by Country 2025 & 2033
- Figure 18: Asia Pacific US Power EPC Industry Revenue (billion), by Type 2025 & 2033
- Figure 19: Asia Pacific US Power EPC Industry Revenue Share (%), by Type 2025 & 2033
- Figure 20: Asia Pacific US Power EPC Industry Revenue (billion), by Country 2025 & 2033
- Figure 21: Asia Pacific US Power EPC Industry Revenue Share (%), by Country 2025 & 2033
List of Tables
- Table 1: Global US Power EPC Industry Revenue billion Forecast, by Type 2020 & 2033
- Table 2: Global US Power EPC Industry Revenue billion Forecast, by Region 2020 & 2033
- Table 3: Global US Power EPC Industry Revenue billion Forecast, by Type 2020 & 2033
- Table 4: Global US Power EPC Industry Revenue billion Forecast, by Country 2020 & 2033
- Table 5: United States US Power EPC Industry Revenue (billion) Forecast, by Application 2020 & 2033
- Table 6: Canada US Power EPC Industry Revenue (billion) Forecast, by Application 2020 & 2033
- Table 7: Mexico US Power EPC Industry Revenue (billion) Forecast, by Application 2020 & 2033
- Table 8: Global US Power EPC Industry Revenue billion Forecast, by Type 2020 & 2033
- Table 9: Global US Power EPC Industry Revenue billion Forecast, by Country 2020 & 2033
- Table 10: Brazil US Power EPC Industry Revenue (billion) Forecast, by Application 2020 & 2033
- Table 11: Argentina US Power EPC Industry Revenue (billion) Forecast, by Application 2020 & 2033
- Table 12: Rest of South America US Power EPC Industry Revenue (billion) Forecast, by Application 2020 & 2033
- Table 13: Global US Power EPC Industry Revenue billion Forecast, by Type 2020 & 2033
- Table 14: Global US Power EPC Industry Revenue billion Forecast, by Country 2020 & 2033
- Table 15: United Kingdom US Power EPC Industry Revenue (billion) Forecast, by Application 2020 & 2033
- Table 16: Germany US Power EPC Industry Revenue (billion) Forecast, by Application 2020 & 2033
- Table 17: France US Power EPC Industry Revenue (billion) Forecast, by Application 2020 & 2033
- Table 18: Italy US Power EPC Industry Revenue (billion) Forecast, by Application 2020 & 2033
- Table 19: Spain US Power EPC Industry Revenue (billion) Forecast, by Application 2020 & 2033
- Table 20: Russia US Power EPC Industry Revenue (billion) Forecast, by Application 2020 & 2033
- Table 21: Benelux US Power EPC Industry Revenue (billion) Forecast, by Application 2020 & 2033
- Table 22: Nordics US Power EPC Industry Revenue (billion) Forecast, by Application 2020 & 2033
- Table 23: Rest of Europe US Power EPC Industry Revenue (billion) Forecast, by Application 2020 & 2033
- Table 24: Global US Power EPC Industry Revenue billion Forecast, by Type 2020 & 2033
- Table 25: Global US Power EPC Industry Revenue billion Forecast, by Country 2020 & 2033
- Table 26: Turkey US Power EPC Industry Revenue (billion) Forecast, by Application 2020 & 2033
- Table 27: Israel US Power EPC Industry Revenue (billion) Forecast, by Application 2020 & 2033
- Table 28: GCC US Power EPC Industry Revenue (billion) Forecast, by Application 2020 & 2033
- Table 29: North Africa US Power EPC Industry Revenue (billion) Forecast, by Application 2020 & 2033
- Table 30: South Africa US Power EPC Industry Revenue (billion) Forecast, by Application 2020 & 2033
- Table 31: Rest of Middle East & Africa US Power EPC Industry Revenue (billion) Forecast, by Application 2020 & 2033
- Table 32: Global US Power EPC Industry Revenue billion Forecast, by Type 2020 & 2033
- Table 33: Global US Power EPC Industry Revenue billion Forecast, by Country 2020 & 2033
- Table 34: China US Power EPC Industry Revenue (billion) Forecast, by Application 2020 & 2033
- Table 35: India US Power EPC Industry Revenue (billion) Forecast, by Application 2020 & 2033
- Table 36: Japan US Power EPC Industry Revenue (billion) Forecast, by Application 2020 & 2033
- Table 37: South Korea US Power EPC Industry Revenue (billion) Forecast, by Application 2020 & 2033
- Table 38: ASEAN US Power EPC Industry Revenue (billion) Forecast, by Application 2020 & 2033
- Table 39: Oceania US Power EPC Industry Revenue (billion) Forecast, by Application 2020 & 2033
- Table 40: Rest of Asia Pacific US Power EPC Industry Revenue (billion) Forecast, by Application 2020 & 2033
Frequently Asked Questions
1. What is the projected Compound Annual Growth Rate (CAGR) of the US Power EPC Industry?
The projected CAGR is approximately 2.85%.
2. Which companies are prominent players in the US Power EPC Industry?
Key companies in the market include Jacobs Engineering Group Inc, Bechtel Corporation, Gemma Power Holdings, Siemens AG, Fluor Corporation, John Wood Group PLC, JGC Corporation.
3. What are the main segments of the US Power EPC Industry?
The market segments include Type.
4. Can you provide details about the market size?
The market size is estimated to be USD 107.2 billion as of 2022.
5. What are some drivers contributing to market growth?
4.; Growing Vehicle Ownership4.; Government Initiatives.
6. What are the notable trends driving market growth?
Thermal Type Sub-segment to Dominate the Market.
7. Are there any restraints impacting market growth?
4.; Volatile Crude Oil Prices.
8. Can you provide examples of recent developments in the market?
In March 2021, Decade Corporation and Bechtel Oil & Gas and Chemicals Inc. (Bechtel) announced the completion of engineering, procurement, and construction agreements for the first three trains at NextDecade's Rio Grande LNG project.
9. What pricing options are available for accessing the report?
Pricing options include single-user, multi-user, and enterprise licenses priced at USD 3800, USD 4500, and USD 5800 respectively.
10. Is the market size provided in terms of value or volume?
The market size is provided in terms of value, measured in billion.
11. Are there any specific market keywords associated with the report?
Yes, the market keyword associated with the report is "US Power EPC Industry," which aids in identifying and referencing the specific market segment covered.
12. How do I determine which pricing option suits my needs best?
The pricing options vary based on user requirements and access needs. Individual users may opt for single-user licenses, while businesses requiring broader access may choose multi-user or enterprise licenses for cost-effective access to the report.
13. Are there any additional resources or data provided in the US Power EPC Industry report?
While the report offers comprehensive insights, it's advisable to review the specific contents or supplementary materials provided to ascertain if additional resources or data are available.
14. How can I stay updated on further developments or reports in the US Power EPC Industry?
To stay informed about further developments, trends, and reports in the US Power EPC Industry, consider subscribing to industry newsletters, following relevant companies and organizations, or regularly checking reputable industry news sources and publications.
Methodology
Step 1 - Identification of Relevant Samples Size from Population Database


Step 2 - Approaches for Defining Global Market Size (Value, Volume* & Price*)

Note*: In applicable scenarios
Step 3 - Data Sources
Primary Research
- Web Analytics
- Survey Reports
- Research Institute
- Latest Research Reports
- Opinion Leaders
Secondary Research
- Annual Reports
- White Paper
- Latest Press Release
- Industry Association
- Paid Database
- Investor Presentations

Step 4 - Data Triangulation
Involves using different sources of information in order to increase the validity of a study
These sources are likely to be stakeholders in a program - participants, other researchers, program staff, other community members, and so on.
Then we put all data in single framework & apply various statistical tools to find out the dynamic on the market.
During the analysis stage, feedback from the stakeholder groups would be compared to determine areas of agreement as well as areas of divergence