

Key Insights
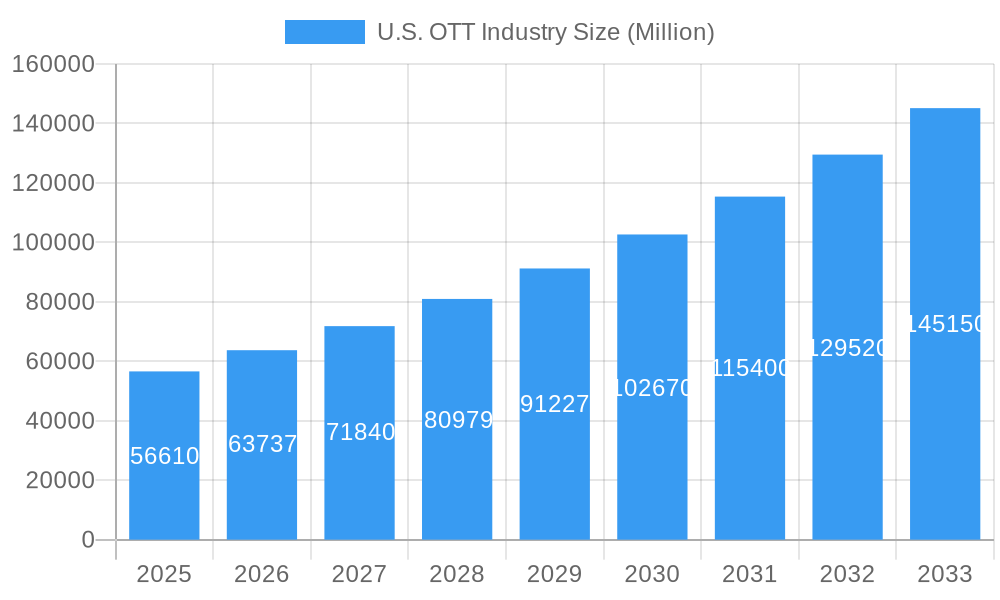
The U.S. Over-the-Top (OTT) video streaming market is experiencing robust growth, projected to reach a market size of $56.61 billion in 2025 and maintain a Compound Annual Growth Rate (CAGR) of 12.56% from 2025 to 2033. This expansion is fueled by several key drivers. The increasing affordability and accessibility of high-speed internet, coupled with the rising adoption of smart TVs and mobile devices, are significantly broadening the market's reach. Consumer preference for on-demand content and personalized viewing experiences further contributes to the market's dynamism. The diverse range of subscription models (SVOD, TVOD, AVOD) caters to various consumer preferences and budgets, stimulating competition and innovation. The entry and expansion of major players like Netflix, Disney+, Amazon Prime Video, and HBO Max, alongside niche services like Sling TV and Roku, ensures a consistently evolving content landscape. Regional variations exist, with potentially higher growth in areas with faster internet penetration and higher disposable incomes. However, challenges such as increasing content production costs, competition from traditional cable providers, and concerns around data privacy could potentially moderate market expansion in the coming years.
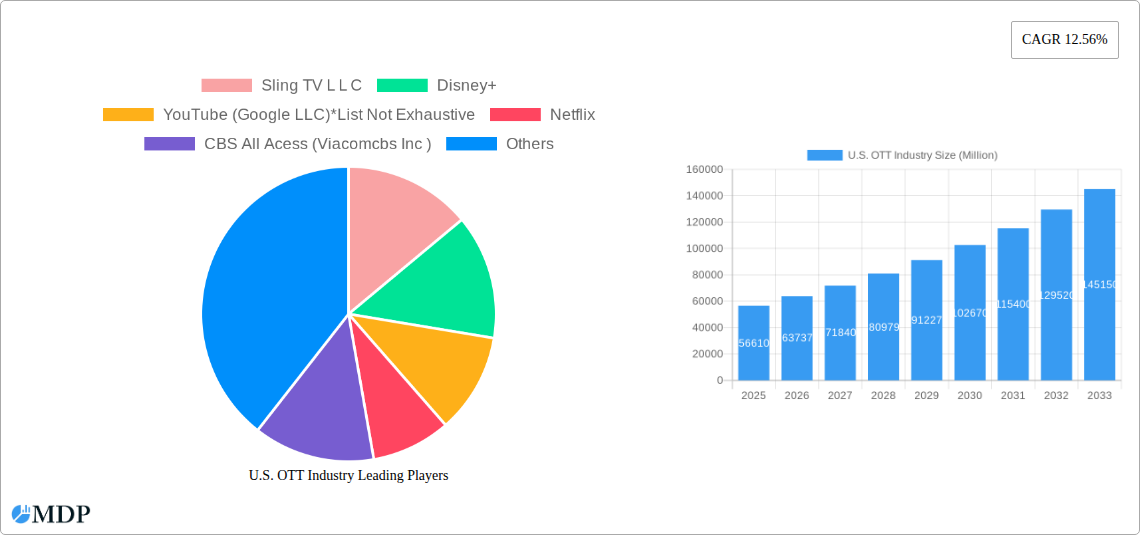
U.S. OTT Industry Market Size (In Billion)
The forecast for the U.S. OTT market suggests continued strong growth throughout the 2025-2033 period. This sustained growth trajectory hinges on ongoing technological advancements, expanding content libraries, and the evolution of personalized user experiences. Competition will likely intensify, driving innovation in areas like interactive content, immersive viewing experiences, and personalized recommendations. Furthermore, potential regulatory changes and evolving consumer behavior will be crucial factors influencing the market's future trajectory. The ongoing integration of OTT platforms with other entertainment technologies and the expansion into new markets, such as virtual reality and augmented reality, present significant opportunities for future expansion and growth. The market's success will depend on the ability of providers to adapt to changing viewer preferences and technological advancements.
U.S. OTT Industry Company Market Share
U.S. Over-the-Top (OTT) Industry Market Report: 2019-2033
Uncover the explosive growth and evolving landscape of the U.S. OTT industry with this comprehensive market analysis. This report provides in-depth insights into market dynamics, leading players, emerging trends, and future growth opportunities, covering the period from 2019 to 2033. This report is crucial for investors, industry stakeholders, and strategic decision-makers seeking a competitive edge in this rapidly transforming market.
U.S. OTT Industry Market Dynamics & Concentration
The U.S. OTT market, valued at $XX Million in 2024, is experiencing significant growth fueled by increasing internet penetration, affordable data plans, and rising consumer demand for on-demand content. Market concentration is high, with a few dominant players commanding significant market share. Netflix, Disney+, and Amazon Prime Video lead the SVOD segment, while YouTube dominates AVOD. The market is characterized by intense competition, with companies engaging in aggressive content acquisition, technological innovation, and strategic partnerships.
- Market Concentration: The top 5 players hold approximately 70% of the market share in 2024.
- Innovation Drivers: Technological advancements like 4K streaming, HDR, and AI-powered recommendation engines are driving growth.
- Regulatory Framework: The evolving regulatory landscape concerning data privacy and content regulation impacts industry players.
- Product Substitutes: Traditional cable TV and satellite services face increasing competition from OTT platforms.
- End-User Trends: Cord-cutting, binge-watching, and personalized content consumption are shaping consumer behavior.
- M&A Activities: The number of M&A deals in the OTT industry increased by xx% from 2023 to 2024, indicating a consolidating market.
U.S. OTT Industry Trends & Analysis
The U.S. OTT market is projected to reach $XX Million by 2033, exhibiting a CAGR of xx% during the forecast period (2025-2033). Key growth drivers include the increasing adoption of smart TVs, mobile devices, and affordable high-speed internet. Technological disruptions, such as the rise of 5G and improved streaming capabilities, are further accelerating market expansion. Consumer preferences are shifting towards personalized content, ad-supported models, and immersive viewing experiences. Competitive dynamics are marked by fierce competition for content acquisition, subscriber acquisition, and technological innovation. Market penetration of OTT services continues to grow, exceeding xx% in 2024.
Leading Markets & Segments in U.S. OTT Industry
The SVOD segment dominates the U.S. OTT market, accounting for approximately xx% of the total revenue in 2024. Its dominance is driven by the high demand for on-demand, ad-free content.
- Key Drivers of SVOD Dominance:
- High consumer preference for on-demand content.
- Wide range of exclusive and original programming.
- Increasing affordability and accessibility of high-speed internet.
The AVOD segment shows significant growth potential, driven by the growing popularity of free, ad-supported content. TVOD is a smaller segment compared to SVOD and AVOD, but still plays a significant role in the market.
- Geographic Dominance: The market is geographically distributed across the U.S. with penetration higher in urban areas.
U.S. OTT Industry Product Developments
Recent product innovations include advancements in personalized recommendation algorithms, interactive content, and immersive viewing experiences using VR/AR technologies. These innovations enhance user experience, increasing customer engagement and loyalty. Competition is driving companies to develop unique content and features to stand out in a crowded market. The market fit for new products hinges on factors like affordability, accessibility, and alignment with evolving consumer preferences.
Key Drivers of U.S. OTT Industry Growth
Several factors fuel the U.S. OTT industry's growth:
- Technological Advancements: Improved streaming technology, higher bandwidth, and the proliferation of smart devices.
- Economic Factors: Increasing disposable incomes and the affordability of internet access.
- Regulatory Changes: Favorable regulatory environments promoting competition and innovation.
Challenges in the U.S. OTT Industry Market
The U.S. OTT industry faces several challenges:
- Content Acquisition Costs: The high cost of acquiring and producing high-quality content puts pressure on profitability.
- Competition: Intense competition among numerous OTT platforms necessitates constant innovation.
- Piracy: Illegal streaming significantly impacts revenue for legitimate platforms.
Emerging Opportunities in U.S. OTT Industry
The long-term growth of the U.S. OTT market hinges on:
- Technological Breakthroughs: The emergence of new technologies like 5G and improved streaming capabilities will create new opportunities.
- Strategic Partnerships: Collaborations between OTT platforms and content creators will drive growth.
- Market Expansion: Focus on underserved demographics and geographic regions.
Leading Players in the U.S. OTT Industry Sector
Key Milestones in U.S. OTT Industry Industry
- Jul 2022: Netflix acquired Animal Logic, accelerating its animation production capabilities.
- Apr 2022: Roku and Amazon extended their distribution agreement, ensuring continued access to Prime Video on Roku devices.
Strategic Outlook for U.S. OTT Industry Market
The future of the U.S. OTT market holds immense potential. Strategic partnerships, technological innovations, and aggressive content strategies will be crucial for success. The market is poised for continued growth, driven by increasing consumer demand, technological advancements, and the evolving regulatory landscape. Companies that adapt to changing consumer preferences and embrace innovation will thrive in this dynamic environment.
U.S. OTT Industry Segmentation
-
1. Type
- 1.1. SVoD
- 1.2. TVoD
- 1.3. AVoD
U.S. OTT Industry Segmentation By Geography
- 1. U.S.
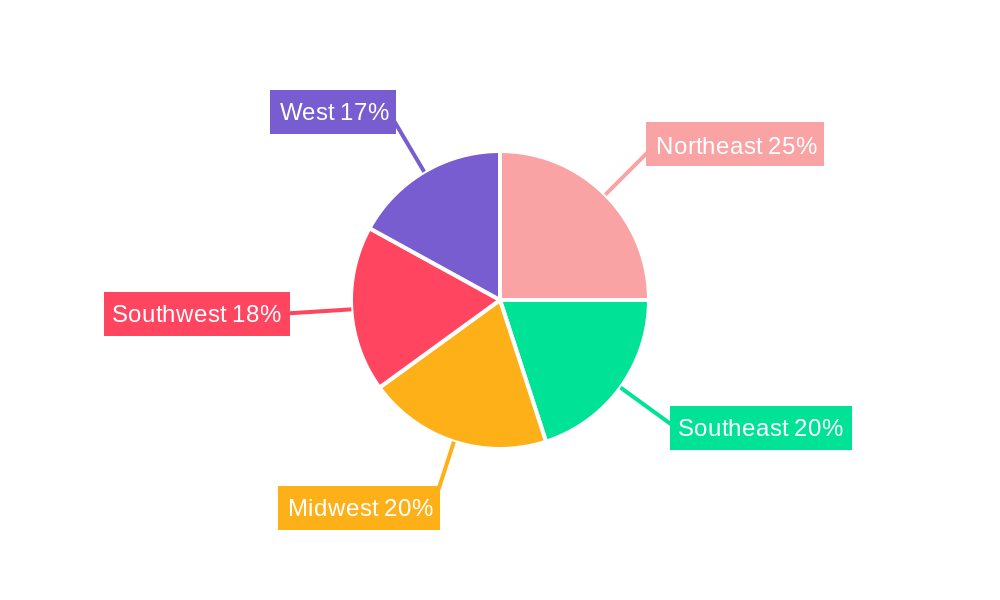
U.S. OTT Industry Regional Market Share
Geographic Coverage of U.S. OTT Industry
U.S. OTT Industry REPORT HIGHLIGHTS
| Aspects | Details |
|---|---|
| Study Period | 2020-2034 |
| Base Year | 2025 |
| Estimated Year | 2026 |
| Forecast Period | 2026-2034 |
| Historical Period | 2020-2025 |
| Growth Rate | CAGR of 12.56% from 2020-2034 |
| Segmentation |
|
Table of Contents
- 1. Introduction
- 1.1. Research Scope
- 1.2. Market Segmentation
- 1.3. Research Objective
- 1.4. Definitions and Assumptions
- 2. Executive Summary
- 2.1. Market Snapshot
- 3. Market Dynamics
- 3.1. Market Drivers
- 3.2. Market Restrains
- 3.3. Market Trends
- 3.4. Market Opportunities
- 4. Market Factor Analysis
- 4.1. Porters Five Forces
- 4.1.1. Bargaining Power of Suppliers
- 4.1.2. Bargaining Power of Buyers
- 4.1.3. Threat of New Entrants
- 4.1.4. Threat of Substitutes
- 4.1.5. Competitive Rivalry
- 4.2. PESTEL analysis
- 4.3. BCG Analysis
- 4.3.1. Stars (High Growth, High Market Share)
- 4.3.2. Cash Cows (Low Growth, High Market Share)
- 4.3.3. Question Mark (High Growth, Low Market Share)
- 4.3.4. Dogs (Low Growth, Low Market Share)
- 4.4. Ansoff Matrix Analysis
- 4.5. Supply Chain Analysis
- 4.6. Regulatory Landscape
- 4.7. Current Market Potential and Opportunity Assessment (TAM–SAM–SOM Framework)
- 4.8. MDP Analyst Note
- 4.1. Porters Five Forces
- 5. Market Analysis, Insights and Forecast 2021-2033
- 5.1. Market Analysis, Insights and Forecast - by Type
- 5.1.1. SVoD
- 5.1.2. TVoD
- 5.1.3. AVoD
- 5.2. Market Analysis, Insights and Forecast - by Region
- 5.2.1. U.S.
- 5.1. Market Analysis, Insights and Forecast - by Type
- 6. U.S. OTT Industry Analysis, Insights and Forecast, 2021-2033
- 6.1. Market Analysis, Insights and Forecast - by Type
- 6.1.1. SVoD
- 6.1.2. TVoD
- 6.1.3. AVoD
- 6.1. Market Analysis, Insights and Forecast - by Type
- 7. Competitive Analysis
- 7.1. Company Profiles
- 7.1.1 Sling TV L L C
- 7.1.1.1. Company Overview
- 7.1.1.2. Products
- 7.1.1.3. Company Financials
- 7.1.1.4. SWOT Analysis
- 7.1.2 Disney+
- 7.1.2.1. Company Overview
- 7.1.2.2. Products
- 7.1.2.3. Company Financials
- 7.1.2.4. SWOT Analysis
- 7.1.3 YouTube (Google LLC)*List Not Exhaustive
- 7.1.3.1. Company Overview
- 7.1.3.2. Products
- 7.1.3.3. Company Financials
- 7.1.3.4. SWOT Analysis
- 7.1.4 Netflix
- 7.1.4.1. Company Overview
- 7.1.4.2. Products
- 7.1.4.3. Company Financials
- 7.1.4.4. SWOT Analysis
- 7.1.5 CBS All Acess (Viacomcbs Inc )
- 7.1.5.1. Company Overview
- 7.1.5.2. Products
- 7.1.5.3. Company Financials
- 7.1.5.4. SWOT Analysis
- 7.1.6 Roku
- 7.1.6.1. Company Overview
- 7.1.6.2. Products
- 7.1.6.3. Company Financials
- 7.1.6.4. SWOT Analysis
- 7.1.7 Amazon Prime Video
- 7.1.7.1. Company Overview
- 7.1.7.2. Products
- 7.1.7.3. Company Financials
- 7.1.7.4. SWOT Analysis
- 7.1.8 Apple Inc
- 7.1.8.1. Company Overview
- 7.1.8.2. Products
- 7.1.8.3. Company Financials
- 7.1.8.4. SWOT Analysis
- 7.1.9 HBO Max (AT&T Inc )
- 7.1.9.1. Company Overview
- 7.1.9.2. Products
- 7.1.9.3. Company Financials
- 7.1.9.4. SWOT Analysis
- 7.1.1 Sling TV L L C
- 7.2. Market Entropy
- 7.2.1 Company's Key Areas Served
- 7.2.2 Recent Developments
- 7.3. Company Market Share Analysis 2025
- 7.3.1 Top 5 Companies Market Share Analysis
- 7.3.2 Top 3 Companies Market Share Analysis
- 7.4. List of Potential Customers
- 8. Research Methodology
List of Figures
- Figure 1: U.S. OTT Industry Revenue Breakdown (Million, %) by Product 2025 & 2033
- Figure 2: U.S. OTT Industry Share (%) by Company 2025
List of Tables
- Table 1: U.S. OTT Industry Revenue Million Forecast, by Type 2020 & 2033
- Table 2: U.S. OTT Industry Revenue Million Forecast, by Region 2020 & 2033
- Table 3: U.S. OTT Industry Revenue Million Forecast, by Type 2020 & 2033
- Table 4: U.S. OTT Industry Revenue Million Forecast, by Country 2020 & 2033
Frequently Asked Questions
1. What is the projected Compound Annual Growth Rate (CAGR) of the U.S. OTT Industry?
The projected CAGR is approximately 12.56%.
2. Which companies are prominent players in the U.S. OTT Industry?
Key companies in the market include Sling TV L L C, Disney+, YouTube (Google LLC)*List Not Exhaustive, Netflix, CBS All Acess (Viacomcbs Inc ), Roku, Amazon Prime Video, Apple Inc, HBO Max (AT&T Inc ).
3. What are the main segments of the U.S. OTT Industry?
The market segments include Type.
4. Can you provide details about the market size?
The market size is estimated to be USD 56.61 Million as of 2022.
5. What are some drivers contributing to market growth?
High Penetration of Smart TV and the Presence of Major OTT Providers have Contributed to the Growth of OTT Adoption in the Region; Market Consolidation to Result in Emphasis on Collaboration and Partnerships.
6. What are the notable trends driving market growth?
High Penetration of Smart TV Witnesses a Significant Growth.
7. Are there any restraints impacting market growth?
Growing Threat of Video Content Piracy and Security Threat of User Database Due to Spyware.
8. Can you provide examples of recent developments in the market?
Jul 2022: Netflix acquired Animal Logic, the world's leading independent animation studio. This acquisition is expected to speed up Netflix's development of end-to-end animation production abilities. Netflix Animation and Animal Logic together are anticipated to form a worldwide creative production team as well as an animation studio that will create some of Netflix's most popular animated feature titles.
9. What pricing options are available for accessing the report?
Pricing options include single-user, multi-user, and enterprise licenses priced at USD 3800, USD 4500, and USD 5800 respectively.
10. Is the market size provided in terms of value or volume?
The market size is provided in terms of value, measured in Million.
11. Are there any specific market keywords associated with the report?
Yes, the market keyword associated with the report is "U.S. OTT Industry," which aids in identifying and referencing the specific market segment covered.
12. How do I determine which pricing option suits my needs best?
The pricing options vary based on user requirements and access needs. Individual users may opt for single-user licenses, while businesses requiring broader access may choose multi-user or enterprise licenses for cost-effective access to the report.
13. Are there any additional resources or data provided in the U.S. OTT Industry report?
While the report offers comprehensive insights, it's advisable to review the specific contents or supplementary materials provided to ascertain if additional resources or data are available.
14. How can I stay updated on further developments or reports in the U.S. OTT Industry?
To stay informed about further developments, trends, and reports in the U.S. OTT Industry, consider subscribing to industry newsletters, following relevant companies and organizations, or regularly checking reputable industry news sources and publications.
Methodology
Step 1 - Identification of Relevant Samples Size from Population Database


Step 2 - Approaches for Defining Global Market Size (Value, Volume* & Price*)

Note*: In applicable scenarios
Step 3 - Data Sources
Primary Research
- Web Analytics
- Survey Reports
- Research Institute
- Latest Research Reports
- Opinion Leaders
Secondary Research
- Annual Reports
- White Paper
- Latest Press Release
- Industry Association
- Paid Database
- Investor Presentations

Step 4 - Data Triangulation
Involves using different sources of information in order to increase the validity of a study
These sources are likely to be stakeholders in a program - participants, other researchers, program staff, other community members, and so on.
Then we put all data in single framework & apply various statistical tools to find out the dynamic on the market.
During the analysis stage, feedback from the stakeholder groups would be compared to determine areas of agreement as well as areas of divergence