

Key Insights
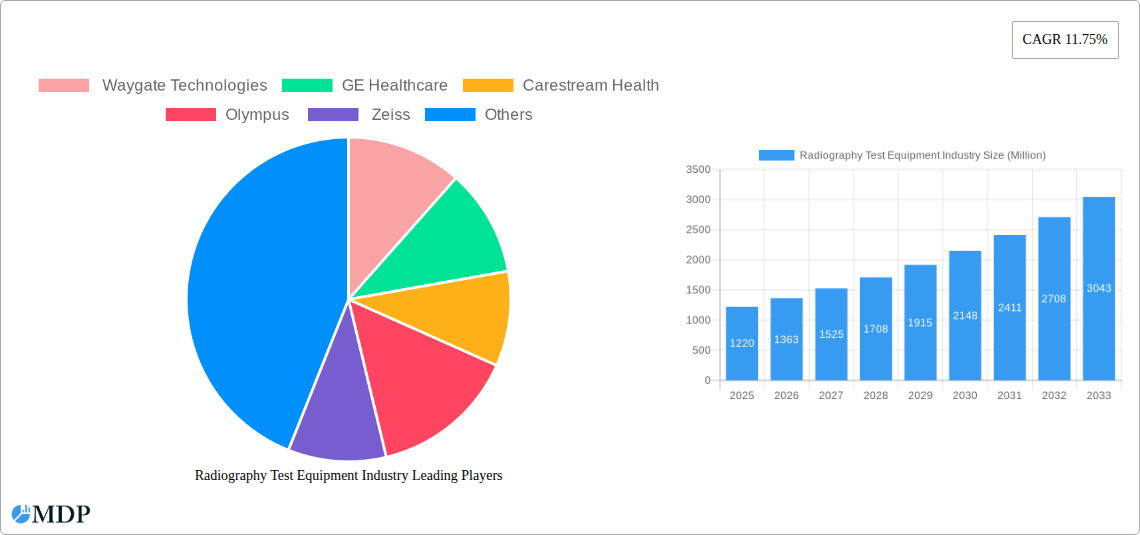
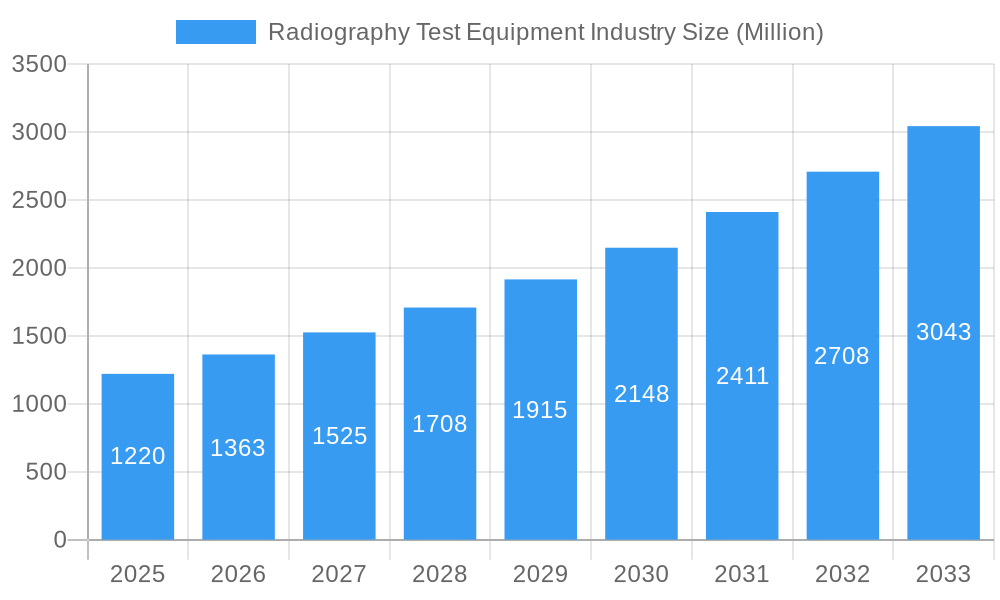
The global radiography test equipment market is experiencing robust growth, projected to reach a market size of $1.22 billion in 2025 and exhibiting a compound annual growth rate (CAGR) of 11.75% from 2025 to 2033. This expansion is fueled by several key drivers. Increasing demand for non-destructive testing (NDT) in diverse sectors like aerospace & defense (driven by stringent quality control needs and rising aircraft production), energy & power (for pipeline inspection and infrastructure maintenance), and automotive (for ensuring component integrity) is a major factor. Advancements in technology, particularly the adoption of digital radiography techniques (Computed Radiography and Direct Radiography) offering higher resolution, faster processing times, and improved image quality, are further propelling market growth. Furthermore, the growing adoption of Computed Tomography (CT) for detailed internal inspections contributes significantly to market expansion. While the market faces some restraints such as high initial investment costs for advanced equipment and the need for skilled personnel, the overall positive industry outlook prevails, driven by the aforementioned factors. The market segmentation reveals a strong presence across various regions, with North America and Europe currently holding significant market share, but Asia Pacific is anticipated to experience rapid growth driven by industrialization and infrastructure development.
Radiography Test Equipment Industry Market Size (In Billion)
The competitive landscape is marked by the presence of both established players like GE Healthcare, Carestream Health, and Fujifilm, along with specialized technology providers such as Waygate Technologies and Nikon Metrology. These companies are actively investing in R&D to develop innovative solutions, including AI-powered image analysis and automation features to improve efficiency and accuracy. The ongoing trend towards miniaturization and portability of radiography equipment is expanding applications to remote locations and challenging environments. Future growth will likely depend on effective strategies to address regulatory compliance, the integration of advanced data analytics for predictive maintenance, and the continued development of user-friendly software and training programs to broaden the adoption of these technologies across diverse industries. The market's growth trajectory suggests a promising future for radiography test equipment, characterized by continuous technological innovation and increasing demand across a wide spectrum of industrial applications.
Radiography Test Equipment Industry Company Market Share
Radiography Test Equipment Industry Market Report: 2019-2033
This comprehensive report provides an in-depth analysis of the Radiography Test Equipment industry, offering valuable insights for stakeholders seeking to understand market dynamics, trends, and future opportunities. Covering the period from 2019 to 2033, with a focus on 2025, this report analyzes market size, segmentation, leading players, and key growth drivers, providing a crucial resource for informed decision-making. The market is estimated at xx Million in 2025 and is projected to reach xx Million by 2033.
Radiography Test Equipment Industry Market Dynamics & Concentration
The global radiography test equipment market is characterized by a moderate level of concentration, with key players like Waygate Technologies, GE Healthcare, Carestream Health, Olympus, Zeiss, Fujifilm, SLB, Nikon Metrology, Hexagon, and TeraRecon holding significant market share. The combined market share of the top five players is estimated at xx%.
Innovation is a key driver, with ongoing advancements in digital radiography, including Computed Tomography (CT) and Direct Radiography (DR), leading to improved image quality, faster processing times, and reduced radiation exposure. Stringent regulatory frameworks governing radiation safety and equipment standards influence market dynamics. Product substitutes, such as ultrasound and magnetic resonance imaging (MRI), exist but often lack the penetration capabilities of radiography for certain applications.
End-user trends toward automation and enhanced non-destructive testing (NDT) methods are boosting demand. The market has witnessed several mergers and acquisitions (M&A) activities in recent years, with xx M&A deals recorded between 2019 and 2024. These activities aim to expand product portfolios, enhance technological capabilities, and consolidate market presence.
Radiography Test Equipment Industry Industry Trends & Analysis
The radiography test equipment market exhibits a robust growth trajectory, driven primarily by rising demand across various end-user verticals, especially in sectors with stringent quality control requirements. Technological advancements such as the development of portable and lightweight systems, coupled with improved image processing software, are further boosting market expansion. The market experienced a CAGR of xx% during the historical period (2019-2024) and is projected to maintain a CAGR of xx% during the forecast period (2025-2033). Market penetration of DR systems continues to rise, surpassing film radiography in several applications. Competitive dynamics are shaped by ongoing innovation, strategic partnerships, and the pursuit of cost-effective solutions. Consumer preference is shifting toward systems offering higher resolution, improved efficiency, and reduced operational costs.
Leading Markets & Segments in Radiography Test Equipment Industry
The Aerospace and Defense sector is a dominant end-user segment, driven by rigorous quality control needs in aircraft and weapon manufacturing. The Energy and Power sector also represents a significant market, with applications in pipeline inspection, power plant maintenance, and nuclear facility monitoring.
- Key Drivers in Aerospace & Defense: Stringent safety regulations, high-precision testing requirements, growing defense budgets.
- Key Drivers in Energy & Power: Aging infrastructure requiring regular inspections, need for improved safety and efficiency, rising energy demands.
- Geographic Dominance: North America and Europe currently hold the largest market share, but Asia-Pacific is expected to experience significant growth in the coming years due to increasing infrastructure development and industrialization.
The Direct Radiography (DR) segment dominates the technology landscape, owing to its superior image quality, faster processing speed, and reduced radiation exposure compared to film radiography and computed radiography (CR). Computed Tomography (CT) systems cater to specialized applications demanding high-resolution 3D imaging.
Radiography Test Equipment Industry Product Developments
Recent advancements in radiography test equipment focus on improving image quality, portability, and ease of use. Miniaturization of components, development of high-resolution detectors, and sophisticated image processing algorithms are key trends. The introduction of AI-powered image analysis tools enhances the efficiency and accuracy of defect detection. These developments cater to the growing demand for faster, more reliable, and cost-effective non-destructive testing solutions.
Key Drivers of Radiography Test Equipment Industry Growth
Several factors drive market growth, including rising investments in infrastructure projects (like India's INR 111 crore National Infrastructure Pipeline), increased manufacturing activities (as seen in Ford's USD 1.05 billion investment in South Africa), stringent safety regulations, and technological advancements leading to improved image quality and reduced radiation exposure. Government initiatives promoting industrial development and infrastructure investments further fuel market expansion.
Challenges in the Radiography Test Equipment Industry Market
The market faces challenges including stringent regulatory requirements for radiation safety, potential supply chain disruptions affecting component availability, and intense competition from established players and emerging innovators. Fluctuations in raw material prices and economic downturns can also impact market growth. These factors may lead to pricing pressures and increased operational costs, potentially hindering market expansion.
Emerging Opportunities in Radiography Test Equipment Industry
The market is poised for substantial growth, fueled by several emerging trends. The integration of advanced technologies such as artificial intelligence and machine learning into radiography systems will enhance image analysis and defect detection capabilities. Strategic partnerships between equipment manufacturers and software developers are creating innovative solutions, and market expansion into emerging economies presents significant potential for growth.
Leading Players in the Radiography Test Equipment Industry Sector
- Waygate Technologies
- GE Healthcare
- Carestream Health
- Olympus
- Zeiss
- Fujifilm
- SLB
- Nikon Metrology
- Hexagon
- TeraRecon
Key Milestones in Radiography Test Equipment Industry Industry
- August 2020: The Indian government's INR 111 crore National Infrastructure Pipeline, encompassing 6,835 projects, is expected to significantly boost demand for radiography equipment in the construction and infrastructure sectors.
- February 2021: Ford's USD 1.05 billion investment in South African manufacturing operations signals increased demand for quality control and inspection equipment within the automotive sector.
Strategic Outlook for Radiography Test Equipment Industry Market
The radiography test equipment market exhibits strong growth potential driven by technological advancements, increasing infrastructure development globally, and rising demand across various end-user industries. Companies pursuing strategic partnerships, focused R&D, and expansion into high-growth markets are well-positioned to capitalize on this potential. A focus on developing user-friendly, portable, and cost-effective solutions will be crucial for future success.
Radiography Test Equipment Industry Segmentation
-
1. Technology
- 1.1. Film Radiography
- 1.2. Computed Radiography
- 1.3. Direct Radiography
- 1.4. Computed Tomography
-
2. End-user Vertical
- 2.1. Aerospace and Defense
- 2.2. Energy and Power
- 2.3. Construction
- 2.4. Oil and Gas
- 2.5. Automotive
- 2.6. Manufacturing
- 2.7. Other End-user Industries
Radiography Test Equipment Industry Segmentation By Geography
- 1. North America
- 2. Europe
- 3. Asia Pacific
- 4. Latin America
- 5. Middle East
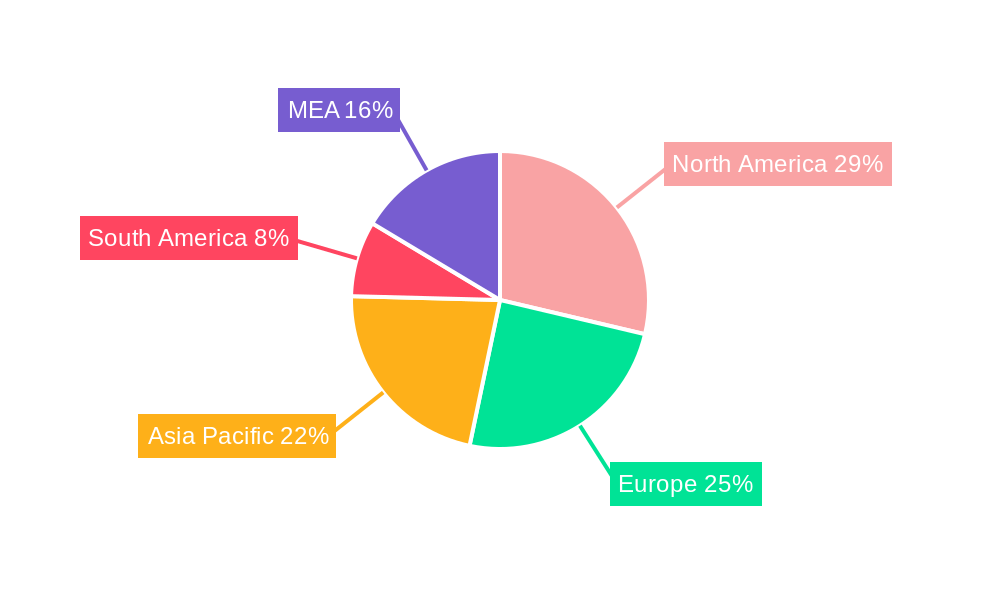
Radiography Test Equipment Industry Regional Market Share
Geographic Coverage of Radiography Test Equipment Industry
Radiography Test Equipment Industry REPORT HIGHLIGHTS
| Aspects | Details |
|---|---|
| Study Period | 2020-2034 |
| Base Year | 2025 |
| Estimated Year | 2026 |
| Forecast Period | 2026-2034 |
| Historical Period | 2020-2025 |
| Growth Rate | CAGR of 11.75% from 2020-2034 |
| Segmentation |
|
Table of Contents
- 1. Introduction
- 1.1. Research Scope
- 1.2. Market Segmentation
- 1.3. Research Objective
- 1.4. Definitions and Assumptions
- 2. Executive Summary
- 2.1. Market Snapshot
- 3. Market Dynamics
- 3.1. Market Drivers
- 3.2. Market Restrains
- 3.3. Market Trends
- 3.4. Market Opportunities
- 4. Market Factor Analysis
- 4.1. Porters Five Forces
- 4.1.1. Bargaining Power of Suppliers
- 4.1.2. Bargaining Power of Buyers
- 4.1.3. Threat of New Entrants
- 4.1.4. Threat of Substitutes
- 4.1.5. Competitive Rivalry
- 4.2. PESTEL analysis
- 4.3. BCG Analysis
- 4.3.1. Stars (High Growth, High Market Share)
- 4.3.2. Cash Cows (Low Growth, High Market Share)
- 4.3.3. Question Mark (High Growth, Low Market Share)
- 4.3.4. Dogs (Low Growth, Low Market Share)
- 4.4. Ansoff Matrix Analysis
- 4.5. Supply Chain Analysis
- 4.6. Regulatory Landscape
- 4.7. Current Market Potential and Opportunity Assessment (TAM–SAM–SOM Framework)
- 4.8. MDP Analyst Note
- 4.1. Porters Five Forces
- 5. Market Analysis, Insights and Forecast 2021-2033
- 5.1. Market Analysis, Insights and Forecast - by Technology
- 5.1.1. Film Radiography
- 5.1.2. Computed Radiography
- 5.1.3. Direct Radiography
- 5.1.4. Computed Tomography
- 5.2. Market Analysis, Insights and Forecast - by End-user Vertical
- 5.2.1. Aerospace and Defense
- 5.2.2. Energy and Power
- 5.2.3. Construction
- 5.2.4. Oil and Gas
- 5.2.5. Automotive
- 5.2.6. Manufacturing
- 5.2.7. Other End-user Industries
- 5.3. Market Analysis, Insights and Forecast - by Region
- 5.3.1. North America
- 5.3.2. Europe
- 5.3.3. Asia Pacific
- 5.3.4. Latin America
- 5.3.5. Middle East
- 5.1. Market Analysis, Insights and Forecast - by Technology
- 6. Global Radiography Test Equipment Industry Analysis, Insights and Forecast, 2021-2033
- 6.1. Market Analysis, Insights and Forecast - by Technology
- 6.1.1. Film Radiography
- 6.1.2. Computed Radiography
- 6.1.3. Direct Radiography
- 6.1.4. Computed Tomography
- 6.2. Market Analysis, Insights and Forecast - by End-user Vertical
- 6.2.1. Aerospace and Defense
- 6.2.2. Energy and Power
- 6.2.3. Construction
- 6.2.4. Oil and Gas
- 6.2.5. Automotive
- 6.2.6. Manufacturing
- 6.2.7. Other End-user Industries
- 6.1. Market Analysis, Insights and Forecast - by Technology
- 7. North America Radiography Test Equipment Industry Analysis, Insights and Forecast, 2020-2032
- 7.1. Market Analysis, Insights and Forecast - by Technology
- 7.1.1. Film Radiography
- 7.1.2. Computed Radiography
- 7.1.3. Direct Radiography
- 7.1.4. Computed Tomography
- 7.2. Market Analysis, Insights and Forecast - by End-user Vertical
- 7.2.1. Aerospace and Defense
- 7.2.2. Energy and Power
- 7.2.3. Construction
- 7.2.4. Oil and Gas
- 7.2.5. Automotive
- 7.2.6. Manufacturing
- 7.2.7. Other End-user Industries
- 7.1. Market Analysis, Insights and Forecast - by Technology
- 8. Europe Radiography Test Equipment Industry Analysis, Insights and Forecast, 2020-2032
- 8.1. Market Analysis, Insights and Forecast - by Technology
- 8.1.1. Film Radiography
- 8.1.2. Computed Radiography
- 8.1.3. Direct Radiography
- 8.1.4. Computed Tomography
- 8.2. Market Analysis, Insights and Forecast - by End-user Vertical
- 8.2.1. Aerospace and Defense
- 8.2.2. Energy and Power
- 8.2.3. Construction
- 8.2.4. Oil and Gas
- 8.2.5. Automotive
- 8.2.6. Manufacturing
- 8.2.7. Other End-user Industries
- 8.1. Market Analysis, Insights and Forecast - by Technology
- 9. Asia Pacific Radiography Test Equipment Industry Analysis, Insights and Forecast, 2020-2032
- 9.1. Market Analysis, Insights and Forecast - by Technology
- 9.1.1. Film Radiography
- 9.1.2. Computed Radiography
- 9.1.3. Direct Radiography
- 9.1.4. Computed Tomography
- 9.2. Market Analysis, Insights and Forecast - by End-user Vertical
- 9.2.1. Aerospace and Defense
- 9.2.2. Energy and Power
- 9.2.3. Construction
- 9.2.4. Oil and Gas
- 9.2.5. Automotive
- 9.2.6. Manufacturing
- 9.2.7. Other End-user Industries
- 9.1. Market Analysis, Insights and Forecast - by Technology
- 10. Latin America Radiography Test Equipment Industry Analysis, Insights and Forecast, 2020-2032
- 10.1. Market Analysis, Insights and Forecast - by Technology
- 10.1.1. Film Radiography
- 10.1.2. Computed Radiography
- 10.1.3. Direct Radiography
- 10.1.4. Computed Tomography
- 10.2. Market Analysis, Insights and Forecast - by End-user Vertical
- 10.2.1. Aerospace and Defense
- 10.2.2. Energy and Power
- 10.2.3. Construction
- 10.2.4. Oil and Gas
- 10.2.5. Automotive
- 10.2.6. Manufacturing
- 10.2.7. Other End-user Industries
- 10.1. Market Analysis, Insights and Forecast - by Technology
- 11. Middle East Radiography Test Equipment Industry Analysis, Insights and Forecast, 2020-2032
- 11.1. Market Analysis, Insights and Forecast - by Technology
- 11.1.1. Film Radiography
- 11.1.2. Computed Radiography
- 11.1.3. Direct Radiography
- 11.1.4. Computed Tomography
- 11.2. Market Analysis, Insights and Forecast - by End-user Vertical
- 11.2.1. Aerospace and Defense
- 11.2.2. Energy and Power
- 11.2.3. Construction
- 11.2.4. Oil and Gas
- 11.2.5. Automotive
- 11.2.6. Manufacturing
- 11.2.7. Other End-user Industries
- 11.1. Market Analysis, Insights and Forecast - by Technology
- 12. Competitive Analysis
- 12.1. Company Profiles
- 12.1.1 Waygate Technologies
- 12.1.1.1. Company Overview
- 12.1.1.2. Products
- 12.1.1.3. Company Financials
- 12.1.1.4. SWOT Analysis
- 12.1.2 GE Healthcare
- 12.1.2.1. Company Overview
- 12.1.2.2. Products
- 12.1.2.3. Company Financials
- 12.1.2.4. SWOT Analysis
- 12.1.3 Carestream Health
- 12.1.3.1. Company Overview
- 12.1.3.2. Products
- 12.1.3.3. Company Financials
- 12.1.3.4. SWOT Analysis
- 12.1.4 Olympus
- 12.1.4.1. Company Overview
- 12.1.4.2. Products
- 12.1.4.3. Company Financials
- 12.1.4.4. SWOT Analysis
- 12.1.5 Zeiss
- 12.1.5.1. Company Overview
- 12.1.5.2. Products
- 12.1.5.3. Company Financials
- 12.1.5.4. SWOT Analysis
- 12.1.6 Fujifilm
- 12.1.6.1. Company Overview
- 12.1.6.2. Products
- 12.1.6.3. Company Financials
- 12.1.6.4. SWOT Analysis
- 12.1.7 SLB
- 12.1.7.1. Company Overview
- 12.1.7.2. Products
- 12.1.7.3. Company Financials
- 12.1.7.4. SWOT Analysis
- 12.1.8 Nikon Metrology
- 12.1.8.1. Company Overview
- 12.1.8.2. Products
- 12.1.8.3. Company Financials
- 12.1.8.4. SWOT Analysis
- 12.1.9 Hexagon
- 12.1.9.1. Company Overview
- 12.1.9.2. Products
- 12.1.9.3. Company Financials
- 12.1.9.4. SWOT Analysis
- 12.1.10 TeraRecon
- 12.1.10.1. Company Overview
- 12.1.10.2. Products
- 12.1.10.3. Company Financials
- 12.1.10.4. SWOT Analysis
- 12.1.1 Waygate Technologies
- 12.2. Market Entropy
- 12.2.1 Company's Key Areas Served
- 12.2.2 Recent Developments
- 12.3. Company Market Share Analysis 2025
- 12.3.1 Top 5 Companies Market Share Analysis
- 12.3.2 Top 3 Companies Market Share Analysis
- 12.4. List of Potential Customers
- 13. Research Methodology
List of Figures
- Figure 1: Global Radiography Test Equipment Industry Revenue Breakdown (Million, %) by Region 2025 & 2033
- Figure 2: Global Radiography Test Equipment Industry Volume Breakdown (K Units, %) by Region 2025 & 2033
- Figure 3: North America Radiography Test Equipment Industry Revenue (Million), by Technology 2025 & 2033
- Figure 4: North America Radiography Test Equipment Industry Volume (K Units), by Technology 2025 & 2033
- Figure 5: North America Radiography Test Equipment Industry Revenue Share (%), by Technology 2025 & 2033
- Figure 6: North America Radiography Test Equipment Industry Volume Share (%), by Technology 2025 & 2033
- Figure 7: North America Radiography Test Equipment Industry Revenue (Million), by End-user Vertical 2025 & 2033
- Figure 8: North America Radiography Test Equipment Industry Volume (K Units), by End-user Vertical 2025 & 2033
- Figure 9: North America Radiography Test Equipment Industry Revenue Share (%), by End-user Vertical 2025 & 2033
- Figure 10: North America Radiography Test Equipment Industry Volume Share (%), by End-user Vertical 2025 & 2033
- Figure 11: North America Radiography Test Equipment Industry Revenue (Million), by Country 2025 & 2033
- Figure 12: North America Radiography Test Equipment Industry Volume (K Units), by Country 2025 & 2033
- Figure 13: North America Radiography Test Equipment Industry Revenue Share (%), by Country 2025 & 2033
- Figure 14: North America Radiography Test Equipment Industry Volume Share (%), by Country 2025 & 2033
- Figure 15: Europe Radiography Test Equipment Industry Revenue (Million), by Technology 2025 & 2033
- Figure 16: Europe Radiography Test Equipment Industry Volume (K Units), by Technology 2025 & 2033
- Figure 17: Europe Radiography Test Equipment Industry Revenue Share (%), by Technology 2025 & 2033
- Figure 18: Europe Radiography Test Equipment Industry Volume Share (%), by Technology 2025 & 2033
- Figure 19: Europe Radiography Test Equipment Industry Revenue (Million), by End-user Vertical 2025 & 2033
- Figure 20: Europe Radiography Test Equipment Industry Volume (K Units), by End-user Vertical 2025 & 2033
- Figure 21: Europe Radiography Test Equipment Industry Revenue Share (%), by End-user Vertical 2025 & 2033
- Figure 22: Europe Radiography Test Equipment Industry Volume Share (%), by End-user Vertical 2025 & 2033
- Figure 23: Europe Radiography Test Equipment Industry Revenue (Million), by Country 2025 & 2033
- Figure 24: Europe Radiography Test Equipment Industry Volume (K Units), by Country 2025 & 2033
- Figure 25: Europe Radiography Test Equipment Industry Revenue Share (%), by Country 2025 & 2033
- Figure 26: Europe Radiography Test Equipment Industry Volume Share (%), by Country 2025 & 2033
- Figure 27: Asia Pacific Radiography Test Equipment Industry Revenue (Million), by Technology 2025 & 2033
- Figure 28: Asia Pacific Radiography Test Equipment Industry Volume (K Units), by Technology 2025 & 2033
- Figure 29: Asia Pacific Radiography Test Equipment Industry Revenue Share (%), by Technology 2025 & 2033
- Figure 30: Asia Pacific Radiography Test Equipment Industry Volume Share (%), by Technology 2025 & 2033
- Figure 31: Asia Pacific Radiography Test Equipment Industry Revenue (Million), by End-user Vertical 2025 & 2033
- Figure 32: Asia Pacific Radiography Test Equipment Industry Volume (K Units), by End-user Vertical 2025 & 2033
- Figure 33: Asia Pacific Radiography Test Equipment Industry Revenue Share (%), by End-user Vertical 2025 & 2033
- Figure 34: Asia Pacific Radiography Test Equipment Industry Volume Share (%), by End-user Vertical 2025 & 2033
- Figure 35: Asia Pacific Radiography Test Equipment Industry Revenue (Million), by Country 2025 & 2033
- Figure 36: Asia Pacific Radiography Test Equipment Industry Volume (K Units), by Country 2025 & 2033
- Figure 37: Asia Pacific Radiography Test Equipment Industry Revenue Share (%), by Country 2025 & 2033
- Figure 38: Asia Pacific Radiography Test Equipment Industry Volume Share (%), by Country 2025 & 2033
- Figure 39: Latin America Radiography Test Equipment Industry Revenue (Million), by Technology 2025 & 2033
- Figure 40: Latin America Radiography Test Equipment Industry Volume (K Units), by Technology 2025 & 2033
- Figure 41: Latin America Radiography Test Equipment Industry Revenue Share (%), by Technology 2025 & 2033
- Figure 42: Latin America Radiography Test Equipment Industry Volume Share (%), by Technology 2025 & 2033
- Figure 43: Latin America Radiography Test Equipment Industry Revenue (Million), by End-user Vertical 2025 & 2033
- Figure 44: Latin America Radiography Test Equipment Industry Volume (K Units), by End-user Vertical 2025 & 2033
- Figure 45: Latin America Radiography Test Equipment Industry Revenue Share (%), by End-user Vertical 2025 & 2033
- Figure 46: Latin America Radiography Test Equipment Industry Volume Share (%), by End-user Vertical 2025 & 2033
- Figure 47: Latin America Radiography Test Equipment Industry Revenue (Million), by Country 2025 & 2033
- Figure 48: Latin America Radiography Test Equipment Industry Volume (K Units), by Country 2025 & 2033
- Figure 49: Latin America Radiography Test Equipment Industry Revenue Share (%), by Country 2025 & 2033
- Figure 50: Latin America Radiography Test Equipment Industry Volume Share (%), by Country 2025 & 2033
- Figure 51: Middle East Radiography Test Equipment Industry Revenue (Million), by Technology 2025 & 2033
- Figure 52: Middle East Radiography Test Equipment Industry Volume (K Units), by Technology 2025 & 2033
- Figure 53: Middle East Radiography Test Equipment Industry Revenue Share (%), by Technology 2025 & 2033
- Figure 54: Middle East Radiography Test Equipment Industry Volume Share (%), by Technology 2025 & 2033
- Figure 55: Middle East Radiography Test Equipment Industry Revenue (Million), by End-user Vertical 2025 & 2033
- Figure 56: Middle East Radiography Test Equipment Industry Volume (K Units), by End-user Vertical 2025 & 2033
- Figure 57: Middle East Radiography Test Equipment Industry Revenue Share (%), by End-user Vertical 2025 & 2033
- Figure 58: Middle East Radiography Test Equipment Industry Volume Share (%), by End-user Vertical 2025 & 2033
- Figure 59: Middle East Radiography Test Equipment Industry Revenue (Million), by Country 2025 & 2033
- Figure 60: Middle East Radiography Test Equipment Industry Volume (K Units), by Country 2025 & 2033
- Figure 61: Middle East Radiography Test Equipment Industry Revenue Share (%), by Country 2025 & 2033
- Figure 62: Middle East Radiography Test Equipment Industry Volume Share (%), by Country 2025 & 2033
List of Tables
- Table 1: Global Radiography Test Equipment Industry Revenue Million Forecast, by Technology 2020 & 2033
- Table 2: Global Radiography Test Equipment Industry Volume K Units Forecast, by Technology 2020 & 2033
- Table 3: Global Radiography Test Equipment Industry Revenue Million Forecast, by End-user Vertical 2020 & 2033
- Table 4: Global Radiography Test Equipment Industry Volume K Units Forecast, by End-user Vertical 2020 & 2033
- Table 5: Global Radiography Test Equipment Industry Revenue Million Forecast, by Region 2020 & 2033
- Table 6: Global Radiography Test Equipment Industry Volume K Units Forecast, by Region 2020 & 2033
- Table 7: Global Radiography Test Equipment Industry Revenue Million Forecast, by Technology 2020 & 2033
- Table 8: Global Radiography Test Equipment Industry Volume K Units Forecast, by Technology 2020 & 2033
- Table 9: Global Radiography Test Equipment Industry Revenue Million Forecast, by End-user Vertical 2020 & 2033
- Table 10: Global Radiography Test Equipment Industry Volume K Units Forecast, by End-user Vertical 2020 & 2033
- Table 11: Global Radiography Test Equipment Industry Revenue Million Forecast, by Country 2020 & 2033
- Table 12: Global Radiography Test Equipment Industry Volume K Units Forecast, by Country 2020 & 2033
- Table 13: Global Radiography Test Equipment Industry Revenue Million Forecast, by Technology 2020 & 2033
- Table 14: Global Radiography Test Equipment Industry Volume K Units Forecast, by Technology 2020 & 2033
- Table 15: Global Radiography Test Equipment Industry Revenue Million Forecast, by End-user Vertical 2020 & 2033
- Table 16: Global Radiography Test Equipment Industry Volume K Units Forecast, by End-user Vertical 2020 & 2033
- Table 17: Global Radiography Test Equipment Industry Revenue Million Forecast, by Country 2020 & 2033
- Table 18: Global Radiography Test Equipment Industry Volume K Units Forecast, by Country 2020 & 2033
- Table 19: Global Radiography Test Equipment Industry Revenue Million Forecast, by Technology 2020 & 2033
- Table 20: Global Radiography Test Equipment Industry Volume K Units Forecast, by Technology 2020 & 2033
- Table 21: Global Radiography Test Equipment Industry Revenue Million Forecast, by End-user Vertical 2020 & 2033
- Table 22: Global Radiography Test Equipment Industry Volume K Units Forecast, by End-user Vertical 2020 & 2033
- Table 23: Global Radiography Test Equipment Industry Revenue Million Forecast, by Country 2020 & 2033
- Table 24: Global Radiography Test Equipment Industry Volume K Units Forecast, by Country 2020 & 2033
- Table 25: Global Radiography Test Equipment Industry Revenue Million Forecast, by Technology 2020 & 2033
- Table 26: Global Radiography Test Equipment Industry Volume K Units Forecast, by Technology 2020 & 2033
- Table 27: Global Radiography Test Equipment Industry Revenue Million Forecast, by End-user Vertical 2020 & 2033
- Table 28: Global Radiography Test Equipment Industry Volume K Units Forecast, by End-user Vertical 2020 & 2033
- Table 29: Global Radiography Test Equipment Industry Revenue Million Forecast, by Country 2020 & 2033
- Table 30: Global Radiography Test Equipment Industry Volume K Units Forecast, by Country 2020 & 2033
- Table 31: Global Radiography Test Equipment Industry Revenue Million Forecast, by Technology 2020 & 2033
- Table 32: Global Radiography Test Equipment Industry Volume K Units Forecast, by Technology 2020 & 2033
- Table 33: Global Radiography Test Equipment Industry Revenue Million Forecast, by End-user Vertical 2020 & 2033
- Table 34: Global Radiography Test Equipment Industry Volume K Units Forecast, by End-user Vertical 2020 & 2033
- Table 35: Global Radiography Test Equipment Industry Revenue Million Forecast, by Country 2020 & 2033
- Table 36: Global Radiography Test Equipment Industry Volume K Units Forecast, by Country 2020 & 2033
Frequently Asked Questions
1. What is the projected Compound Annual Growth Rate (CAGR) of the Radiography Test Equipment Industry?
The projected CAGR is approximately 11.75%.
2. Which companies are prominent players in the Radiography Test Equipment Industry?
Key companies in the market include Waygate Technologies, GE Healthcare, Carestream Health, Olympus , Zeiss, Fujifilm, SLB, Nikon Metrology , Hexagon, TeraRecon.
3. What are the main segments of the Radiography Test Equipment Industry?
The market segments include Technology, End-user Vertical.
4. Can you provide details about the market size?
The market size is estimated to be USD 1.22 Million as of 2022.
5. What are some drivers contributing to market growth?
Advent of Portable Radiography Equipment.
6. What are the notable trends driving market growth?
Application in Aerospace to Account for a Significant Portion of the Market Demand.
7. Are there any restraints impacting market growth?
Rising Privacy and Security Concerns.
8. Can you provide examples of recent developments in the market?
August 2020 - The Indian government identified and listed 6,835 projects under its INR 111 crore National Infrastructure Pipeline to attract investments in infrastructure development.
9. What pricing options are available for accessing the report?
Pricing options include single-user, multi-user, and enterprise licenses priced at USD 4750, USD 5250, and USD 8750 respectively.
10. Is the market size provided in terms of value or volume?
The market size is provided in terms of value, measured in Million and volume, measured in K Units.
11. Are there any specific market keywords associated with the report?
Yes, the market keyword associated with the report is "Radiography Test Equipment Industry," which aids in identifying and referencing the specific market segment covered.
12. How do I determine which pricing option suits my needs best?
The pricing options vary based on user requirements and access needs. Individual users may opt for single-user licenses, while businesses requiring broader access may choose multi-user or enterprise licenses for cost-effective access to the report.
13. Are there any additional resources or data provided in the Radiography Test Equipment Industry report?
While the report offers comprehensive insights, it's advisable to review the specific contents or supplementary materials provided to ascertain if additional resources or data are available.
14. How can I stay updated on further developments or reports in the Radiography Test Equipment Industry?
To stay informed about further developments, trends, and reports in the Radiography Test Equipment Industry, consider subscribing to industry newsletters, following relevant companies and organizations, or regularly checking reputable industry news sources and publications.
Methodology
Step 1 - Identification of Relevant Samples Size from Population Database


Step 2 - Approaches for Defining Global Market Size (Value, Volume* & Price*)

Note*: In applicable scenarios
Step 3 - Data Sources
Primary Research
- Web Analytics
- Survey Reports
- Research Institute
- Latest Research Reports
- Opinion Leaders
Secondary Research
- Annual Reports
- White Paper
- Latest Press Release
- Industry Association
- Paid Database
- Investor Presentations

Step 4 - Data Triangulation
Involves using different sources of information in order to increase the validity of a study
These sources are likely to be stakeholders in a program - participants, other researchers, program staff, other community members, and so on.
Then we put all data in single framework & apply various statistical tools to find out the dynamic on the market.
During the analysis stage, feedback from the stakeholder groups would be compared to determine areas of agreement as well as areas of divergence